Sophos Alpha

Institutional Monitor, 2026

The weekly issue of Sophos Alpha, an independent quantitative research desk: hedge fund flows, systematic positioning, dealer gamma and liquidity across the largest market participants, and what they are mechanically set up to do next.

Caught Unhedged: The Mechanics of a Forced Selloff

How systematic funds were forced to unwind last week, why a market that had just shed its hedges could not absorb it, and what it cost the hedge funds caught on the other side.

This piece is technical. You will not hear a “fundamental reason” for what happened on Nov 5. You can look elsewhere for that, and you will find a thousand different takes on what people “think” happened. In quantitative finance, an opinion without data is considered completely useless.

In our view, the speed and magnitude of the move point to acute leverage and forced de-grossing. Using our in-house models and prime brokerage data, we show how it happened, how it was allowed to run that far, and how it became one of the worst days for hedge fund performance we’ve seen.

Our last two pieces would have had you well positioned on risk if you fully understood them.

Hedges Off

Larger moves in the market happen because the stage is already set for them behind the scenes.

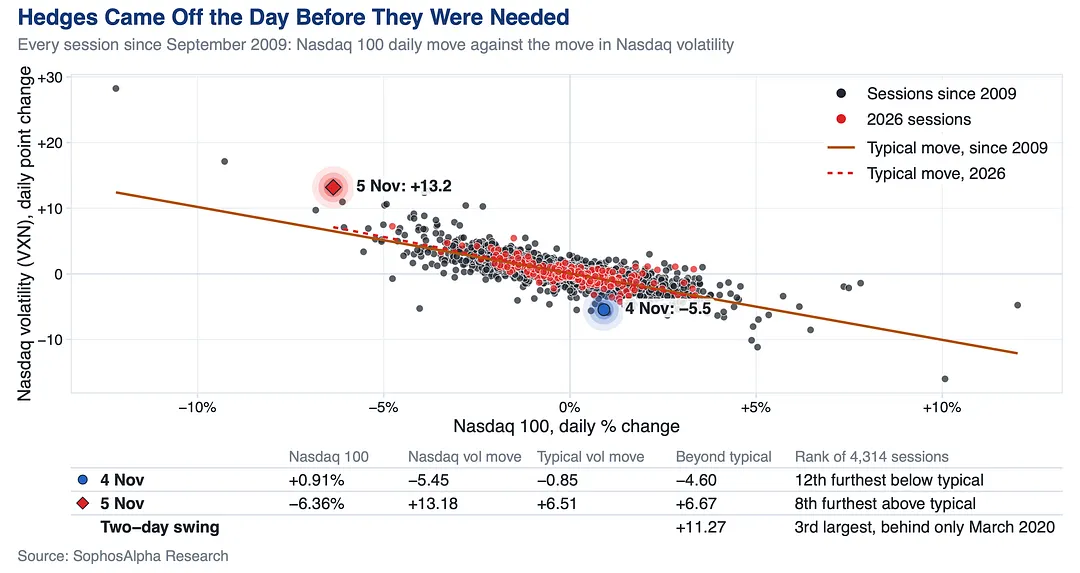
On November 4, with the midterms behind it, the market treated the event risk as cleared and investors sold their protection into the rally. Nasdaq volatility fell six times more than a rally that size usually takes out, the 12th largest gap since 2009. The next day they had to buy it all back, and the VVIX jumped 44.6 points, its biggest one-day rise since the February 2018 volatility crash.

Caught Unhedged: The Mechanics of a Forced Selloff

Read the full issue on Substack

Selling creates volatility. Volatility creates more selling.

Vol control funds are loaded and dealer gamma is thinning: the next sharp drop sells itself. Trend following is where the diversification sits.

Key Takeaways

  • Vol control funds are running near their highest exposure in five years with a cut already locked in. Another 2% drop would force tens of billions of mechanical selling, and roughly twice that on 3%.

  • Dealer gamma fell sharply on Friday and is one bad session from turning negative, where hedging joins the move and next-day swings have run about two and a half times their normal size.

  • Trend following has outperformed every major hedge fund strategy this year, and its real value is diversification: it tends to pay most when an equity sell-off persists.

  • Asset managers have bought back close to half of their record VIX short since early October, so the demand that came from it is far smaller now, while levered funds built their largest Nasdaq long since November.

Portfolio Manager’s Summary

What happens to the market if volatility picks up and persists? We set the fundamentals aside and look only at the selling that mechanical strategies would be forced into.

On our numbers, another 2% decline in the S&P would force tens of billions of mechanical selling from vol control funds alone, and roughly twice that on a 3% decline, with CTAs having already sold and leveraged ETFs selling into the same move, and dealers set to join them once the market’s cushion runs out.
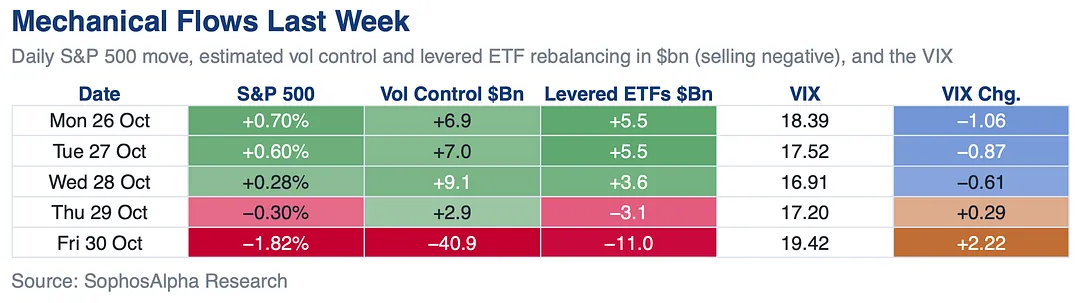
Selling creates volatility. Volatility creates more selling.

Four days of buying, undone in one session.

With vol control exposure already in the top 5% of the last five years, the market is increasingly vulnerable to a self-reinforcing feedback loop.
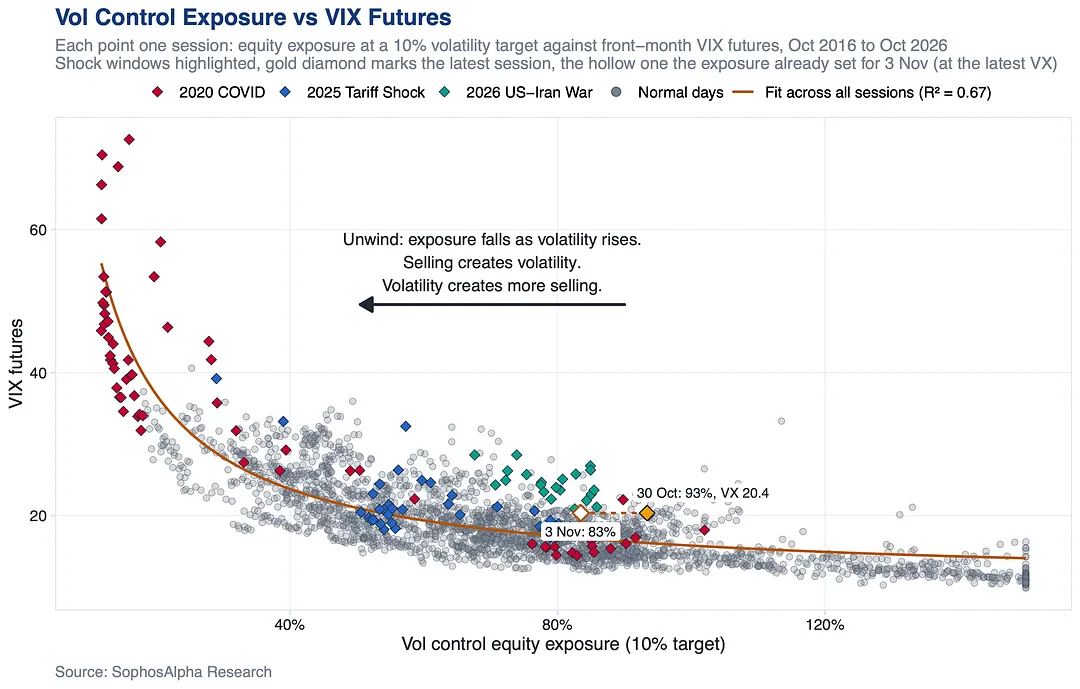
Selling creates volatility. Volatility creates more selling., chart 2

This is not a “view” these funds hold, it is a rule they follow. Their exposure moves inversely with realised volatility, so the calm that let them lever up is the same input that now forces them out. Friday’s drop has already locked in a cut for Tuesday before markets even reopen, and every further sharp down day adds to it. The chart above shows where that path leads if volatility persists: in COVID and the 2025 tariff shock the same funds were pushed down to a fraction of today’s exposure, selling the whole way.

With gamma at spot on the verge of slipping negative, the selling can get uglier.
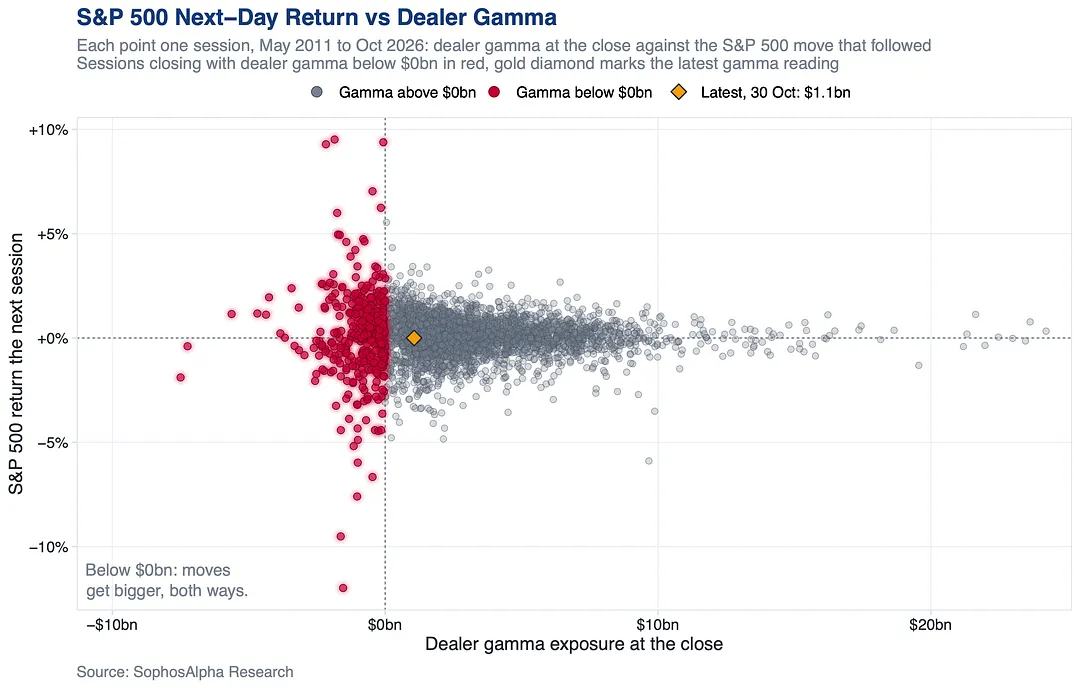
Selling creates volatility. Volatility creates more selling., chart 3

Gamma at spot fell sharply on Friday, and another session like it would take it below zero. Above zero, dealer hedging leans against the move. Below it, the hedging joins the move, and next-day swings have run about two and a half times their normal size, in both directions. Forced sellers meeting a market that has lost its cushion is how a pullback turns into a run.

Key takeaway: The selling from here is mechanical, not discretionary. Vol control funds are running near their highest exposure in five years with a cut already locked in, and dealer gamma at spot is one bad session away from turning negative. A quiet week lets both reset; another sharp down day hands the market forced sellers and no cushion at the same time.
Read the full issue on Substack

Commodities did the hedging this year

Energy doubled while bonds lost money, and stocks and bonds both fell with rising oil. Trend followers still hold their energy longs.

Key Takeaways

  • Commodities did the hedging this year: energy doubled while bonds lost money, and stocks and bonds both fell with rising oil.

  • Trend followers still hold their energy longs at the same entries and are short every metal.

  • Vol control funds are at their fullest since October 2025, and dealers have slipped into negative gamma heading into the Fed.

  • Asset managers covered a quarter of their VIX short, while managed money sold crude for a sixth week and gold for an eighth.

Hedging Portfolios With Commodities

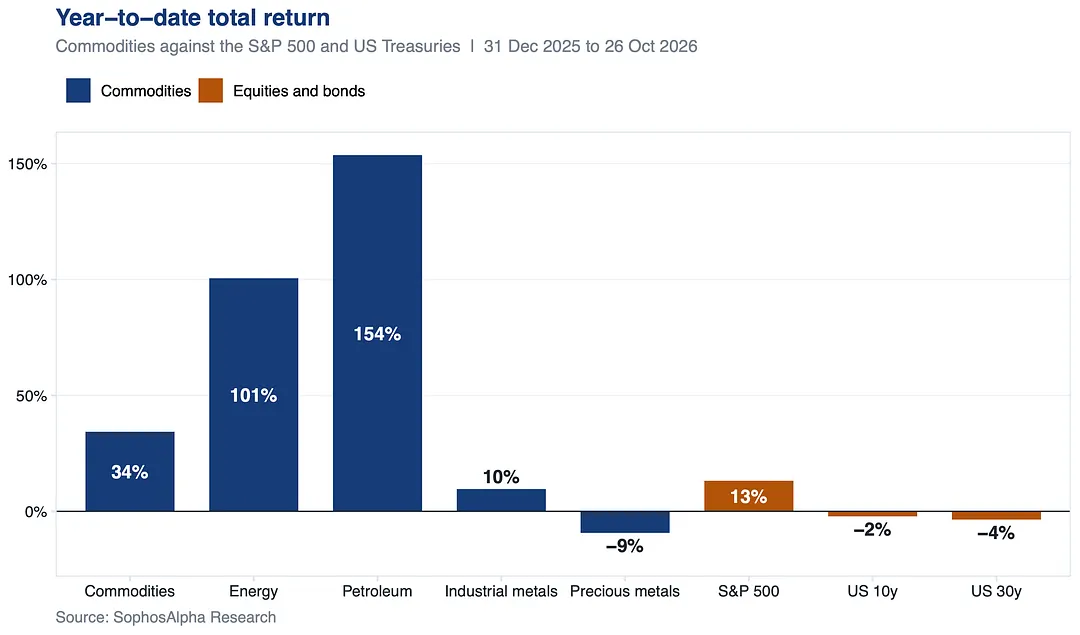
Commodities did the hedging this year. The Bloomberg Commodity Index has returned roughly a third since January, energy has doubled and the oil complex is up more than 150%. Over the same stretch the S&P made 13% and Treasuries lost money at both the 10y and the 30y. Bonds, the leg meant to protect a portfolio, fell, and commodities did the protecting.

Commodities did the hedging this year

Not every commodity played its part. Precious metals are down 9% on the year, so gold, the textbook hedge, did not do the work. The return came from energy, and from supply shocks that hit oil far harder than they hit stocks.

We flagged the trade last week: trend followers were as long oil and as short government bonds as they have been only twice in 20 years, in the 2022 inflation shock and now.

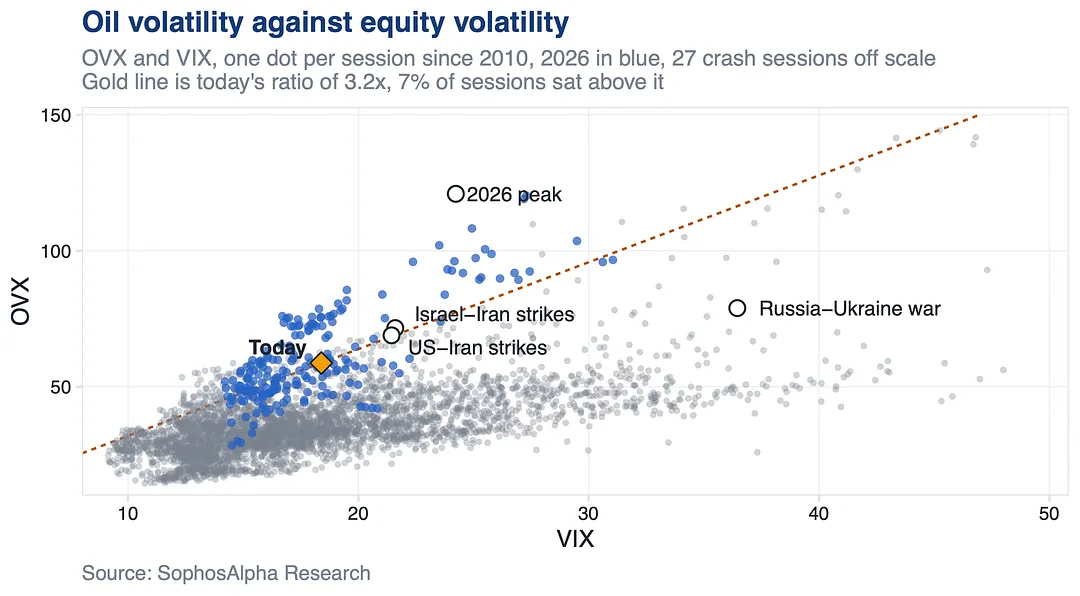
Oil has been the far more violent market this year. Oil volatility has run at a median 3.3 times equity volatility in 2026, the highest of any year since 2010 and well above the usual 2 times. That is the cost of the hedge: today’s ratio of 3.2 times has been exceeded on only 7% of sessions since 2010, so a commodity position carries roughly three times the risk of the same amount in equities.

Commodities did the hedging this year, chart 2

The case does not rest on this year’s return. Stocks and bonds have both fallen with rising oil more consistently this year than in any year since 2000, so a commodity position protects both legs of a portfolio at once.

That holds even if crude and European gas ease from here as Mideast supply adapts: escalation or a cold European winter can still push energy sharply higher, and that is the shock a stock and bond portfolio is least protected against. We think a small commodity allocation earns its place, tactically and structurally.

The takeaway: commodities hedge supply and inflation shocks rather than every shock, they belong in small size, and this year the protection came through energy, not gold. Below is how trend followers are holding that trade now.

Read the full issue on Substack

Asset managers got caught in a record VIX short

The crowded volatility trade got tested on Friday. Dealers are no longer cushioning moves, the book is thinner and vol control funds are at their fullest in a year.

Key Takeaways

  • Extreme short positioning by asset managers in VIX futures has coincided with strong VIX forward returns.

  • Systematic funds have little left to buy, with trend followers long only the S&P and Nasdaq among US indices and vol control funds at their fullest in a year.

  • The market’s cushion is gone, with dealer gamma near zero and a thinner order book heading into Monday.

  • Asset managers took 10y length to a fresh record, while managed money cut crude for a fifth straight week and gold for a seventh.

Portfolio Manager’s Summary

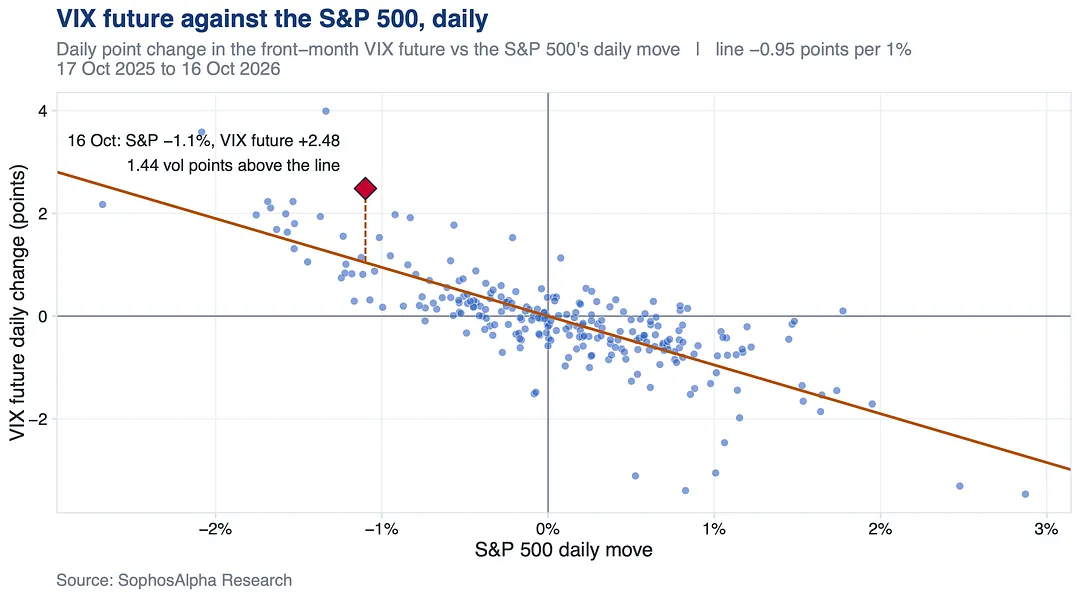
Friday was the day the crowded volatility trade got tested. With the S&P down a little over 1%, the front-month VIX future rose about one and a half vol points more than that decline would normally explain, and as much as three points intraday, a move seen only a handful of times in the past two years.

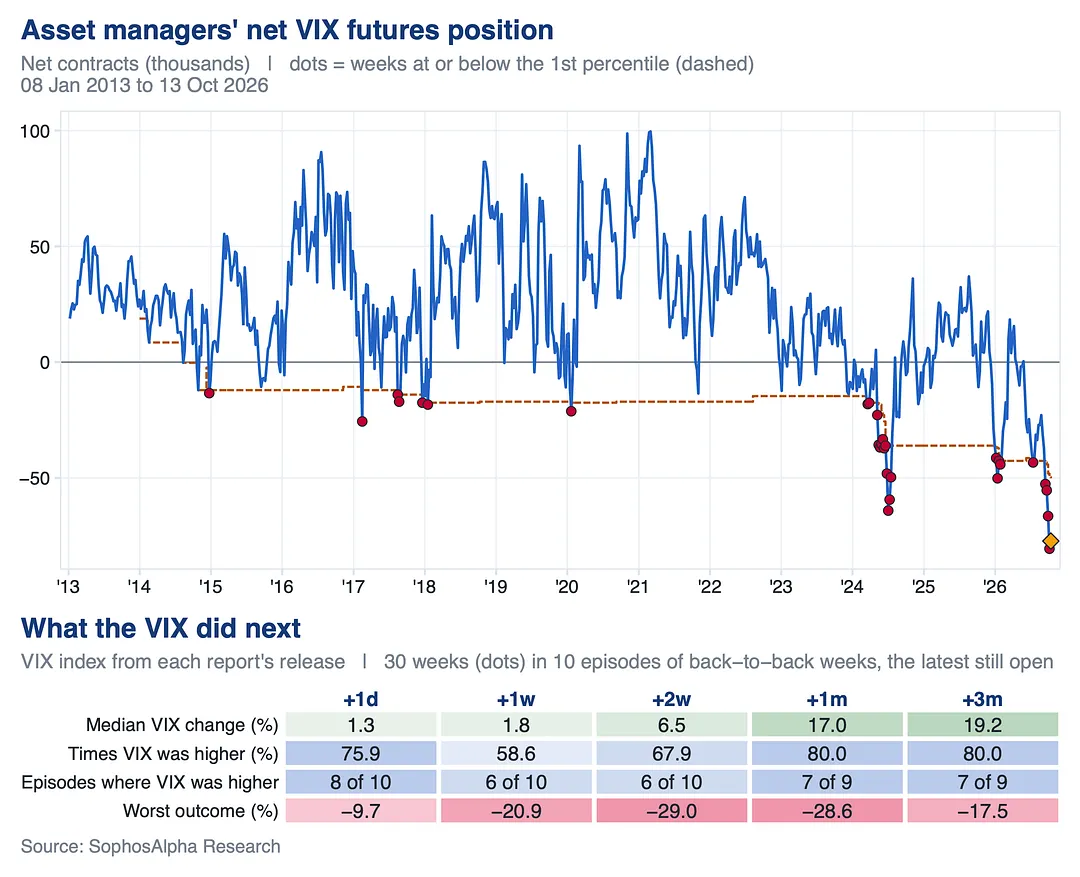
Asset managers went into the session with a record short in VIX futures, built over six weeks and barely trimmed since it peaked the week before, and when the tape turned that short had to be covered into a rising market.

Asset managers got caught in a record VIX short

The positioning history puts Friday in context. Each dot on the chart below marks a week when this cohort was as short as it is now.

  • The July 2024 short, the deepest on record until last month, ran straight into the yen carry unwind, when the VIX tripled from the low teens to near 40.

  • The January 2026 short preceded the US and Israeli strikes on Iran, with the VIX climbing from the mid teens to above 30 by late March.

Of the nine episodes with a full month behind them, the VIX was higher a month later in seven.

Asset managers got caught in a record VIX short, chart 2

The difference this time is the starting point: those episodes began with volatility cheap, while this one met Friday with the VIX already jumping, so part of the move is behind us.

What remains is the setup the rest of this issue describes, with dealers no longer cushioning moves, a thinner book and vol control funds at their fullest in a year. If the covering continues, the scramble for volatility lands on a market with little left to absorb it.

Read the full issue on Substack

Bond positioning has split in two

Quant funds profited from short duration while discretionary managers carry the long overhang. CTAs are long only the S&P and Nasdaq, and the gamma flip sits under half a percent below spot.

Key Takeaways

  • Bond shorts paid: CTAs made more than 4% in September, the best of any hedge fund category, and now trail only tech-focused funds this year.

  • CTAs are long only where it counts: S&P and Nasdaq near full, Dow, Russell and Midcap short, so a pullback has plenty to sell.

  • The cushion is real but thin: the S&P book is at its deepest since late September and gamma is positive, yet the flip sits less than half a percent below spot.

  • Real money keeps loading the 10y: asset managers pushed 10y length to a decade high even as they sold the long end.

Portfolio Manager’s Summary

Bond positioning has split in two. Quant funds have profited from building short duration over the past month, while discretionary managers have been scrambling to contain the long duration and spread exposure they carried into the selloff.

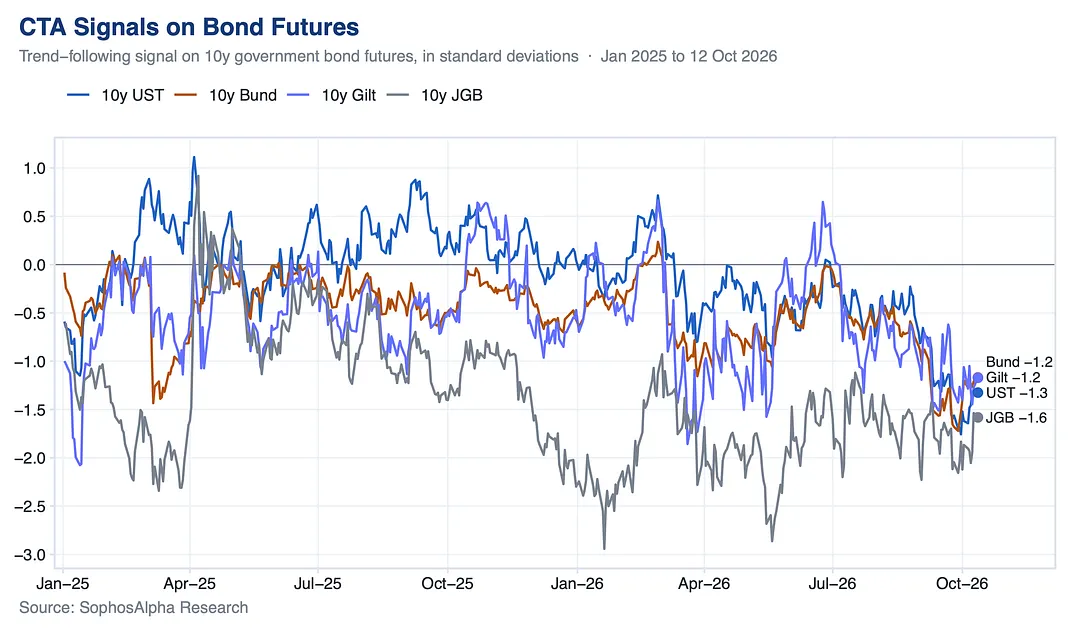
We flagged on 29 August that every government bond market screened short for trend followers, and those shorts have only grown more profitable since.

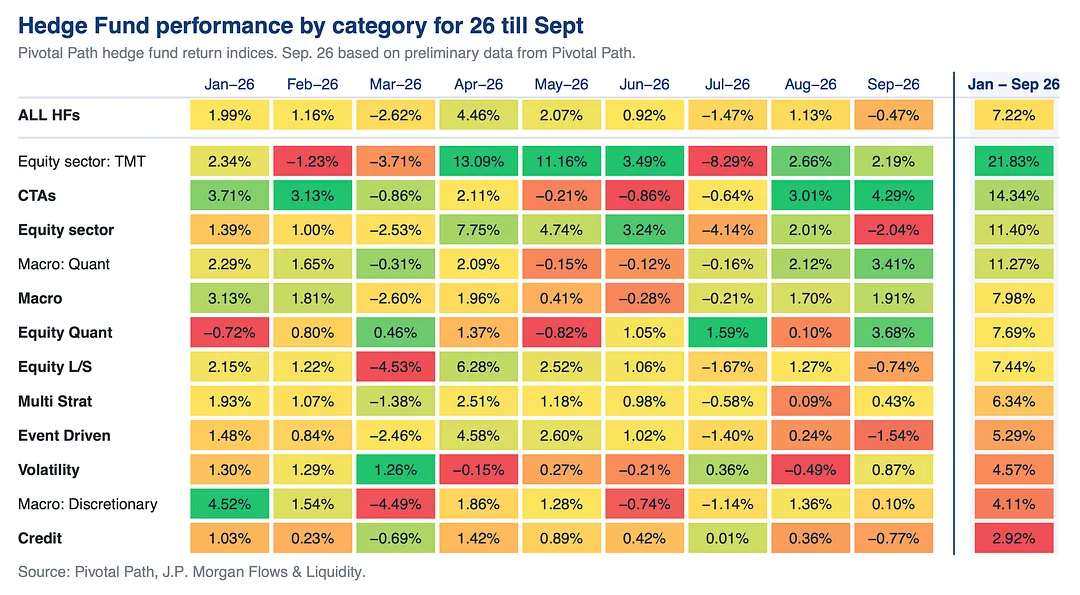
September’s hedge fund returns show the split. Quant funds took advantage of the bond selloff and the swings in tech stocks, with CTAs, quant macro and quant equity funds all returning around 3% to 4% on the month. CTAs were the best performing category and now trail only tech-focused equity funds this year. Discretionary macro and equity long/short were flat to slightly down, and the mostly discretionary event driven, credit and equity sector funds lost ground.

Bond positioning has split in two

Real money is still carrying the long duration overhang

Discretionary managers, real money in particular, are still working it off. Active bond funds lifted their duration to elevated levels in recent weeks, balanced funds held above average bond exposure and have been retreating, and the cutting shows up in futures into the end of September. Asset managers are selling the long end, yet their 10y Treasury length remains the largest in over a decade, so much of the overhang is still in place.

CTA bond shorts have reached an extreme

The short build is just as visible in CTA signals, which hit their most stretched in Treasuries and Bunds since October 2023 on 30 September. That helped returns over the past month but leaves the cohort exposed to a reversal into the fourth quarter: the last time these signals read this short, both futures rallied more than 6% into year end.

Bond positioning has split in two, chart 2

That raises two-way risk for bonds. Either stretched signals push trend followers to take profit, reversing some of the recent rise in yields, or discretionary managers amplify the selloff by cutting their duration and spread exposure further. We lean to the second in the near term, because the discretionary bond book is the larger of the two.

Read the full issue on Substack

Where rates start to hurt equities

The 10-year is at its highest since 2002, stocks already trade like a 6% world, and the multiple is priced for inflation near 1%. CTAs are full long with a 2% cushion before they flip.

Key Takeaways

  • The 10-year is at its highest since 2002, stocks are already trading like a 6% world, and the multiple is priced for inflation near 1%, so any inflation-driven rise in yields comes straight out of valuations.

  • CTAs are full long the S&P with barely a 2% cushion before they flip, and volatility-targeting funds hold their most exposure since March, so both books add little on further upside and sell together on a shock.

  • Hedge funds and institutional money managers have dumped S&P 500 futures at the fastest pace since 2022, while levered funds added Long Bond shorts at the fastest clip in over six years.

  • Coming to Sophos Alpha: an open library of quantitative finance articles, research papers, an academia shelf with the latest papers in quant finance, and a daily risk monitor, all free to access. Details at the bottom of this issue.

Portfolio Manager’s Summary

The 10-year is at 5.31%, its highest close since April 2002, up more than a full point since January with the Fed back to hiking in September. We flagged the odds of this in our 17 September note, and the 10-year is up 36bp since. Today’s read builds on the latest rates research circulating across the street, rebuilt on our own data.

The question is no longer whether rates are high, but at what level they start to hurt equities.

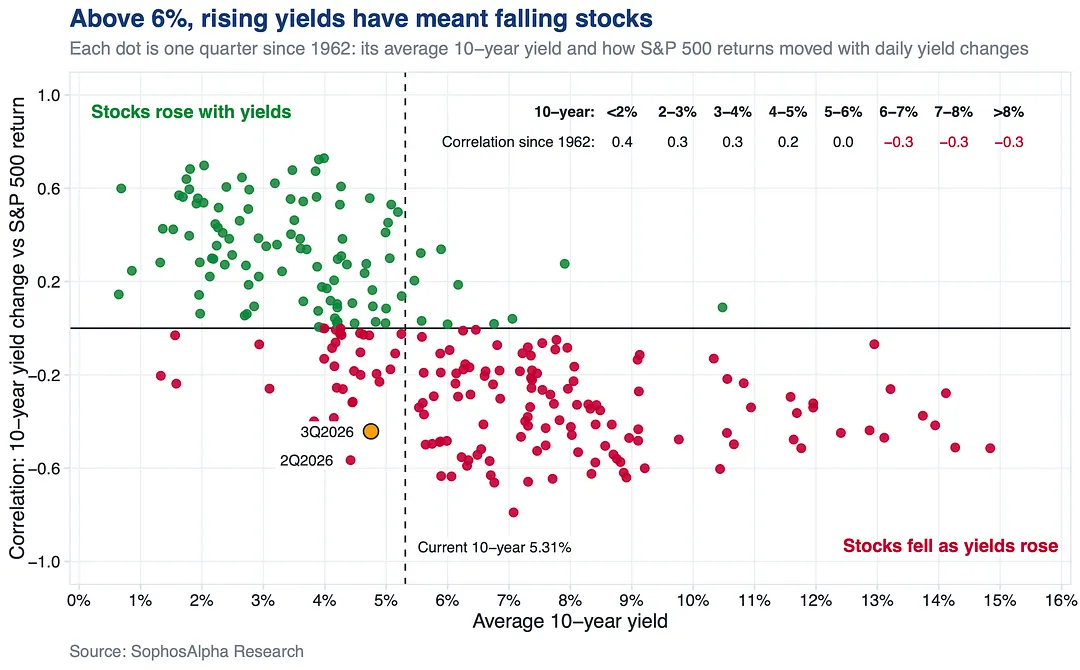
History gives a clear ladder. Around 5%, bonds start competing with stocks for the same dollar. Above 6%, rising yields have come with falling stocks in 95% of quarters since 1962. Above 7%, valuations compress.

Where rates start to hurt equities

We sit just under that line, but the tape is not waiting for it. The last two quarters already traded like a 6% world: at average yields of only 4.4% and 4.75%, stocks fell on the days yields rose more consistently than in any quarter below 5% since 1962.

The 10-year now yields more than the S&P earns, the widest gap since 2002.

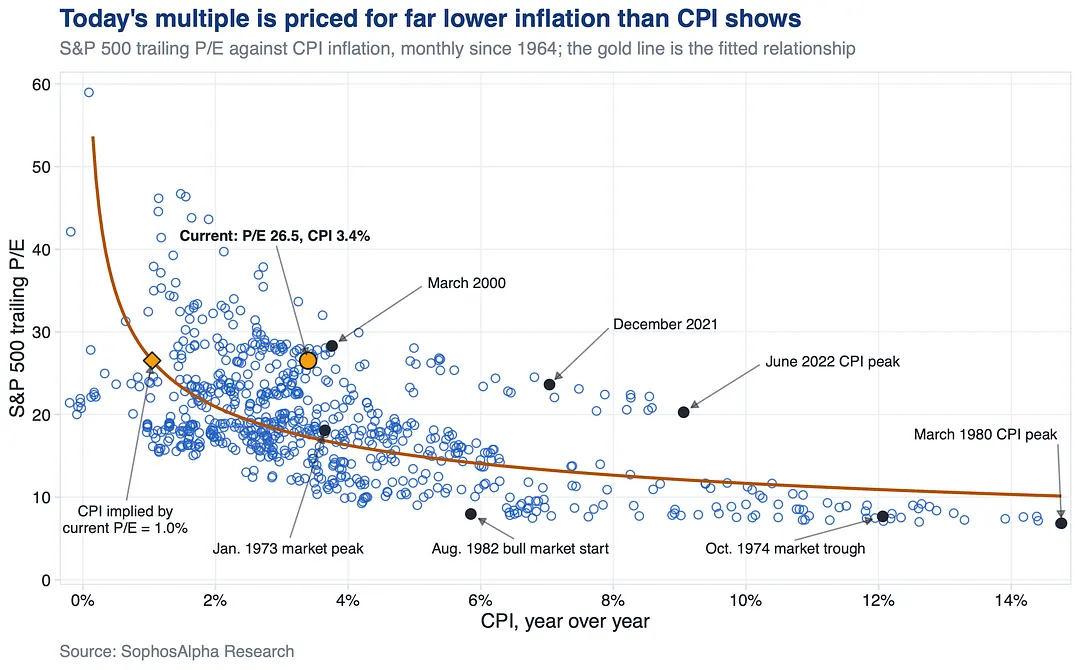
That leaves little room in the multiple. The S&P trades at 26.5 times trailing earnings, richer going into a first hike than at the start of any hiking cycle since 1999, and on the long-run link between inflation and valuations that multiple is priced for inflation near 1%. CPI is running at 3.4%. Bonds are already priced for the inflation we have; the multiple is not.

Where rates start to hurt equities, chart 2

Why yields are rising decides how this resolves. Growth, productivity and deregulation are rate rises equities can live with, because earnings carry the multiple. Inflation, sovereign risk and a buyers’ strike in Treasuries are not. The 1970s showed the cost: the S&P went from 18 times earnings at the January 1973 peak to under 8 at the October 1974 trough as inflation surprised. If the next leg higher in yields comes from inflation, the multiple is where it gets paid for.

Read the full issue on Substack

An index book without Energy is short oil

Energy leads the S&P by moving against it, the hardest since the 1990 Gulf War. CTAs are long, vol control funds are at their fullest in a year, and levered funds leaned against the Nasdaq.

Key Takeaways

  • Energy leads the S&P this year while moving against almost every other sector, and the index now trades against oil harder than at any point since the 1990 Gulf War, leaving any index book without Energy effectively short oil.

  • CTAs remain long the S&P and vol control funds sit at their fullest in a year after a month of building, so both books are loaded into a calm tape and would be selling together once volatility returns.

  • Levered funds leaned against the Nasdaq’s record close with their heaviest week of futures selling since April 2025, while asset managers bought back into the S&P and managed money took copper to its largest length in a year.

Portfolio Manager’s Summary

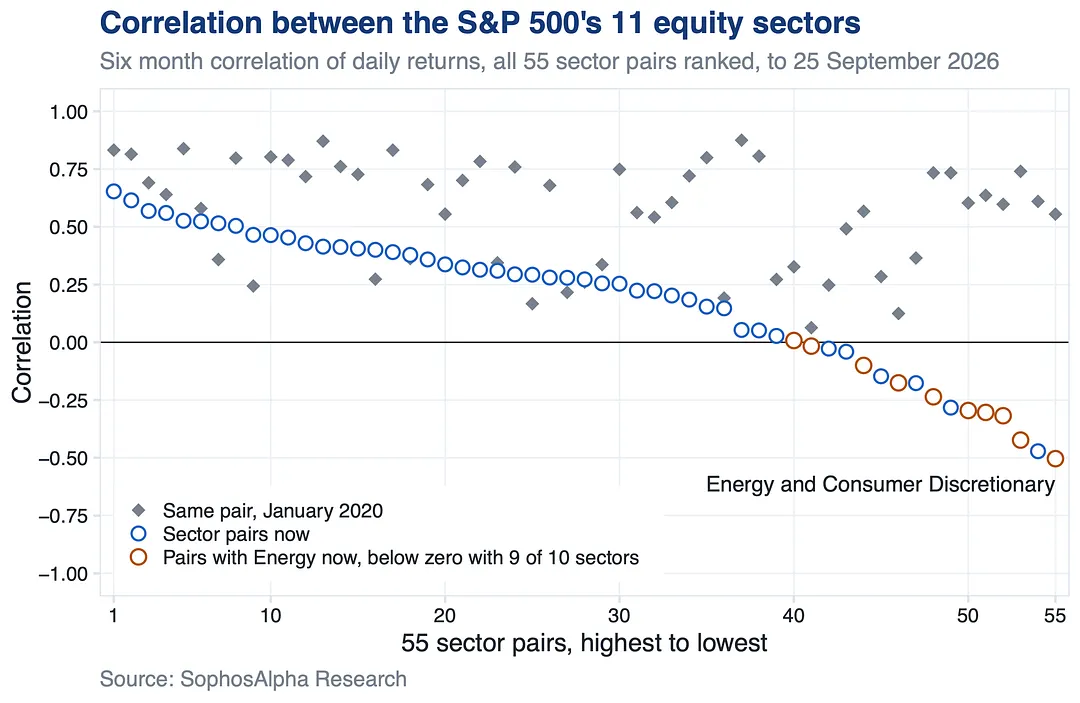
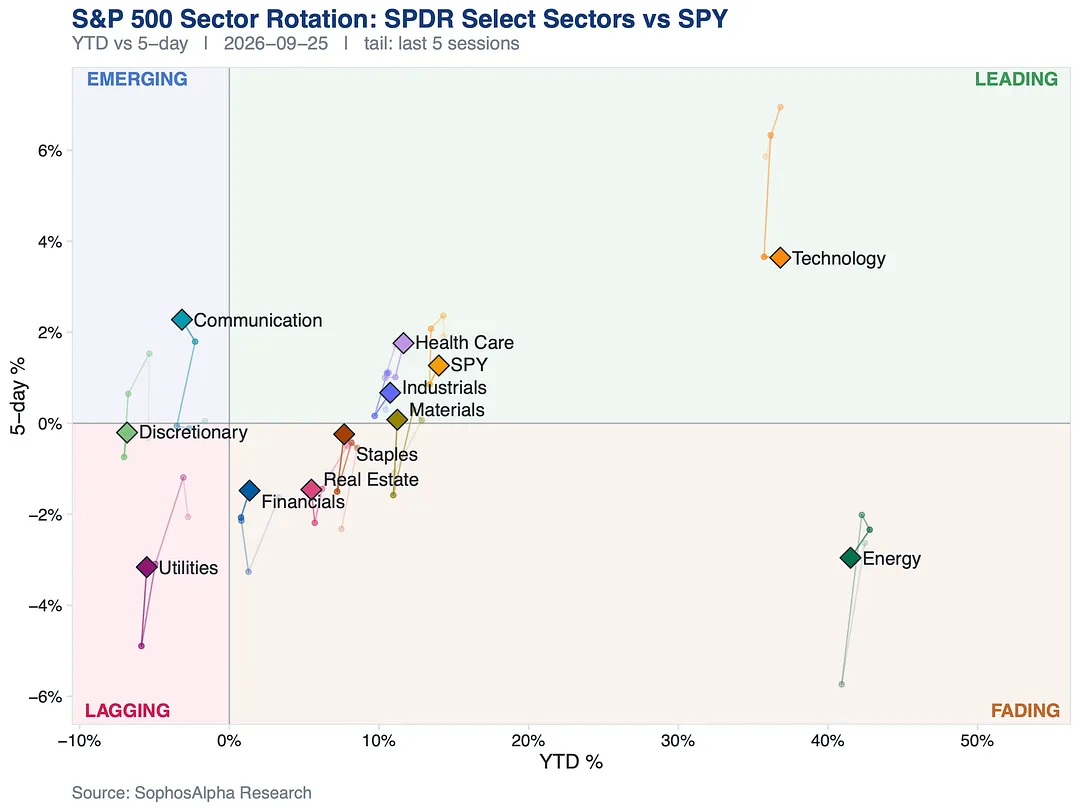
Energy is the best performing sector in the S&P this year, and it is winning by going the other way. It now moves against almost every other sector in the index, where at the start of 2020 they all moved together.

That is new even for Energy. When it last led the market in 2022, it still rose and fell with everything else and simply outran it.

An index book without Energy is short oil

What changed is not Energy, which tracks crude at least as closely as it usually does. What changed is the rest of the index, which now trades against oil harder than at any point since the 1990 Gulf War. On the days crude has jumped since the spring, the S&P has fallen far more often than not.

An index book without Energy is, in effect, short oil.

An index book without Energy is short oil, chart 2

Last week showed it in real time. Crude fell sharply and Energy followed it lower, while Technology led every sector and the S&P finished the week higher. The year’s two best performers now sit at opposite ends of the same tape. That makes Energy the clearest offset to an index book while oil sets the direction, and it cuts both ways. If crude keeps sliding, Energy gives back ground while the rest of the index gains.

Read the full issue on Substack

The 10-year above 5%, a setup seen nineteen times since 1964

Each time was followed by below-normal equity returns out to a year. CTAs are long after a trim, not a turn, vol control funds have re-levered, and positive dealer gamma absorbed the FOMC.

Key Takeaways

  • The 10-year is above 5% and at the top of its multi-year range, a setup seen nineteen times since 1964 and followed by below-normal equity returns out to a year, widest over the next quarter.

  • CTAs are still long the S&P after a trim, not a turn, and vol control funds have re-levered: fuller books, so upside is thinly bought and a break has length to sell.

  • Positive dealer gamma and a rebuilt order book absorbed the FOMC session, and that cushion holds while gamma stays this high.

Rates Watch

Higher yields have historically been a headwind for equity valuations, yet equities have tolerated the rise since 2023 better than the old relationship implied, carried by earnings growth and the AI investment cycle.

With the US 10-year now above 5% after a global and fast repricing, the question is where the pain threshold lies.

Speed matters more than level: gradual rises get absorbed, abrupt ones have coincided with weaker equity returns, and the latest move sits close to that pace.

The 10-year above 5%, a setup seen nineteen times since 1964

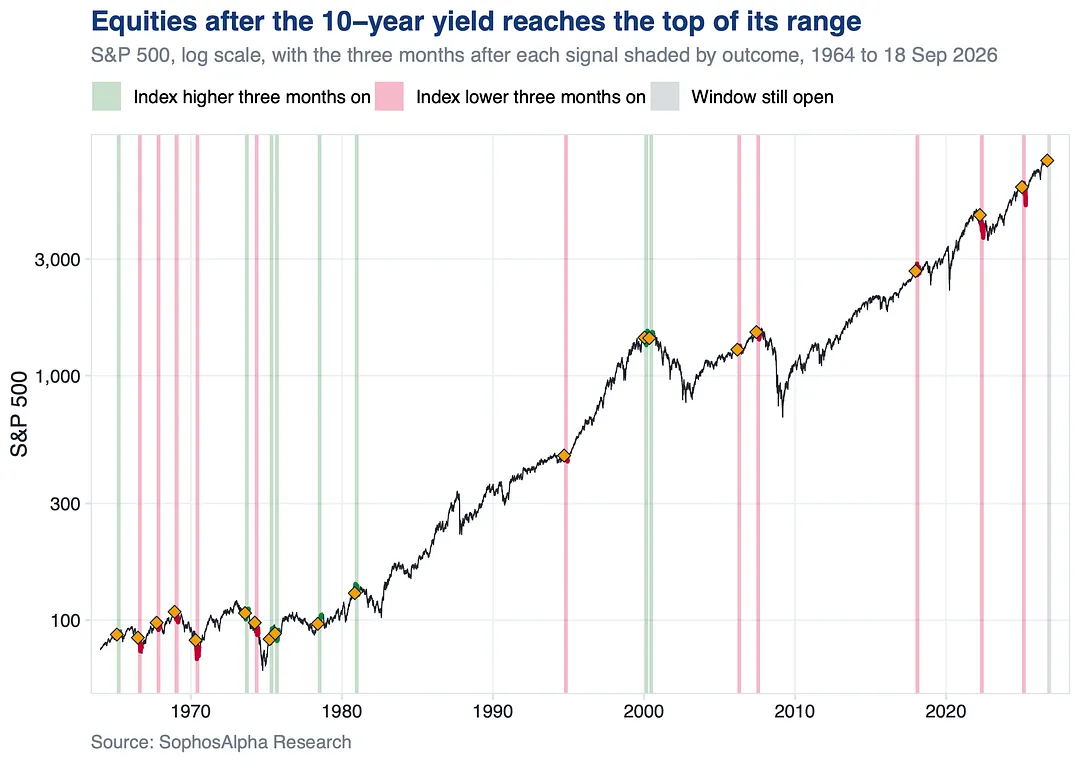
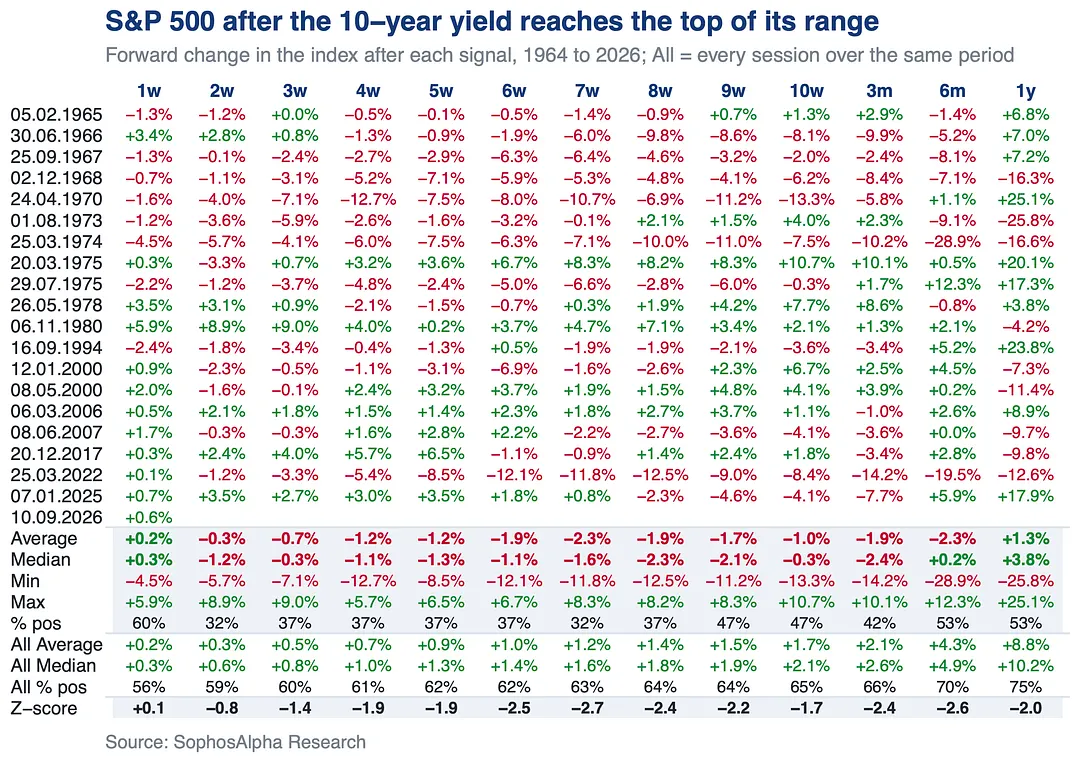
We track where the 10-year sits within its multi-year range and flag the point at which it reaches the top, the level at which rates are stretched relative to the recent environment. The signal has fired nineteen times since 1964 before this one, infrequently, and often alongside tighter financial conditions and weaker equity performance; it was live around three of the last four bear markets. The most recent triggered in January 2025, shortly before that spring’s correction, and it is on again now.

The 10-year above 5%, a setup seen nineteen times since 1964, chart 2

Forward returns deteriorate once yields enter this zone: average and median returns after a signal run below normal from two weeks out to a year, widest between one and three months, and drawdowns get deeper. It is a warning indicator, not a timing tool. It does not imply an imminent correction, but the risk-reward is less favourable while yields sit in the most stretched part of their range.

Read the full issue on Substack

The calm is mechanical

Trend followers are full in US equities and trimming everywhere else, dealers are pinning the tape and vol control funds are buying it, which holds until the first real shock and then reverses.

Key Takeaways

  • Trend followers are full in US equities and trimming everywhere else. The upside from here draws little buying; a break lower has a lot of length behind it.

  • The calm is mechanical. Dealers are pinning the tape and vol control funds are buying it without price doing anything, which holds until the first real shock and then reverses.

  • Positioning is thin where the tape is calm and stretched where it is not: levered funds pressing index shorts into a week that turns on the FOMC and a quarterly expiry.

Systematic Investor Summary

Most of this year’s gains for systematic traders came early, when trend followers caught strong moves in energy, rates and currencies. Performance has been uneven since, with established trends reversing repeatedly in commodities, fixed income and AI related equities. A small loss in July was followed by a solid rebound in August, and the year to date remains firmly positive. Positioning is broadly long equities and select commodities, with trend signals still short duration across the major government bond markets.

The calm is mechanical

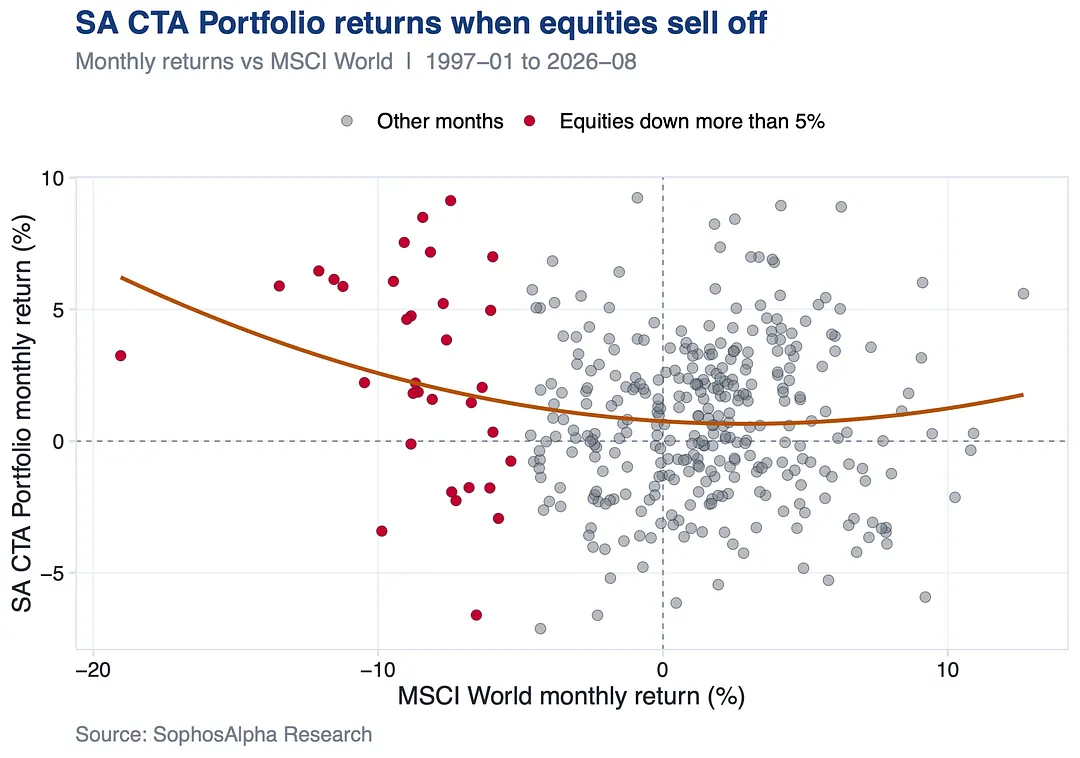
The challenge is not a lack of trends but their lack of persistence. AI driven boom and bust cycles, geopolitical flare ups and shifting expectations on inflation and Fed policy keep cutting moves short before medium term models can capture them. Near term mean reversion stays a headwind, but the same concentration and macro uncertainty could produce more durable trends. A prolonged equity correction or a persistent shock to inflation, rates or geopolitics is the environment in which CTAs have historically delivered their strongest diversification benefits, which is what the chart above shows for our own book against world equities.

Read the full issue on Substack

Hedge funds are deployed but not directional

Gross leverage rose while net exposure sits at its lowest in over a year, the most room to re-lever of any cohort. CTAs have nothing left to add, and positive dealer gamma is absorbing the shocks.

Key Takeaways

  • Hedge funds are deployed but not directional. The book is fully invested while net exposure sits at its lowest in over a year, leaving the most room to re-lever of any cohort we track.

  • CTAs have run elevated longs since April with nothing left to add, so further upside draws only marginal buying while a downside break has real length to sell.

  • Positive dealer gamma and a rebuilt order book are doing the shock absorption, and the Nasdaq’s record positioning build means that cushion is no longer cheaply owned.

Portfolio Manager’s Summary

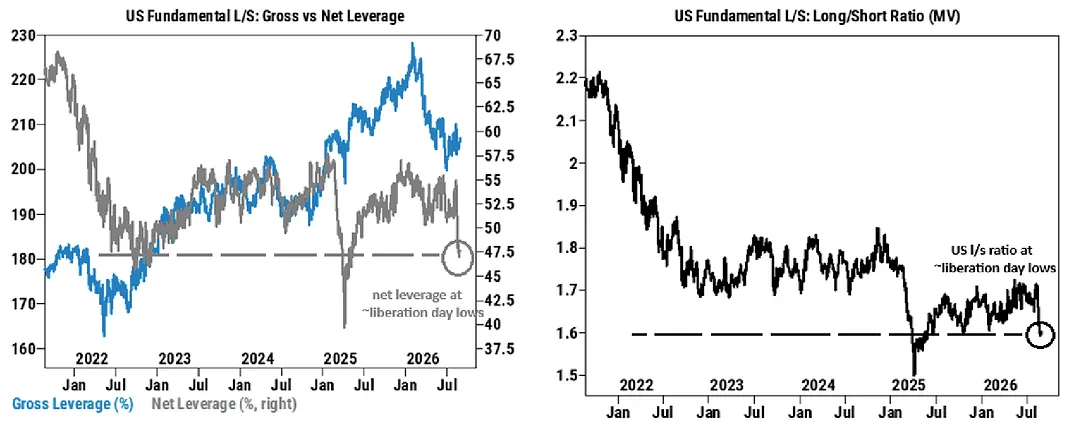
Hedge funds added risk at the margin last week without changing their posture. Gross leverage rose to 208.5% and net to 48.4%, with the long/short ratio ticking up to 1.605, but both net exposure and the long/short ratio still sit at the lows last seen in April 2025, in the bottom few percent of the past year.

Hedge funds are deployed but not directional

Source: Goldman Sachs

The buying was selective: single stocks were net bought for the first time in three weeks with longs outpacing shorts 1.6 to 1, led by Info Tech, Comm Svcs and Financials, while index and ETF products were net sold almost entirely through fresh shorts. Real Estate was sold for a fourth straight week at the fastest pace in nearly seven months. So the book stays fully deployed while the directional risk inside it sits near multi-year lows, which is the setup that leaves the most room to re-lever if the tape keeps holding.

Read the full issue on Substack

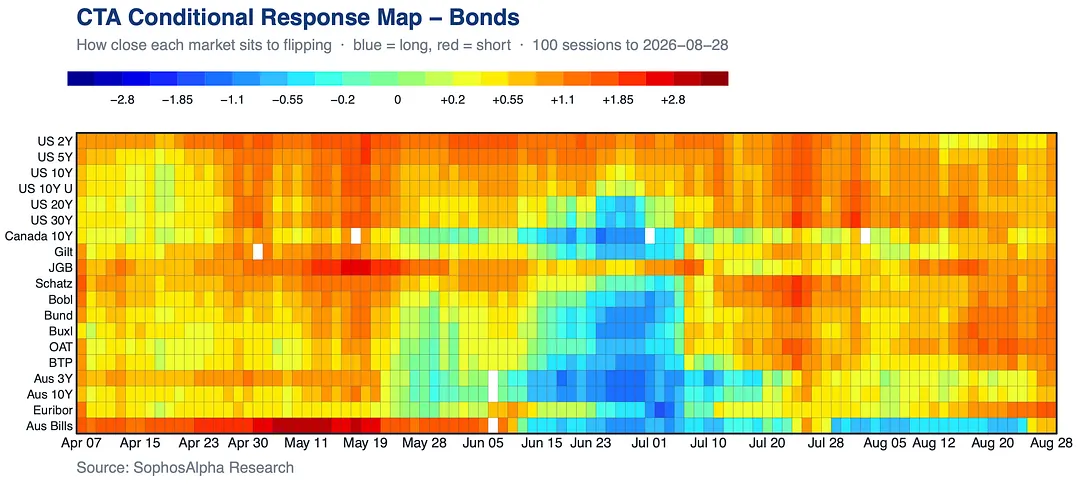
Every government bond market screens short

Hedge funds strip out directional risk without shrinking the book, and systematic bond positioning is one-sided: a sustained rally would force a meaningful unwind of the shorts.

Key Takeaways

  • Hedge funds are hedged, not out. The book is still fully deployed, but the way it is held has quietly shifted to the most defensive setup in a year.

  • Bonds are where the asymmetry sits. Systematic positioning is one-sided across the entire government bond complex, and the risk is not where most expect.

  • The calm is doing more work than it looks. Vol is pinned near multi-year lows, but the mechanics holding it there are thinner than the tape suggests.

Portfolio Manager’s Summary

Hedge funds are stripping out directional risk without shrinking the book. Gross leverage rose to 207% while net fell to 47.6% and the long/short ratio slipped to 1.597, both in the bottom 1% of the past year. The short book grew twice as fast as the long book. Funds covered index and ETF shorts but sold single stocks at 3.3 shorts to every long, rotating out of defensives into cyclicals.

Systematic Strategies

Our CTA model tracks systematic positioning across ~70 global futures markets. The standout this week is bonds: every government bond market now screens short, which implies the balance of risks is somewhat asymmetric. Further weakness should generate relatively modest incremental selling, while a sustained rally would force a more meaningful unwind of existing shorts and provide a mechanical tailwind to bonds.

Every government bond market screens short

Read the full issue on Substack

Up days are more volatile than down days, the most since 1986

New highs with a reflexive signature. CTAs are already long, vol control funds still have room to add, and speculative money remains short index futures and duration.

Key Takeaways

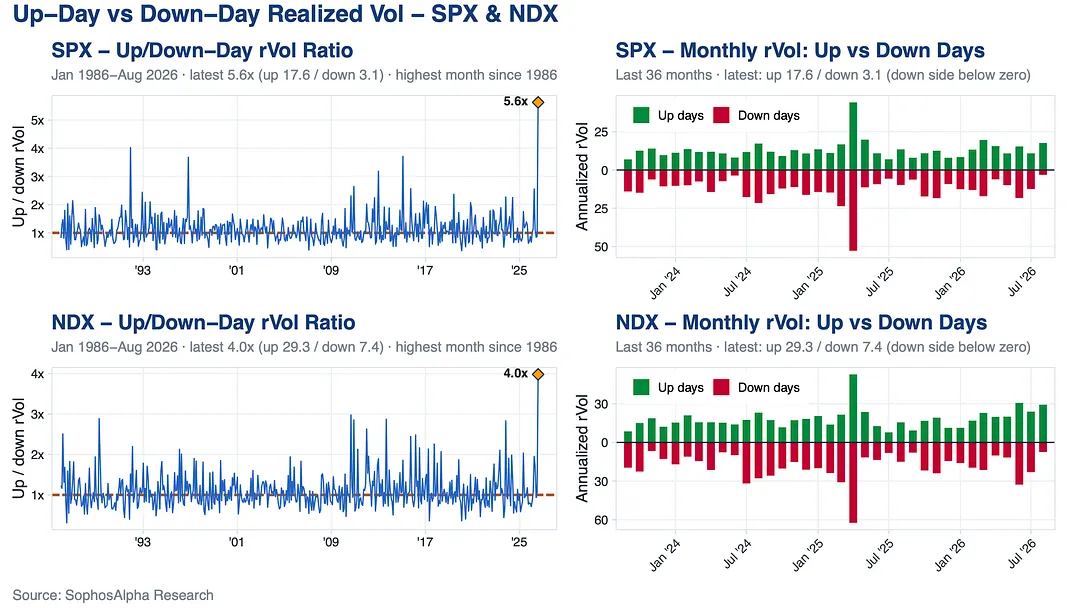
  • Equities are grinding to new highs with an unusual signature: realized volatility on up days is now dominating down days by the widest margin since 1986, a 100th percentile reading for both the S&P 500 and Nasdaq, meaning the rally itself is happening in a volatile, reflexive way rather than a calm one.

  • Systematic flows are reinforcing the move but from different starting points. CTAs are already comfortably long with de-risking thresholds far from spot, while vol-control funds are still rebuilding exposure off recent lows and have real room left to add if realized vol stays contained, alongside hedge funds net buying equities at their second fastest pace of the past year.

  • Broader positioning data shows speculative money is still underexposed to the rally. Leveraged funds remain net short equity index futures and short duration in rates, and Nasdaq futures positioning only just flipped back to net length after briefly turning negative, suggesting there’s still room for further chasing if the trend holds.

Portfolio Manager’s Summary

US equities made new all-time highs last week with the S&P 500 finishing up another +0.4% amid a string of benign inflation prints (CPI, PPI,Retail Sales, U Mich), broad earnings strength, and relative AI optimism.

The ratio of realized volatility on up days versus down days for the S&P 500 and Nasdaq 100, and it’s currently sitting at the highest level since 1986, a 100th percentile reading for both indices.

Up days are more volatile than down days, the most since 1986

In plain terms, when this market rallies, it rallies with more turbulence than when it sells off, a complete reversal of the historical norm where down days are typically the volatile ones.

Read the full issue on Substack

Latest issues