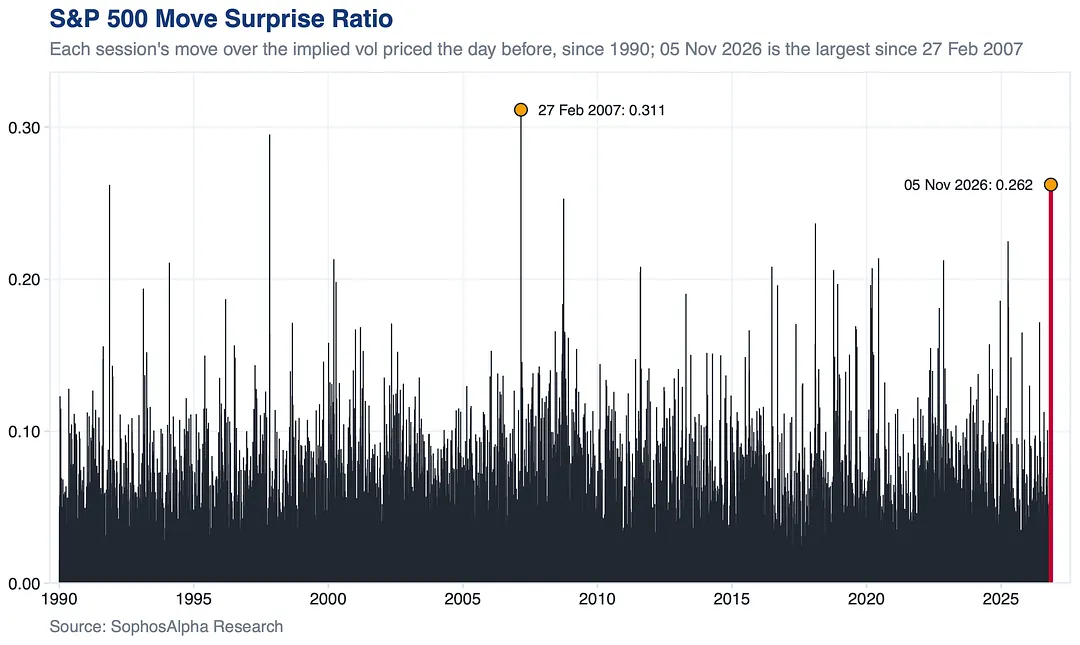
The options market priced about a 1% day for the S&P 500 last Thursday.
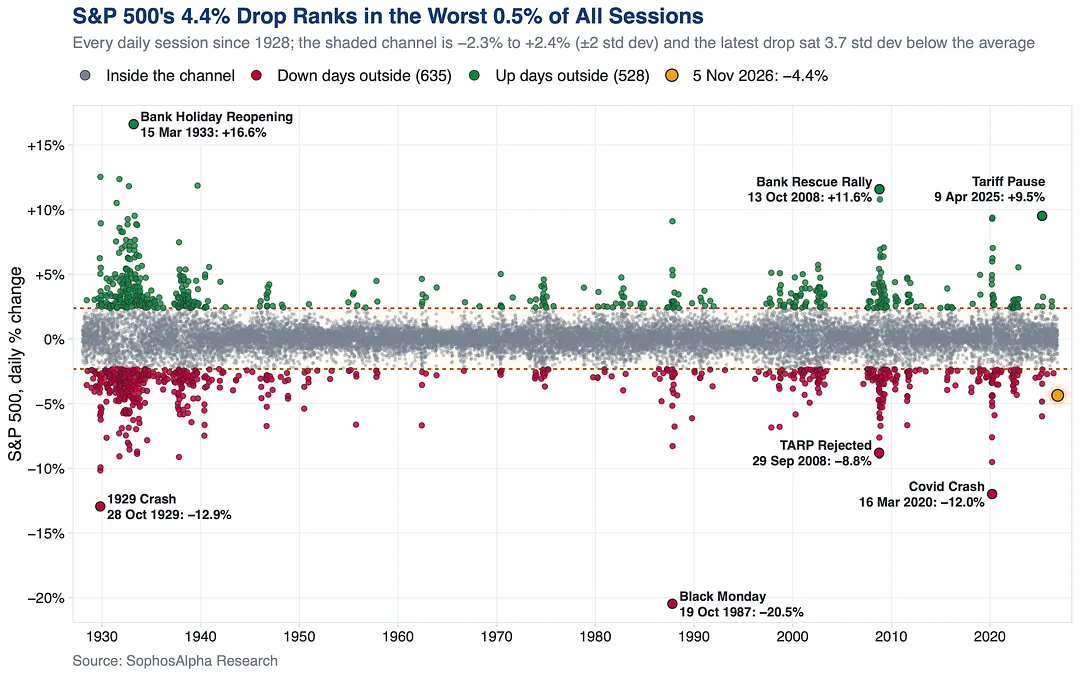
It fell 4.4%, four times that.
Against the volatility priced the day before, it was the biggest surprise since February 2007 and the third biggest since 1990.
The desk notes of Sophos Alpha, an independent quantitative research desk. Daily market notes across many topics, including CTAs, risk parity, vol control and other systematic funds, hedge fund activity and investor sentiment, dealer gamma and liquidity, volatility and tail risk, in equities, rates, currencies and commodities.
the 30 newest
10 notes
It fell 4.4%, four times that.
Against the volatility priced the day before, it was the biggest surprise since February 2007 and the third biggest since 1990.
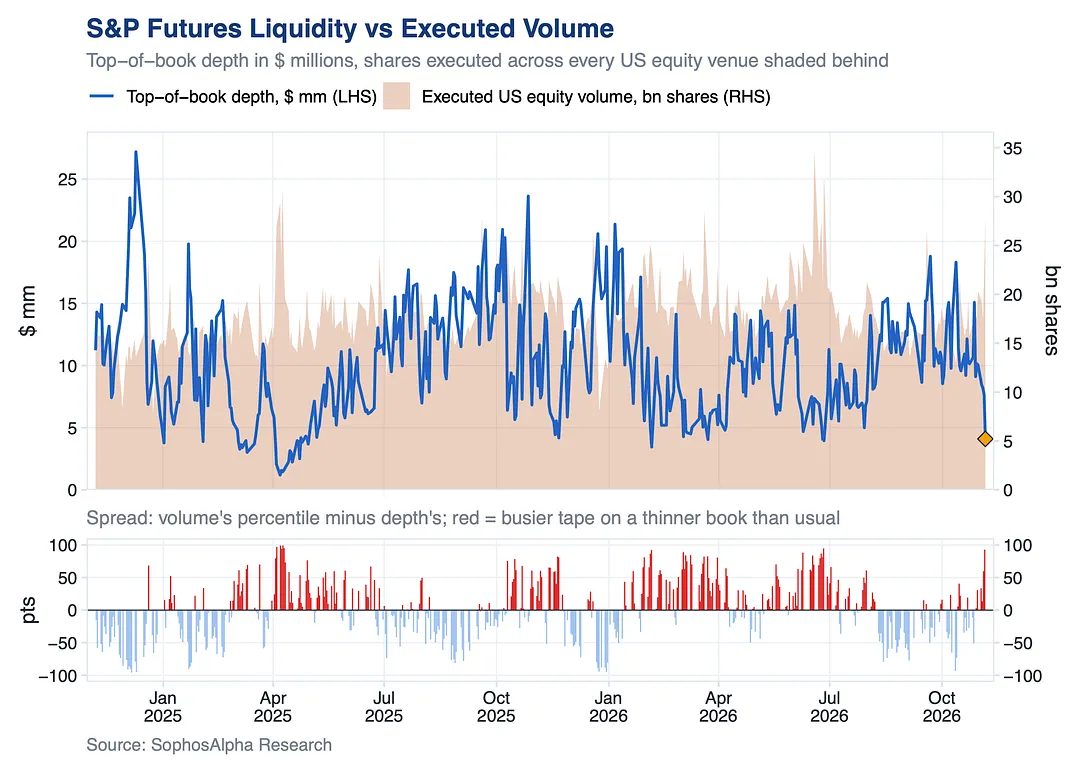
Last Thursday, resting size in S&P 500 futures fell to $4.1mm, thinner than on 94% of sessions in the past two years.
At the same time, 28bn shares traded across US equities, more than on 99% of days.
The gap between the two was the 7th widest in two years, and only the Liberation Day week and late June were wider. This is the most vulnerable a market can get.
Read how systematic funds added to the fuel:
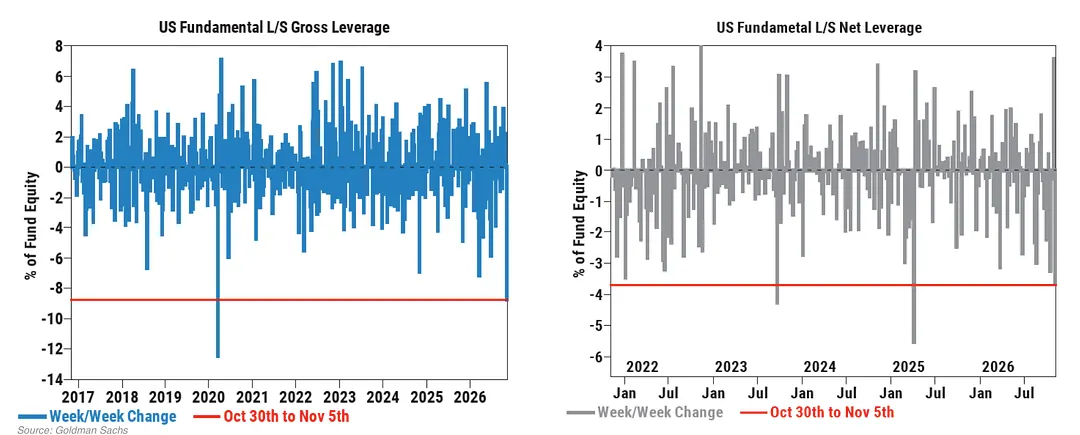
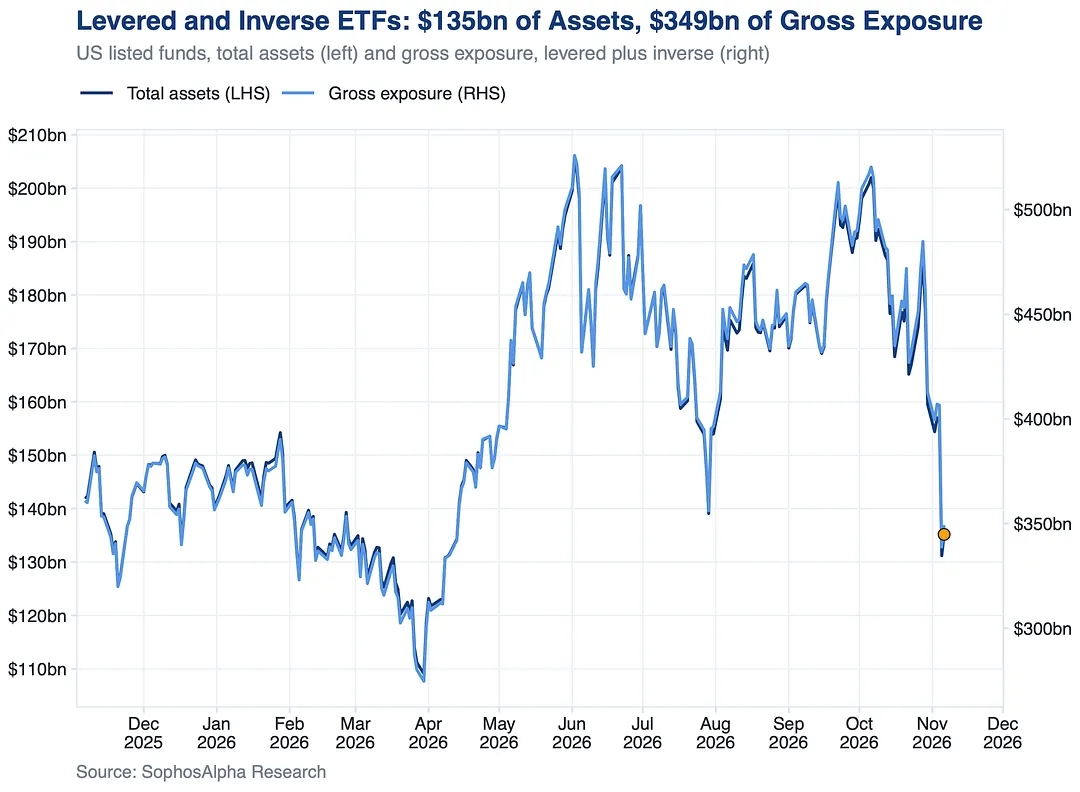
Gross exposure fell from $520bn on October 6 to $349bn, the lowest since mid April, and assets from $202bn to $135bn.
That is $171bn less exposure for these funds to rebalance into the next big move.
Then the market stops caring.
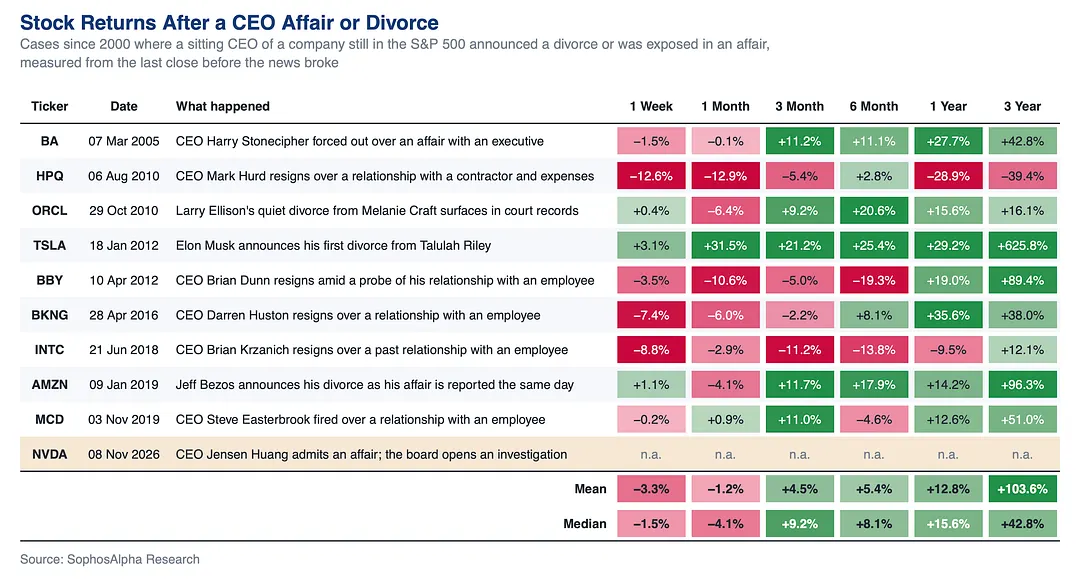
After $NVDA's news, we built a “CEO scandal list”: every major company whose sitting CEO announced a divorce or got caught in an affair since 2000.
A CEO affair hurts the stock for about a month. Then the market stops caring.
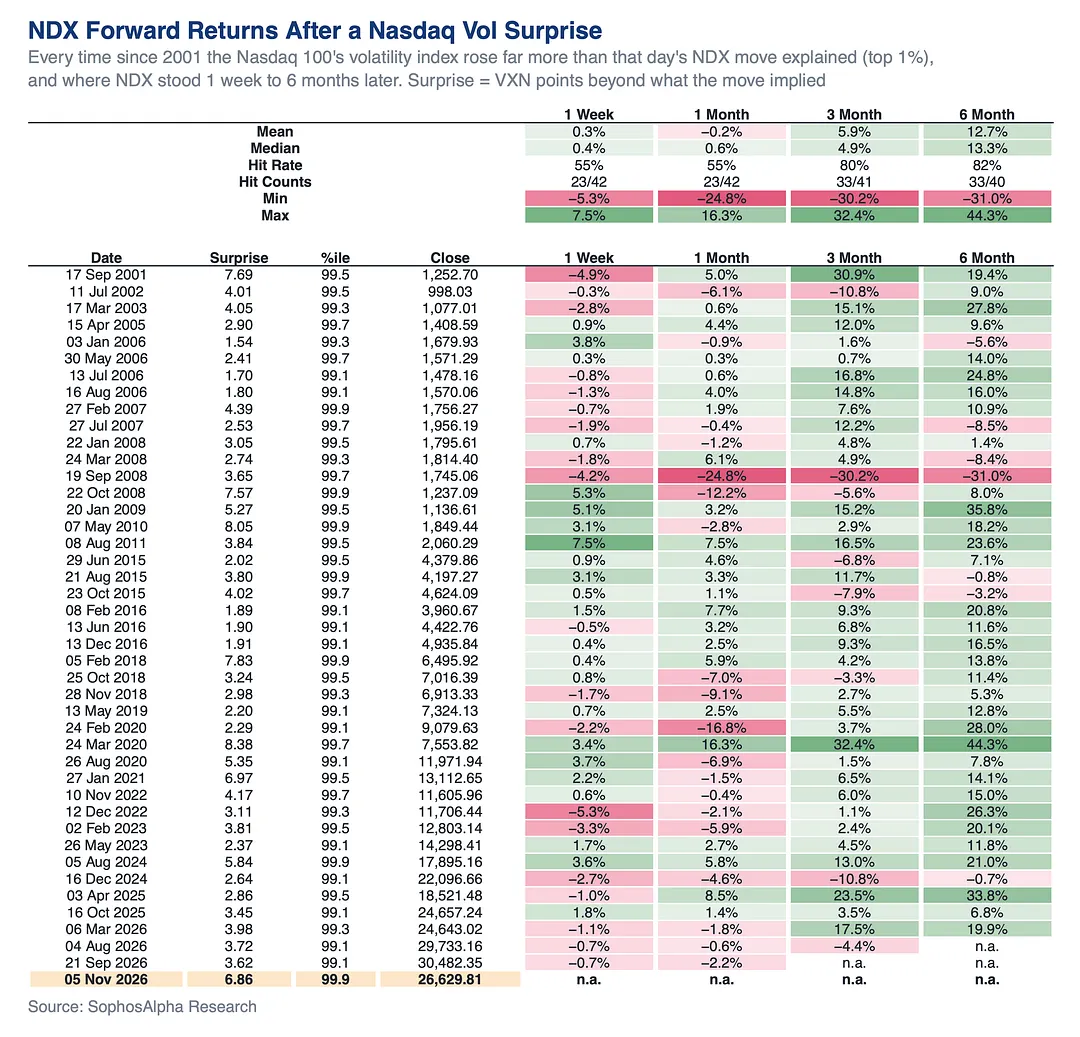
One month later NDX was up just 55% of the time. Three months later, 80% of the time and 5.9% on average. Six months later, 82% and 12.7%.
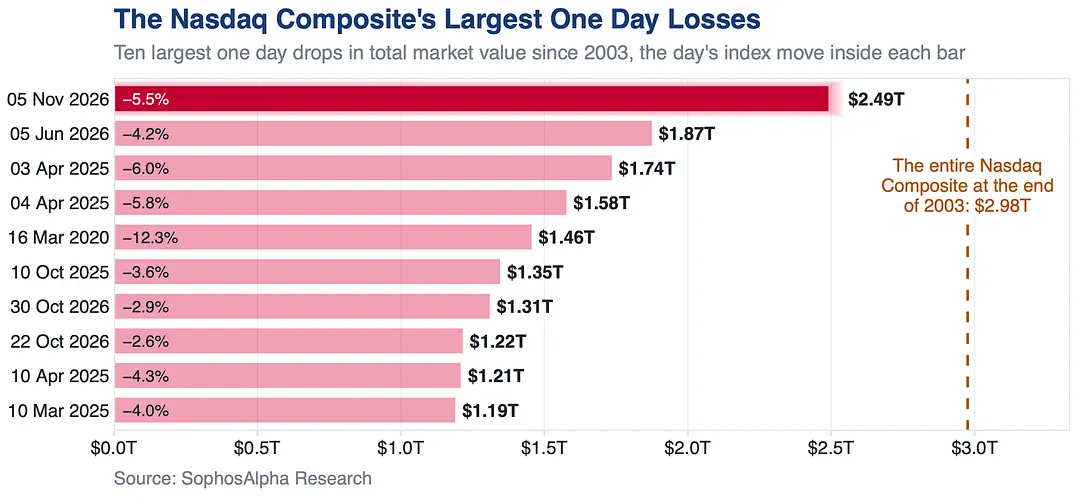
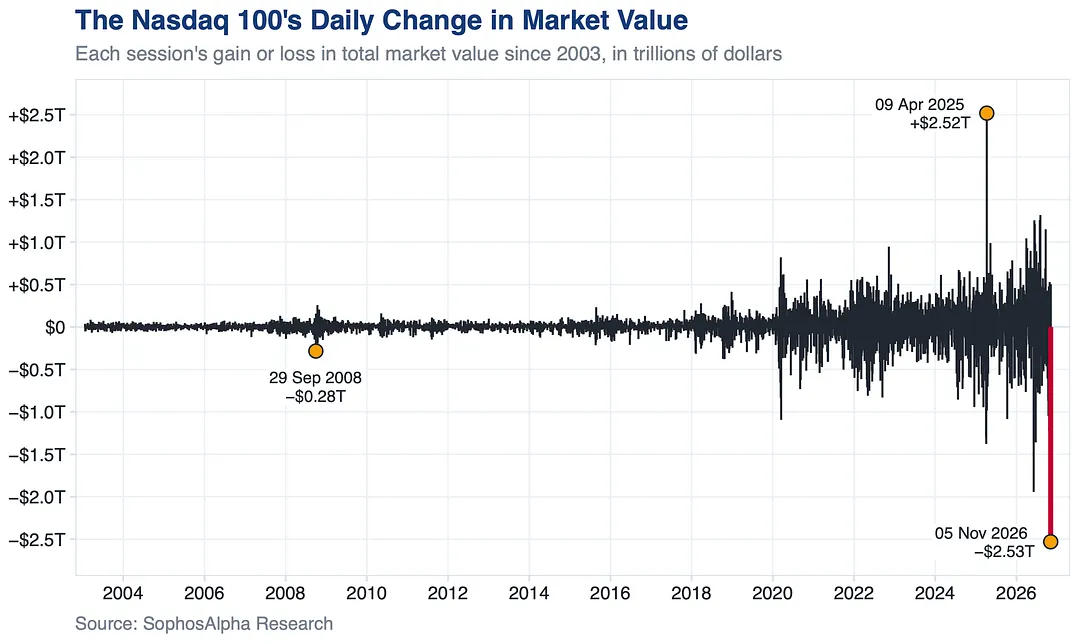
The entire Nasdaq was worth $2.98 trillion at the end of 2003.
It was the biggest one day loss on record, and 3 of the 10 biggest have now come in the last three weeks.
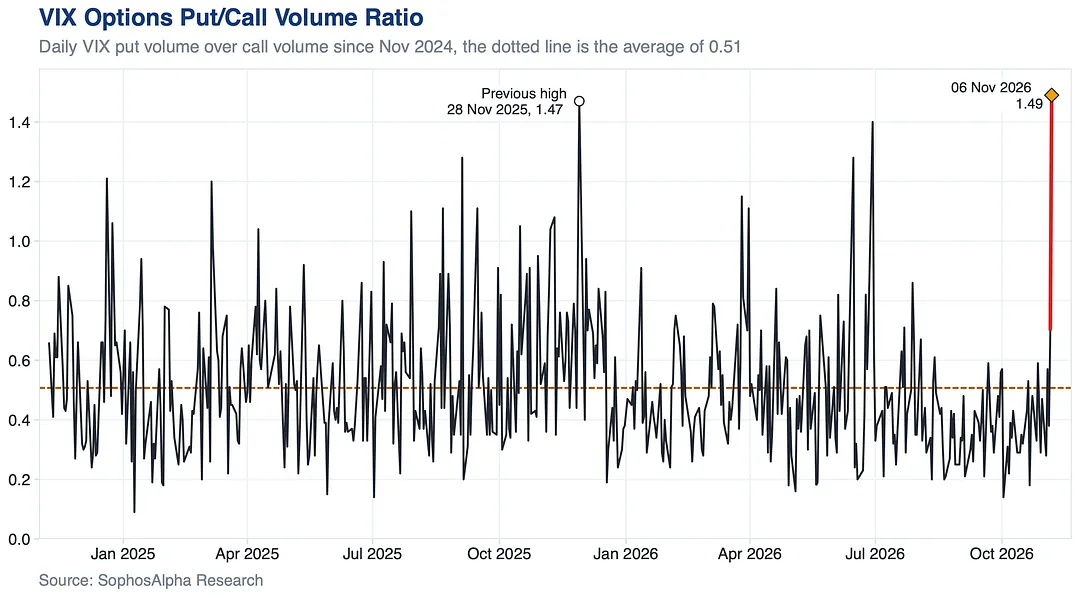
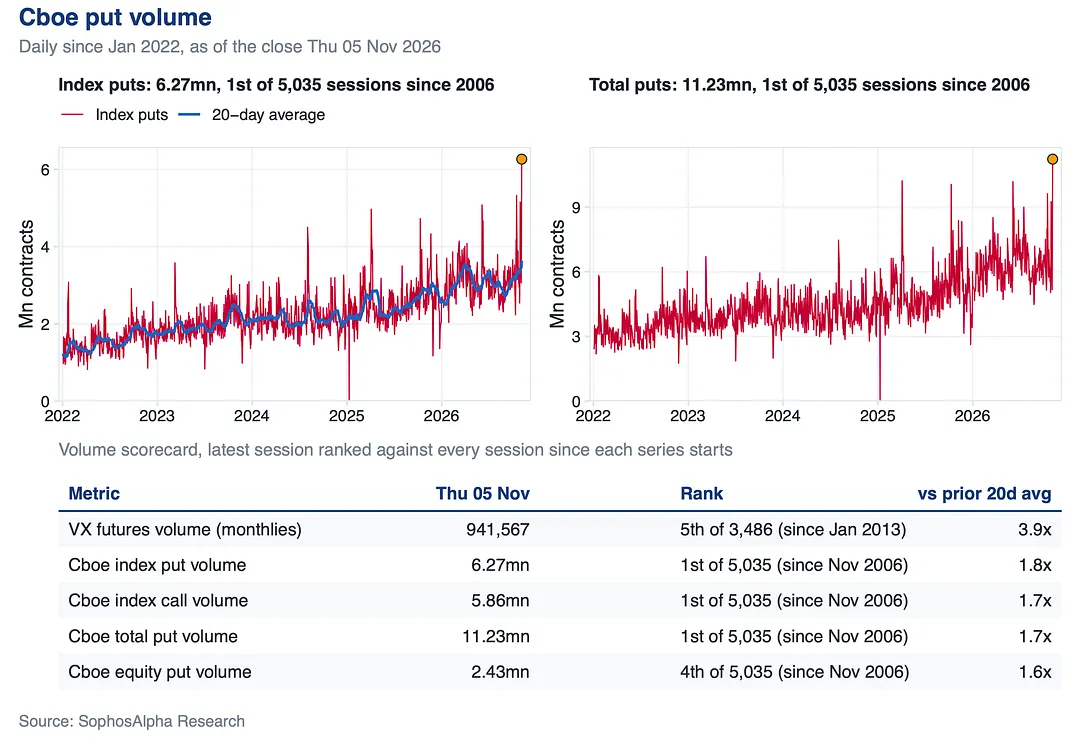
Last Friday investors didn't chase calls on the S&P 500 or the Nasdaq 100, they chased puts on the VIX. The VIX put/call ratio closed at 1.49, the highest in two years and nearly 3 times its 0.51 average.
Before 2025 it had one.
Its biggest move in all of 2008 was $283 billion. Last Thursday it dropped $2.53 trillion, the largest one day loss on record.
Read our latest piece on how the mechanisms for this move were already in place.
Everything traded as one.
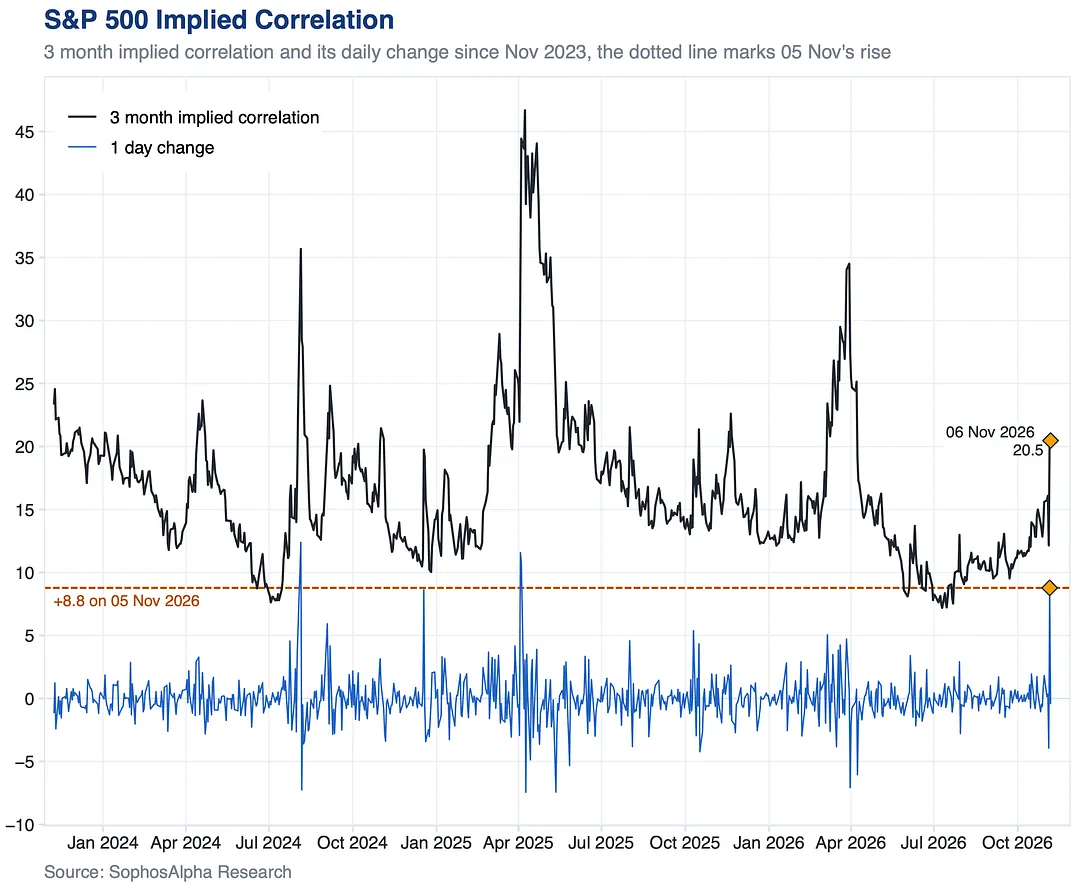
S&P 500 3 month implied correlation jumped 8.8 points in a day, the biggest jump since Liberation Day, to its highest level since April.
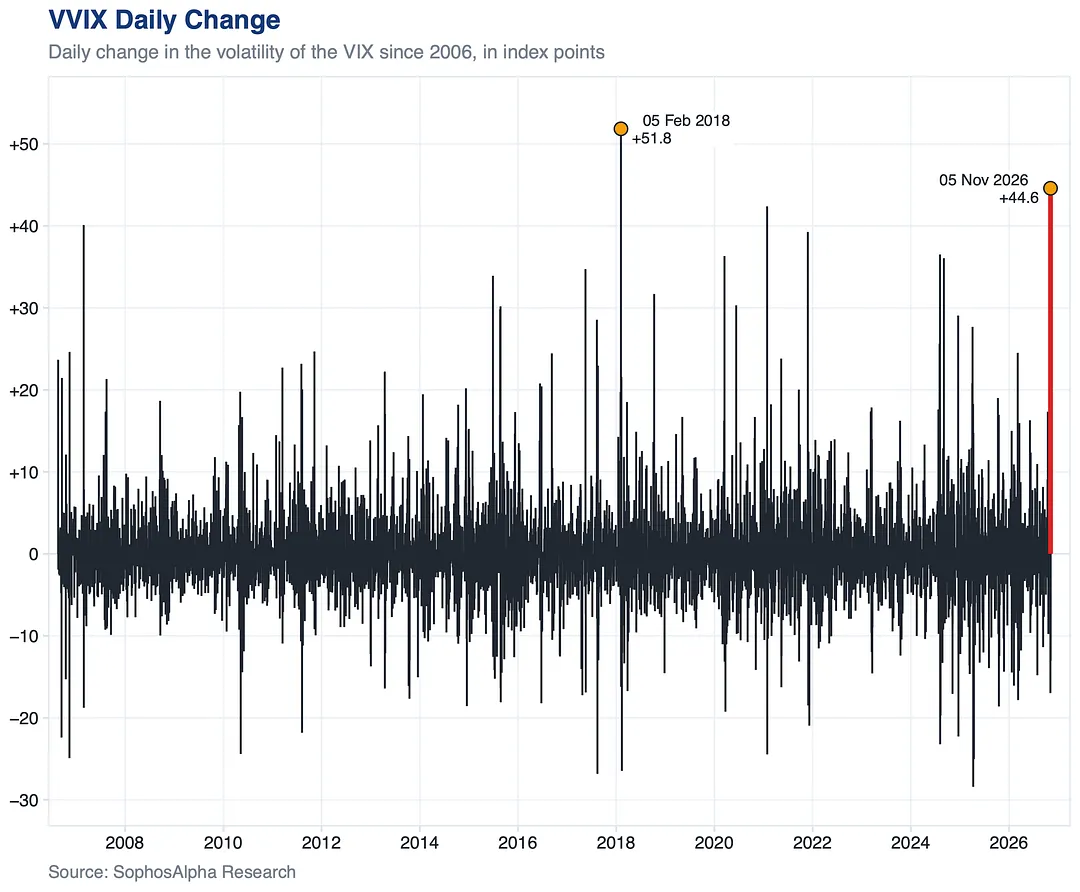
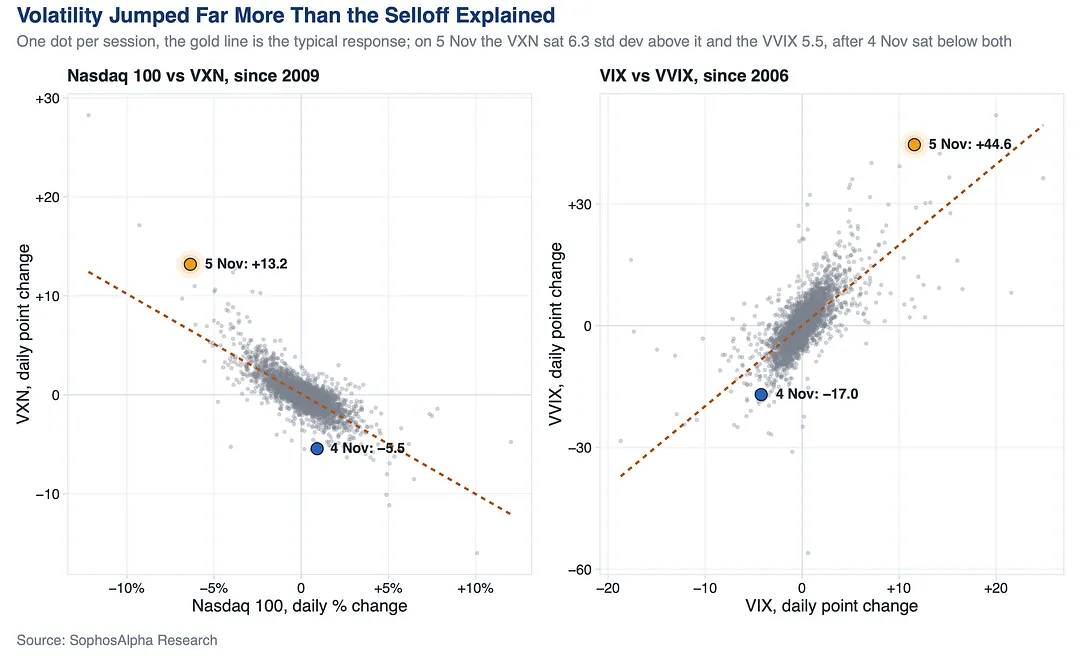
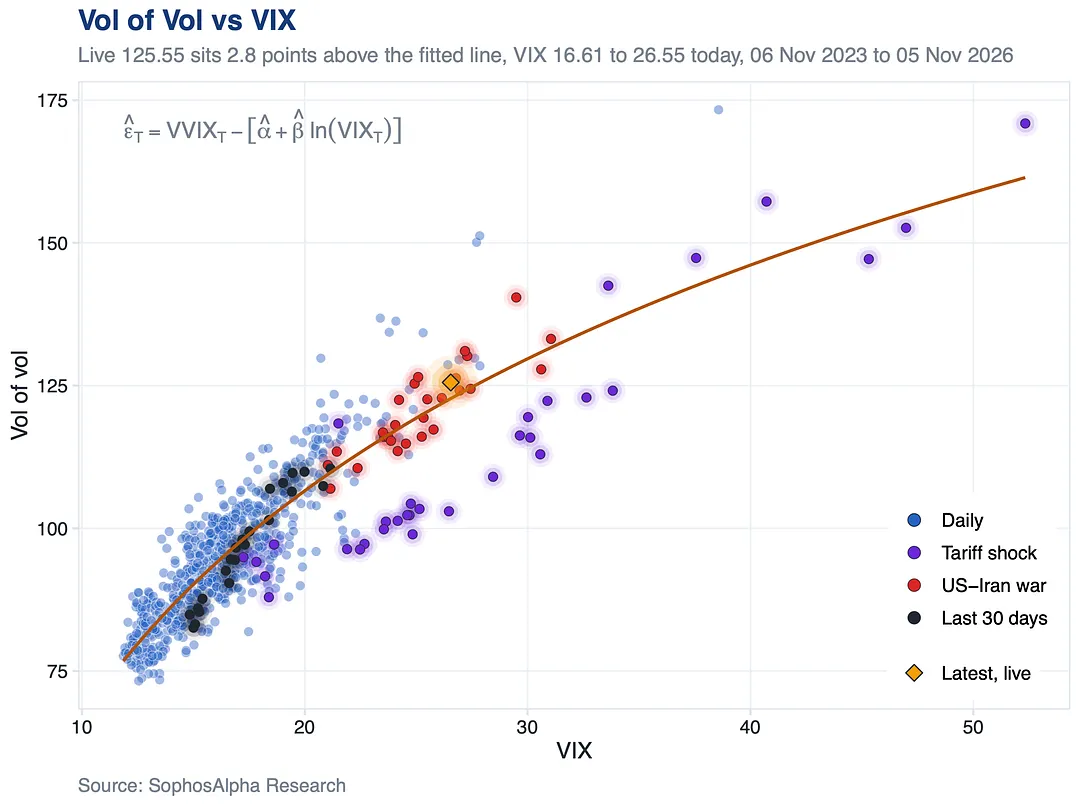
VVIX, the volatility of the VIX, jumped 44.6 points, its second biggest day since 2006.
How that day unfolded, in our latest Institutional Monitor.
one note
2 notes
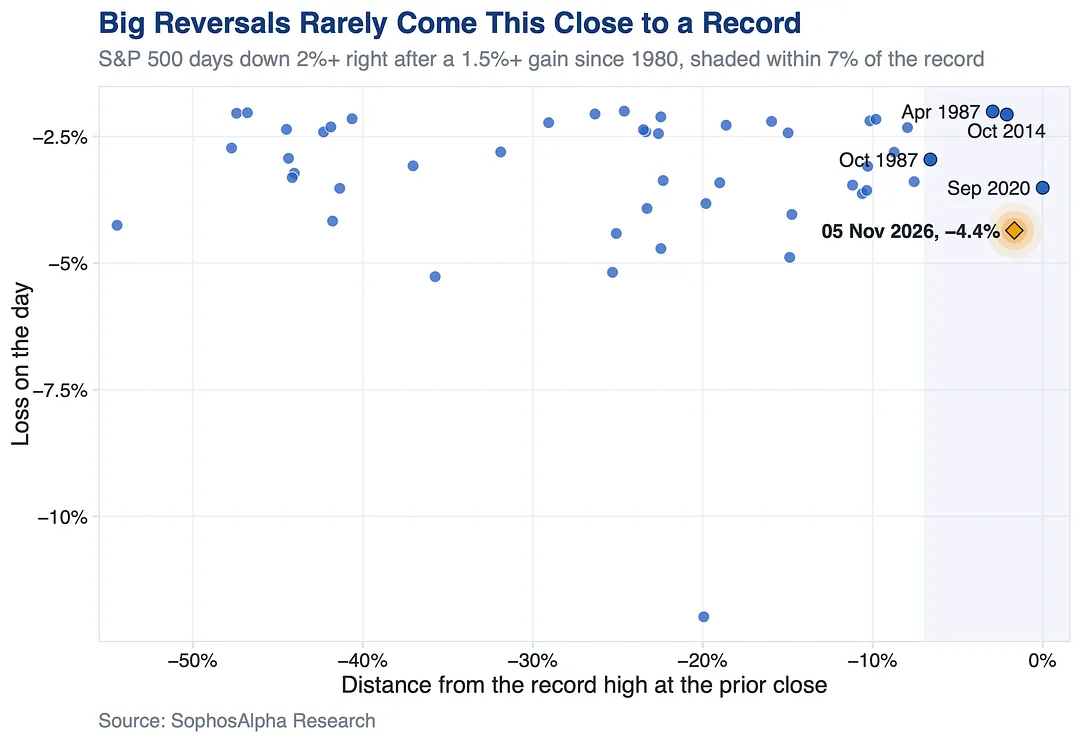
The S&P 500 did it on Thursday, a day after the midterm rally. Since 1980, only four came this close to the top: twice in 1987, then 2014 and 2020.
Thursday's drop was the deepest of them all.
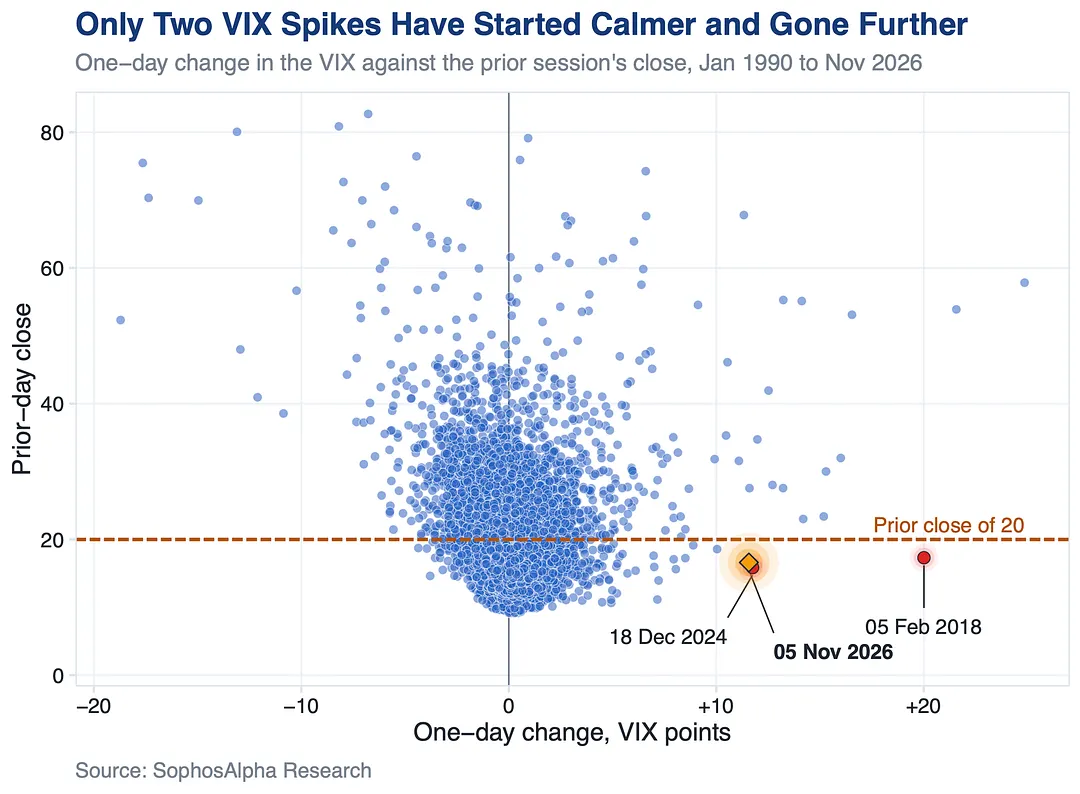
Only twice since 1990 has the VIX jumped further from under 20.
Going in, it sat below its one year average. Then the AI trade cracked after the midterms, and the Nasdaq 100 had its worst day since March 2020.
10 notes
The Nasdaq 100 had its worst day since March 2020, and the rush for protection topped even the April 2025 tariff panic. Index puts led the way.
Eight of the ten biggest put days came this year, three in the last three weeks.
A day after investors sold their hedges, the VVIX posted its second largest jump on record and Nasdaq vol rose far more than the selloff explains.
A market caught without protection.
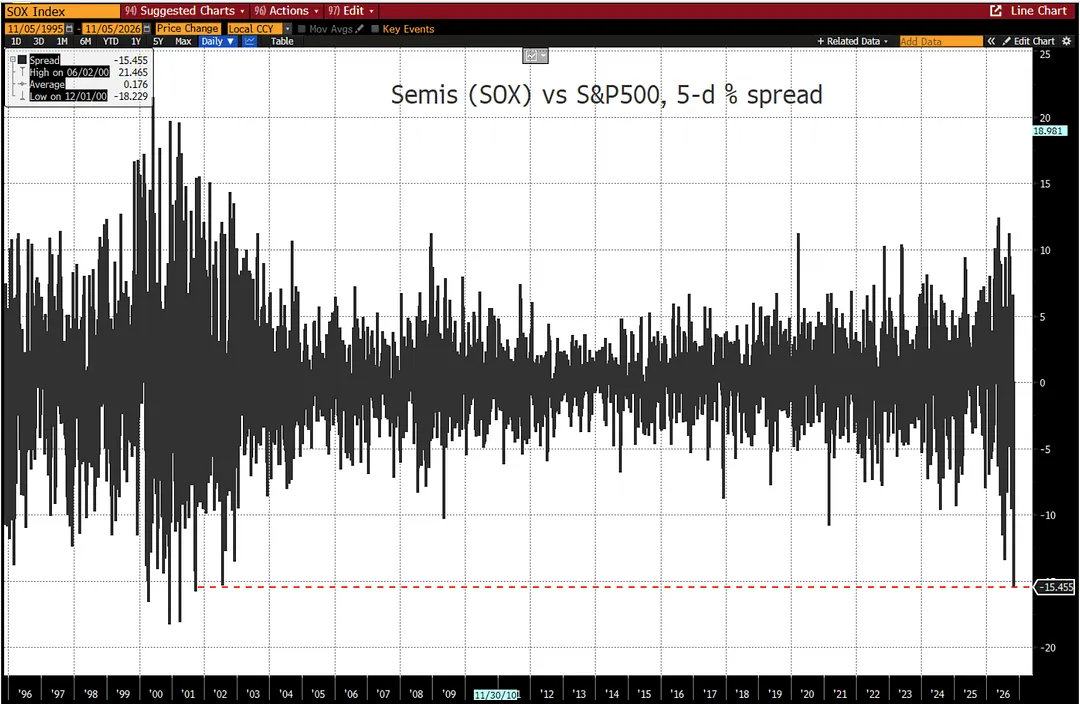
Chips fell 12% on 5 Nov alone, their worst day since March 2020. The group that led this market higher is now leading it lower, and one green day does not undo a gap this wide.
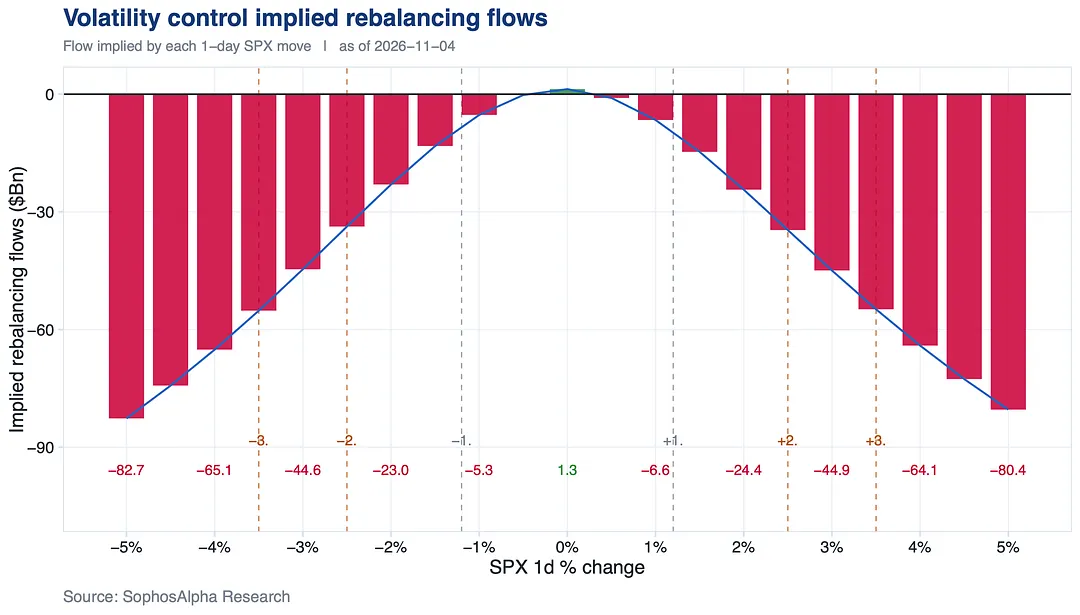
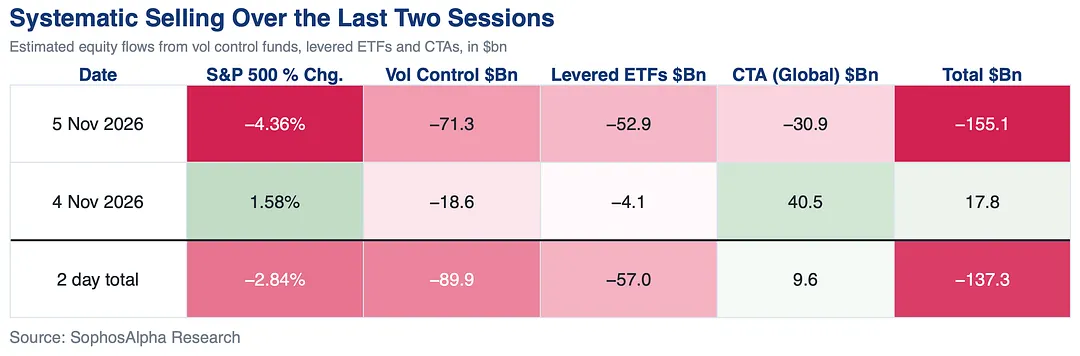
Vol control funds were already selling into the 4 Nov rally. CTAs were caught off guard: they bought the bounce, then had to unwind most of it the next day.
Levered ETFs piled on at the close.
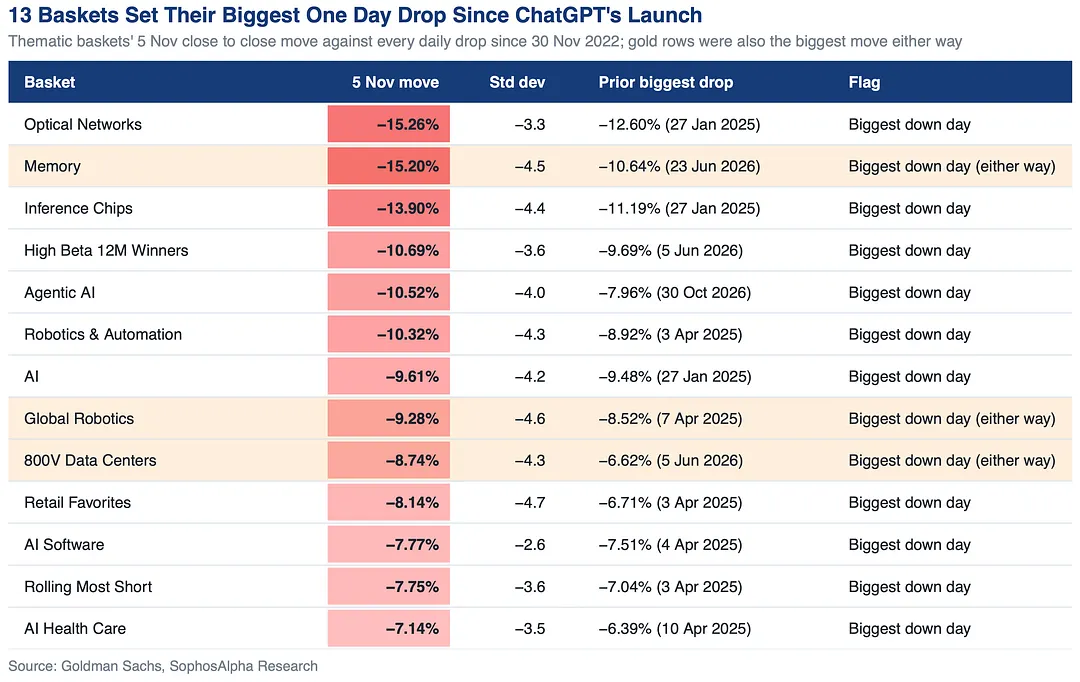
Memory and optical networks fell over 15%. The market is repricing the datacenter buildout, and the names that ran hardest on it are giving back the most.
A crowded trade is looking for the exit.
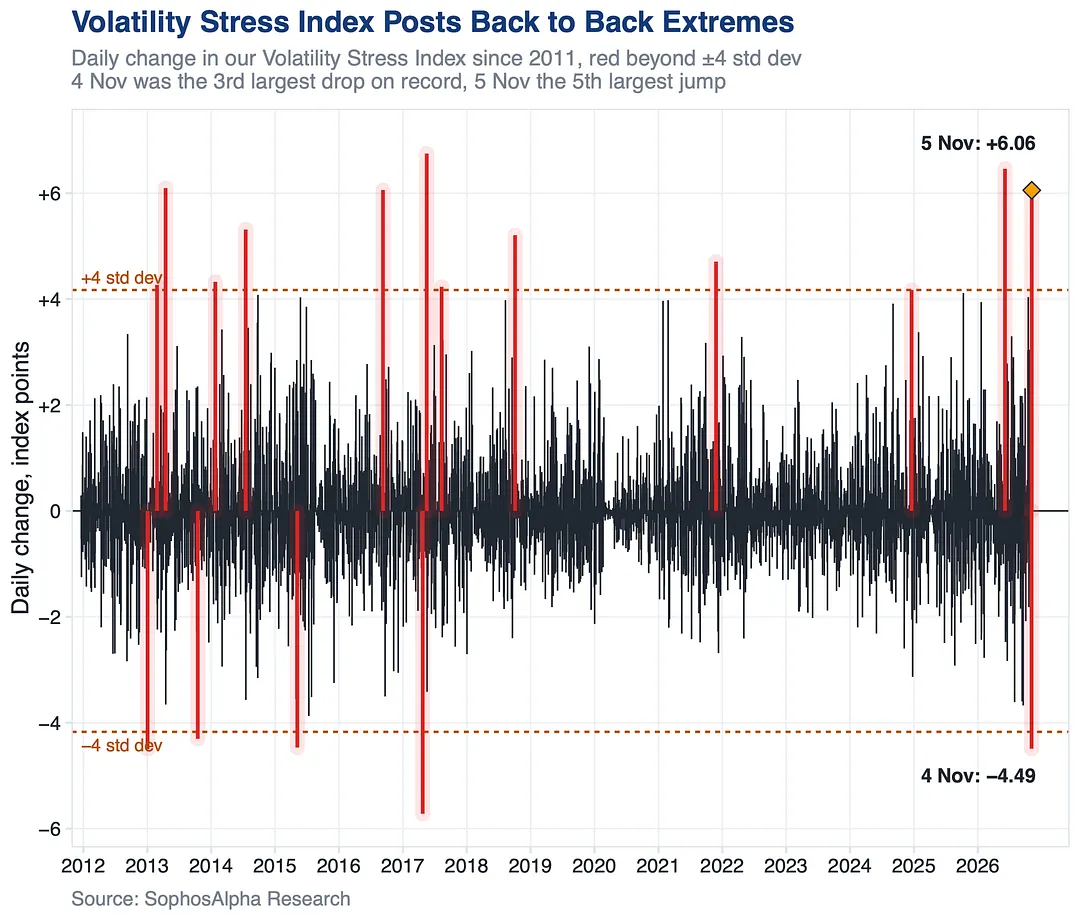
4 Nov: our Volatility Stress Index posted one of its largest one day drops on record as protection was cashed in.
5 Nov: one of its largest jumps, straight to near maximum stress.
Never two moves this big back to back since 2011. The market got caught off guard.
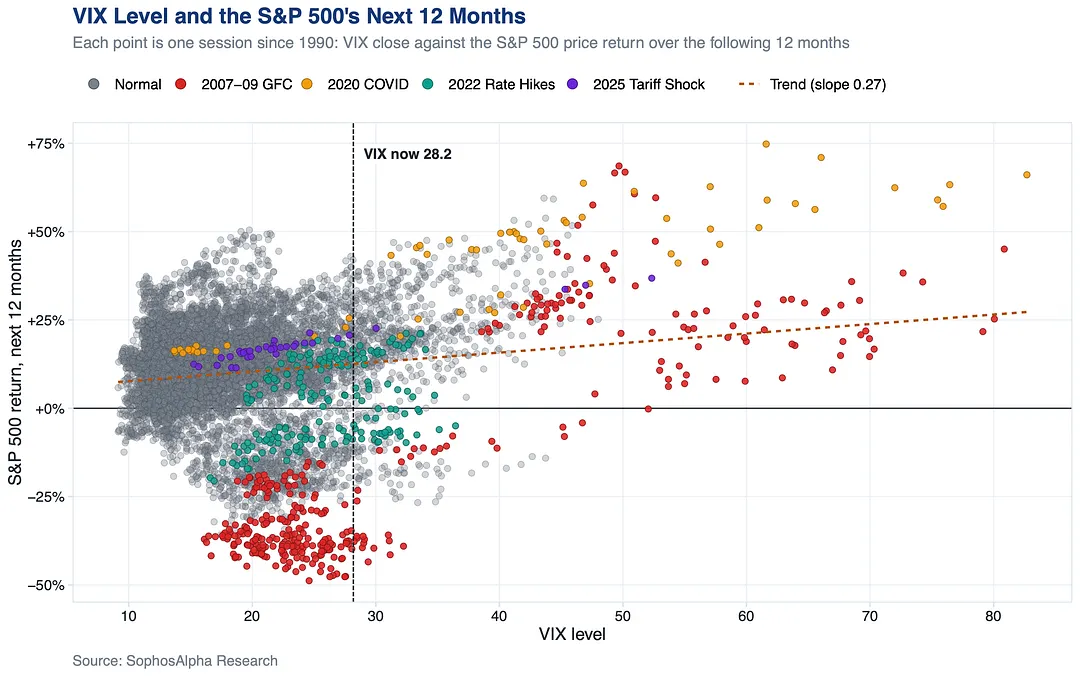
At a VIX of 28 or higher, the S&P 500 was up a year later 84% of the time since 1990, with nearly double the average gain.
It closed at 28 yesterday.
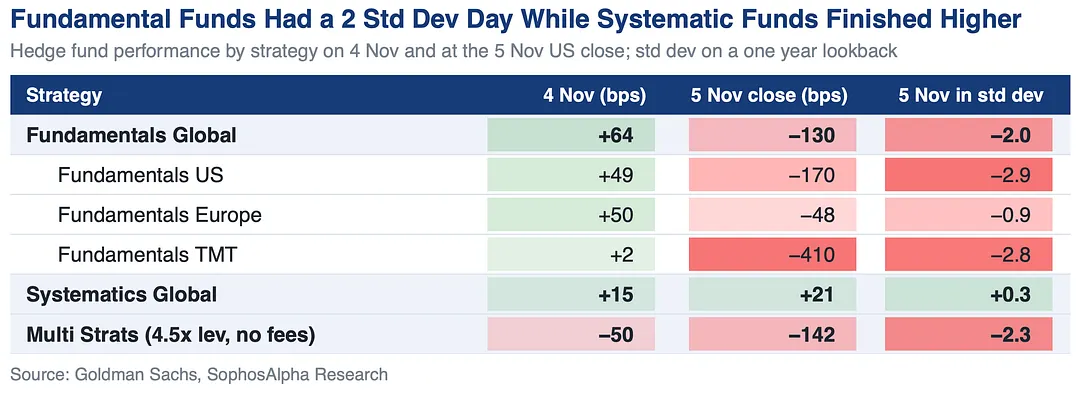
Stock picking hedge funds had a 2 std dev down day. Tech funds lost over 4% and are now roughly flat for 2026, after being up about 24% before the summer AI selloff.
Only the quant stock pickers finished higher.
Out of nearly 25,000 sessions since 1928, it ranks 123rd worst, inside the worst 0.5% of all trading days. Since 2000, only 33 days were worse.
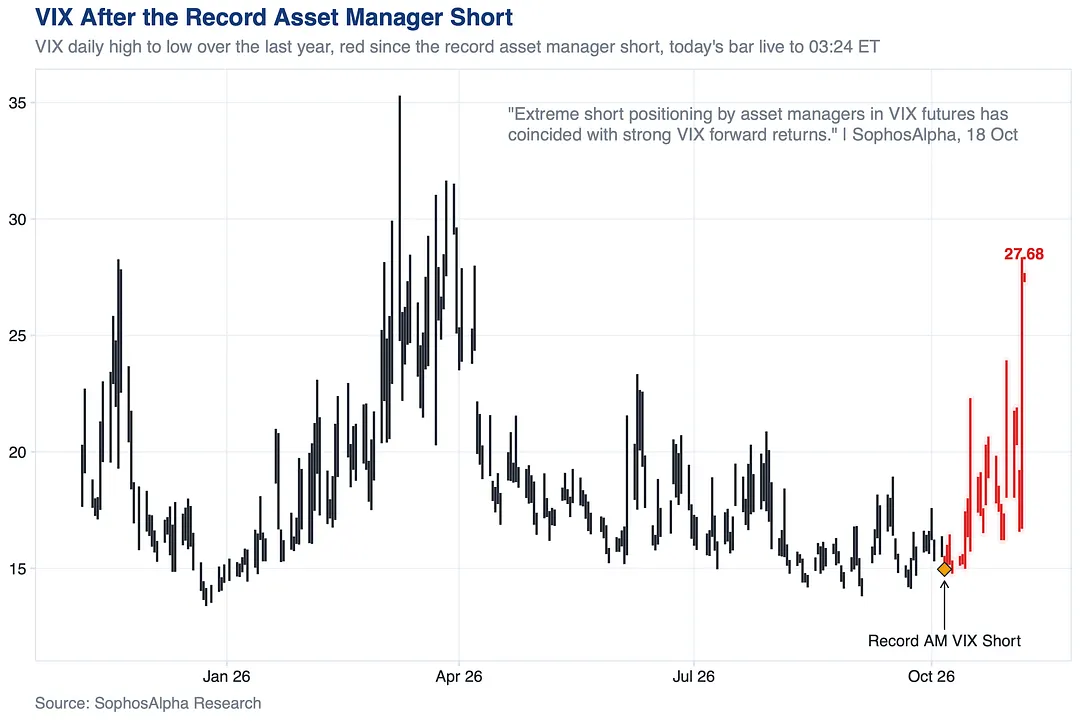
On 18 Oct we flagged that extreme short positioning by asset managers in VIX futures has coincided with strong VIX forward returns. https://substack.com/@sophosalpha/note/c-364243897
7 notes
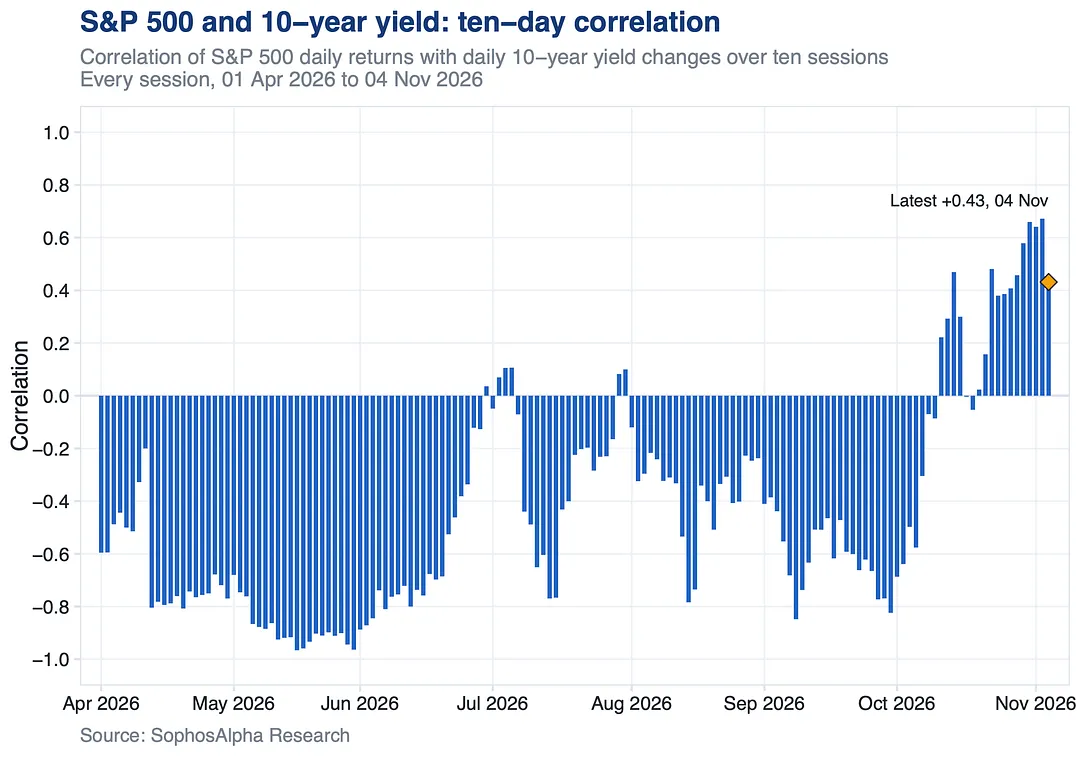
For most of 2026 this chart was one negative block: every rate scare a hit to equities. That flipped in late October. The worry moved from rates to growth.
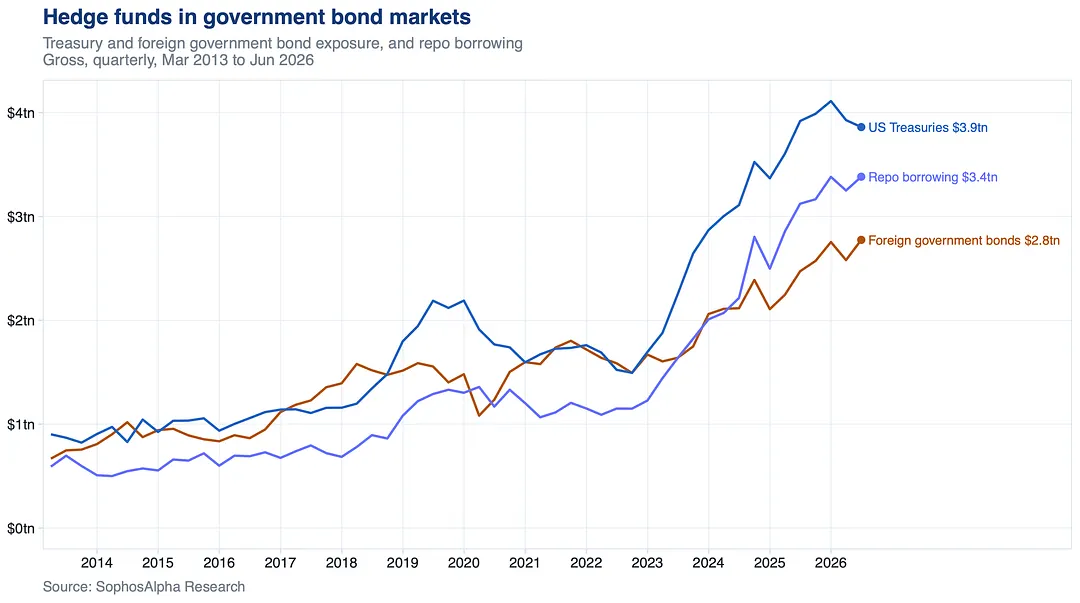
Maybe in the safest market in the world.
Hedge funds now hold $3.9tn of gross Treasury exposure, 2.3x the end of 2022. Their repo borrowing, the short term loans that fund those positions, has nearly tripled to $3.4tn.
That is leverage stacked on government debt. If yields jump and lenders pull back, funds are forced to sell into a falling market. The UK saw a version of this in the 2022 LDI crisis, and the US with LTCM in 1998.
Both times policymakers stepped in fast. The positions are far bigger now.
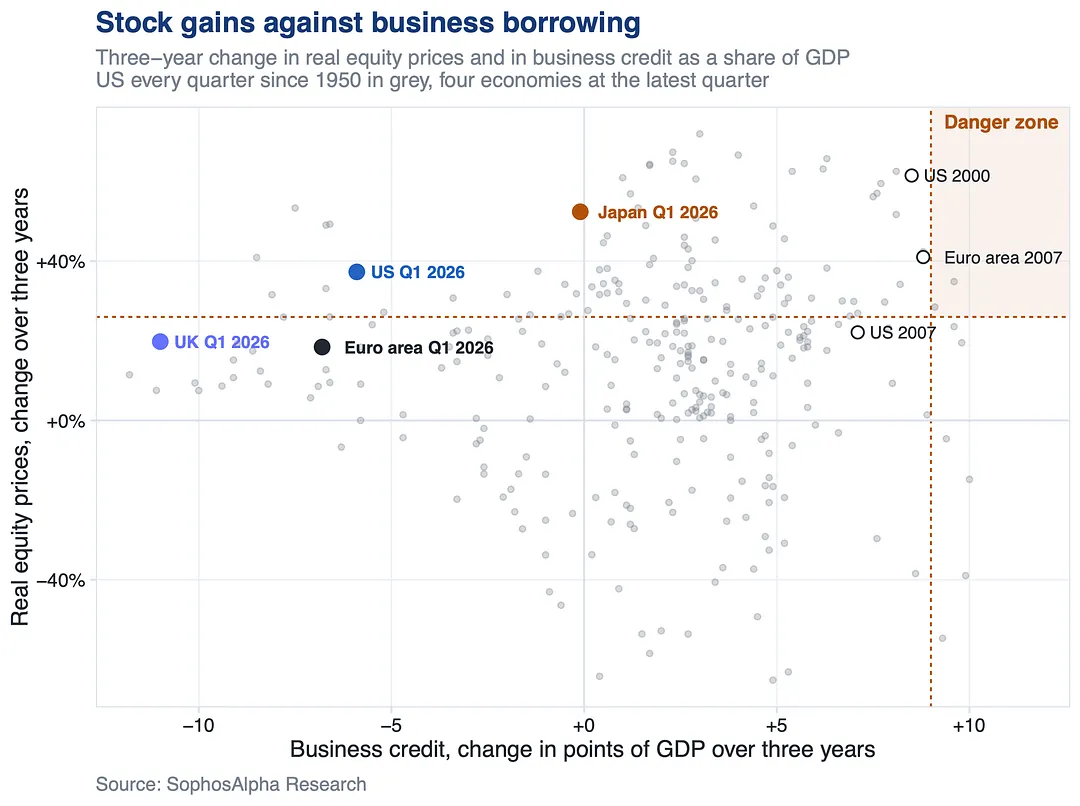
Crises tend to need two things at once: a big run up in asset prices and a surge in borrowing. Stocks have the first. Real equity gains in the US and Japan over the last three years sit above the danger line.
Borrowing is the missing piece. US business credit has fallen almost 6 points of GDP over the same three years. Going into 2000 and 2007 it was rising 7 to 9 points.
So an AI correction is the clearer risk, not a crisis. That changes if companies start borrowing to keep building.
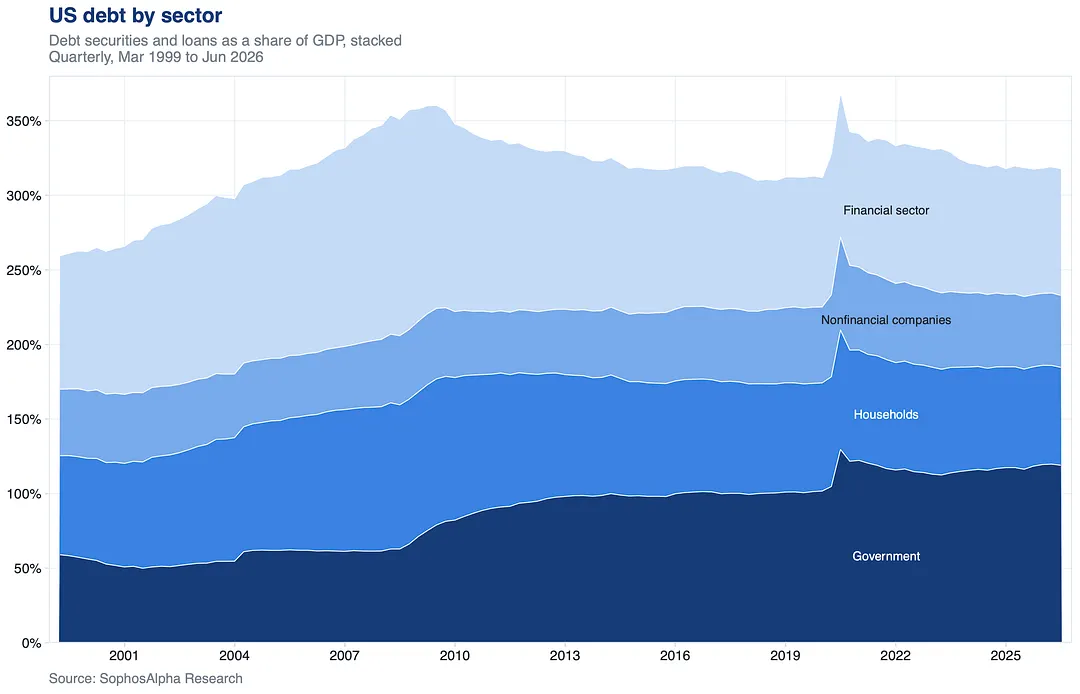
To the government. In 2007, US government debt was 61% of GDP, third of the four big borrowers. Today it is 119%, the largest. Households went from 97% to 66%, and the financial sector from 143% to 85%.
Total debt is lower as a share of GDP than in 2007. What changed is who owes it.
That is a big reason there has been no crisis since: a government doesn't face a run the way a bank does. But every rescue loaded the sovereign balance sheet, and with interest costs rising, there is less room for the next one.
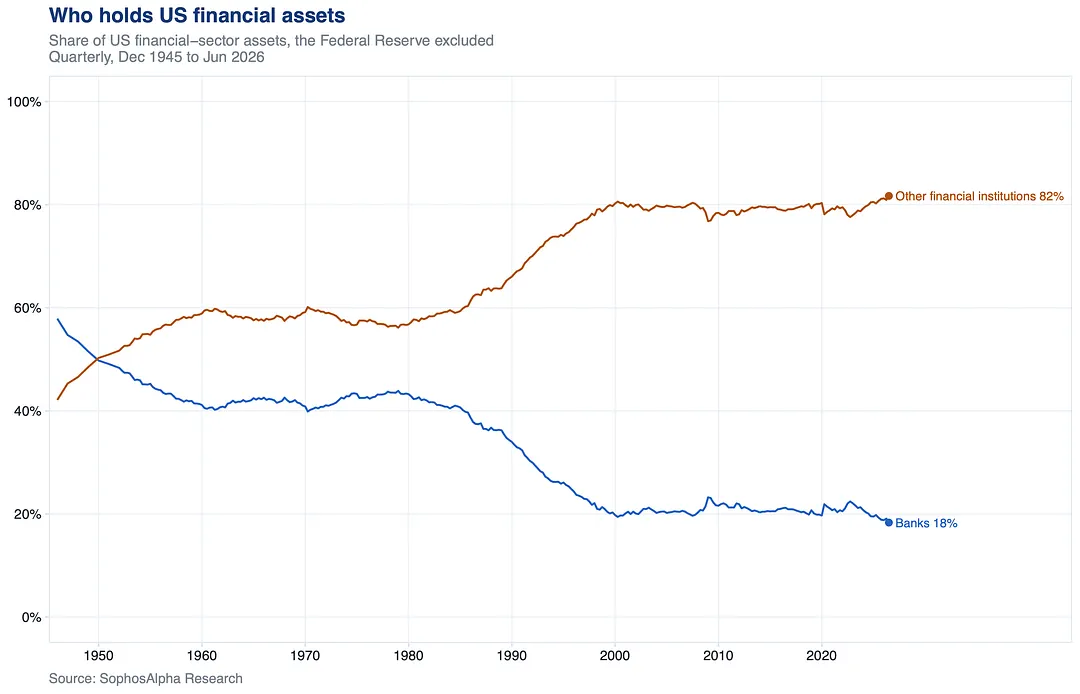
Part of the answer: banks hold less of the system than ever. Their share of US financial assets is 18%, the lowest since records start in 1945, down from 58% after the war and 23% at the end of 2008.
That matters because banks run on deposits that can leave overnight. A pension fund or a closed end private credit fund can't be emptied on demand, so the classic bank run has less to work with.
The risk didn't disappear. It moved outside the banks, where it is harder to see.
VIX is up 69% today. Only two days since 1990 saw a bigger jump: 5 February 2018 and 18 December 2024. March 2020 never got there.
Vol of vol rose 38 points, beaten only 4 times since 2006.
Levered ETFs sell $48bn into today's close on the moves so far.
Vol control sold $22bn yesterday and a 2% lower close forces $23bn more.