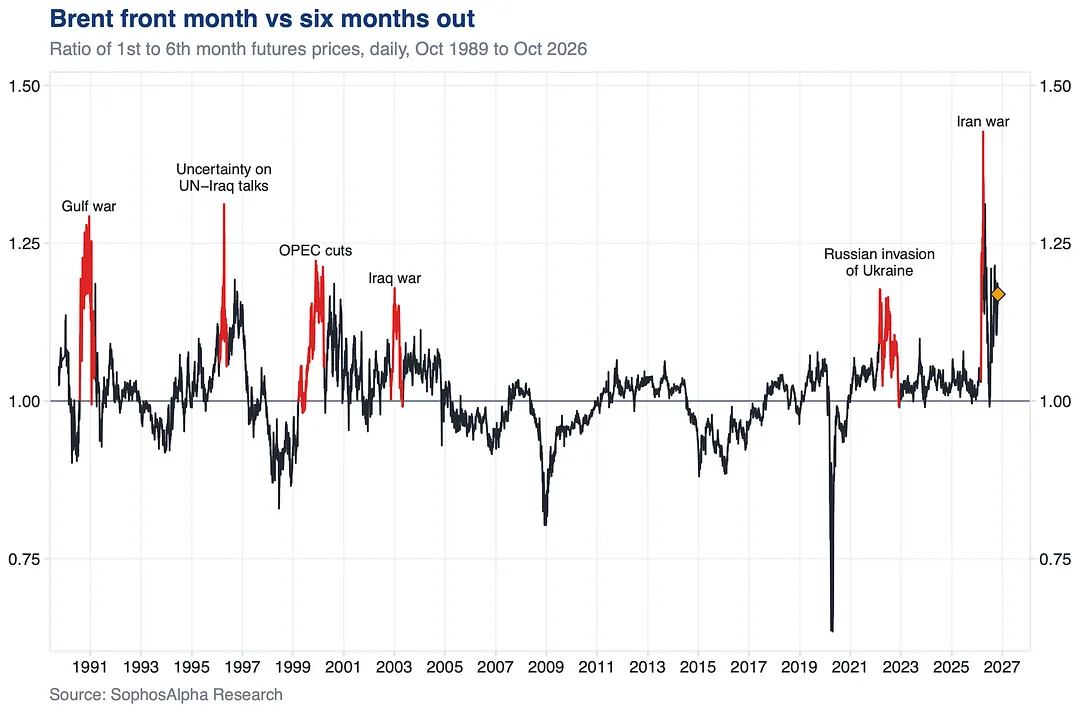
The Iran ceasefire wiped out oil's war premium.
Once the truce broke, it came right back.
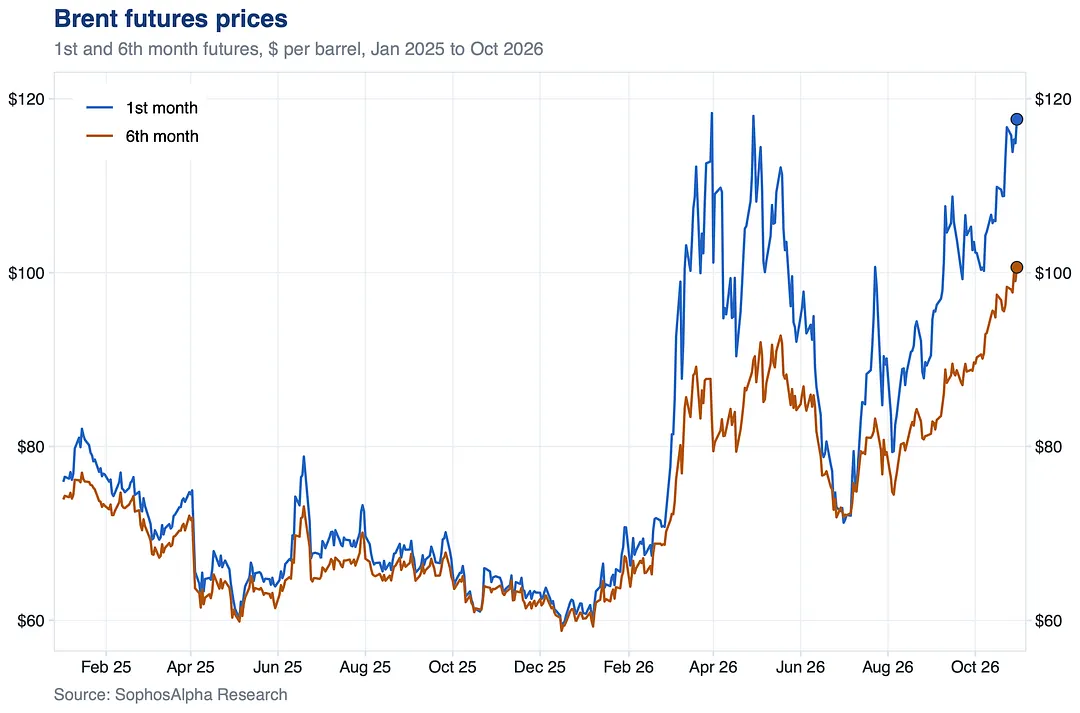
Oil for delivery now costs far more than oil six months out. Traders are paying up for barrels today and betting the squeeze eases later.
The desk notes of Sophos Alpha, an independent quantitative research desk. Daily market notes across many topics, including CTAs, risk parity, vol control and other systematic funds, hedge fund activity and investor sentiment, dealer gamma and liquidity, volatility and tail risk, in equities, rates, currencies and commodities.
157 notes
5 notes
Once the truce broke, it came right back.
Oil for delivery now costs far more than oil six months out. Traders are paying up for barrels today and betting the squeeze eases later.
Every red stretch on the chart is one. Today sits level with the Iraq war and Russia's invasion of Ukraine.
The market is pricing in a major supply disruption, and systematic hedge funds have been positioned to capture it for months.
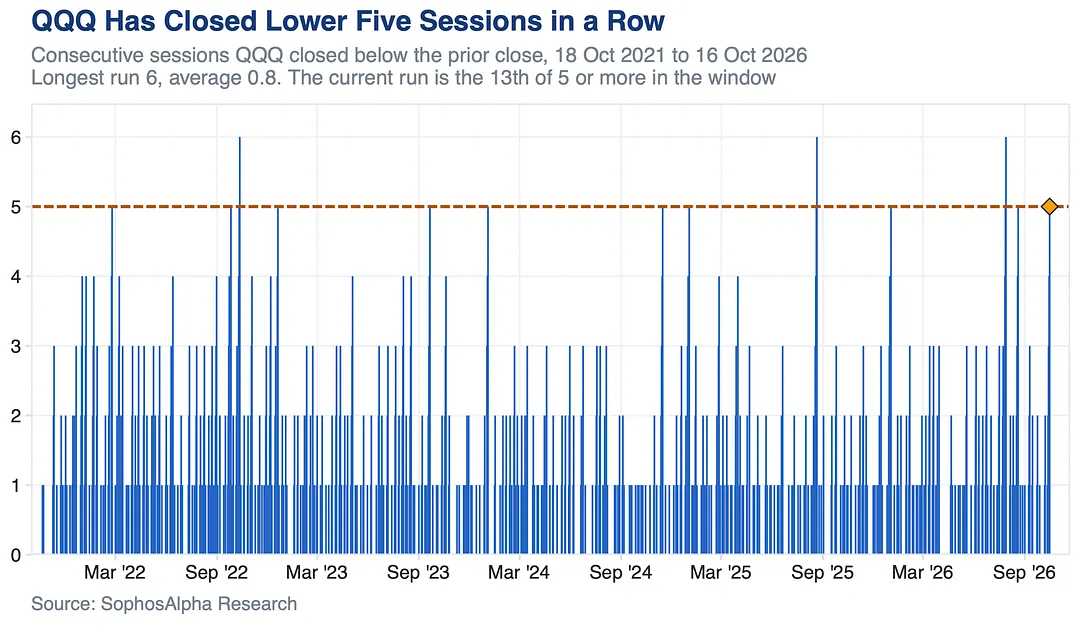
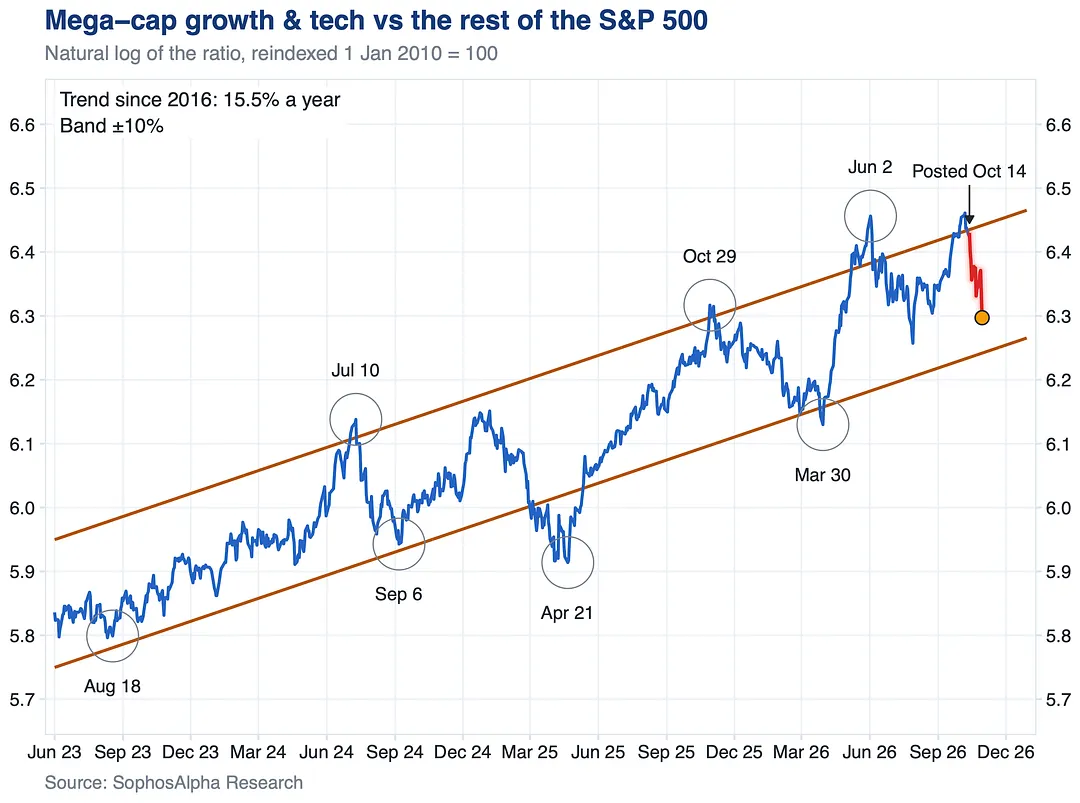
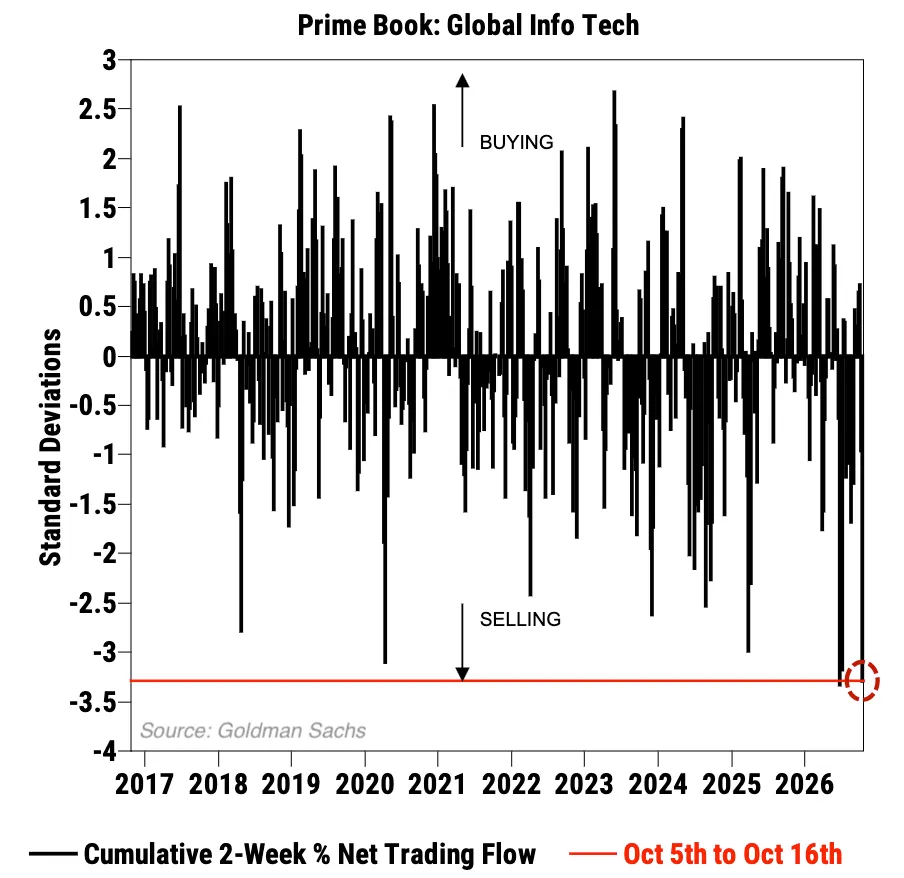
Tech has underperformed sharply since then.
Investor positioning in Tech has also dropped sharply and is now in line with a significant deceleration in earnings growth.
The risk-reward begins to shift in favor of Tech again.
The front month is back near its Iran war high, and the later contracts keep climbing. The market is pricing expensive oil well into next year.
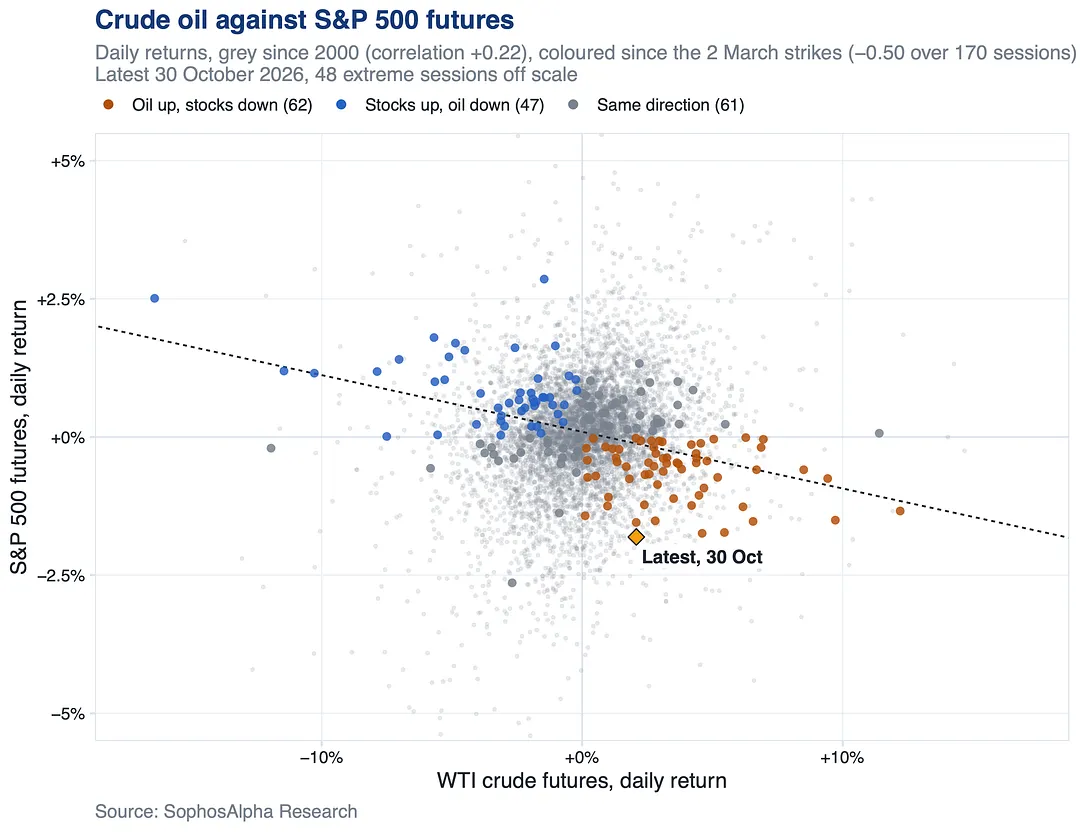
Since the strikes, a 2% crude jump has pointed to stocks down about 0.1%. Futures fell 1.8% with crude up 2%, one of the two biggest misses of the war.
4 notes
That is what makes it a hedge.
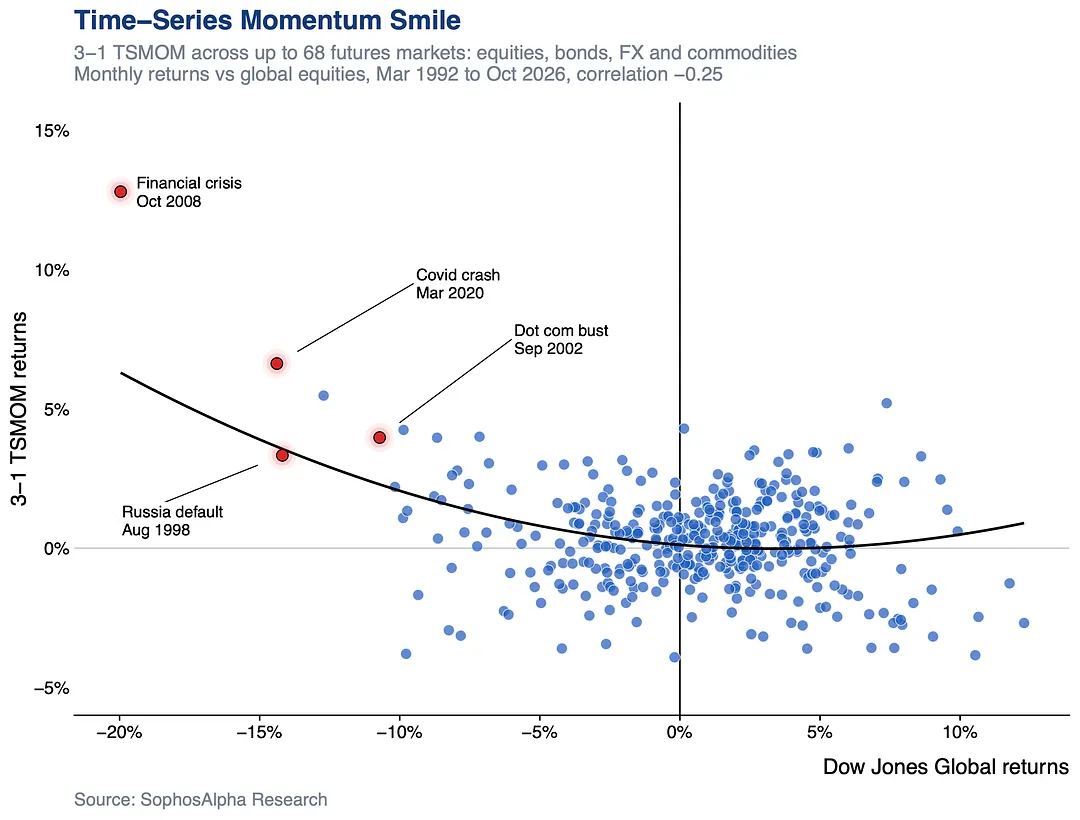
A basic trend strategy was up in 9 of the 10 worst months for global equities since 1992.
Financial crisis: equities down 20%, trend up 12.8%
Covid crash: equities down 14.4%, trend up 6.6%
Russia default: equities down 14.2%, trend up 3.3%
Dot com bust: equities down 10.7%, trend up 4.0%
Those are single months. Over the whole dot com bear market, equities fell 47% and trend made 21%. The rest of the time it barely tracks stocks.
CTAs run far more refined versions of the same idea. That is why they belong next to an equity book.
The formula behind this strategy will be published in our next research piece.
Long energy.
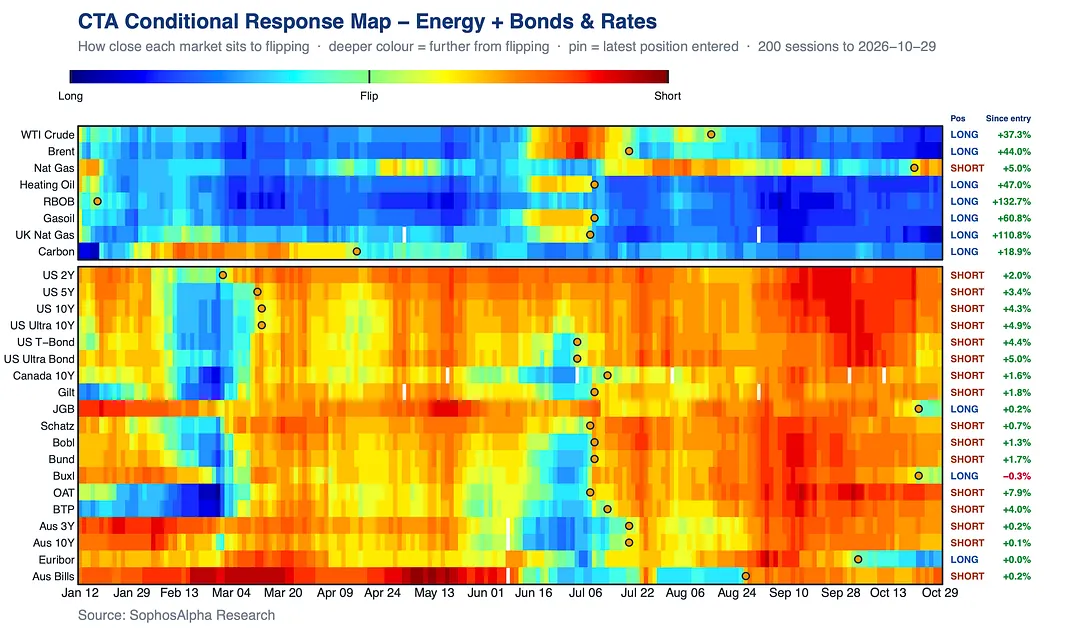
That is the systematic hedge fund trade of 2026, and we’ve been flagging it since August, before it paid.
It is why CTAs are the best-performing hedge fund strategy of the year: up 16.6% through Q3, more than double the average fund and ahead of the S&P 500.
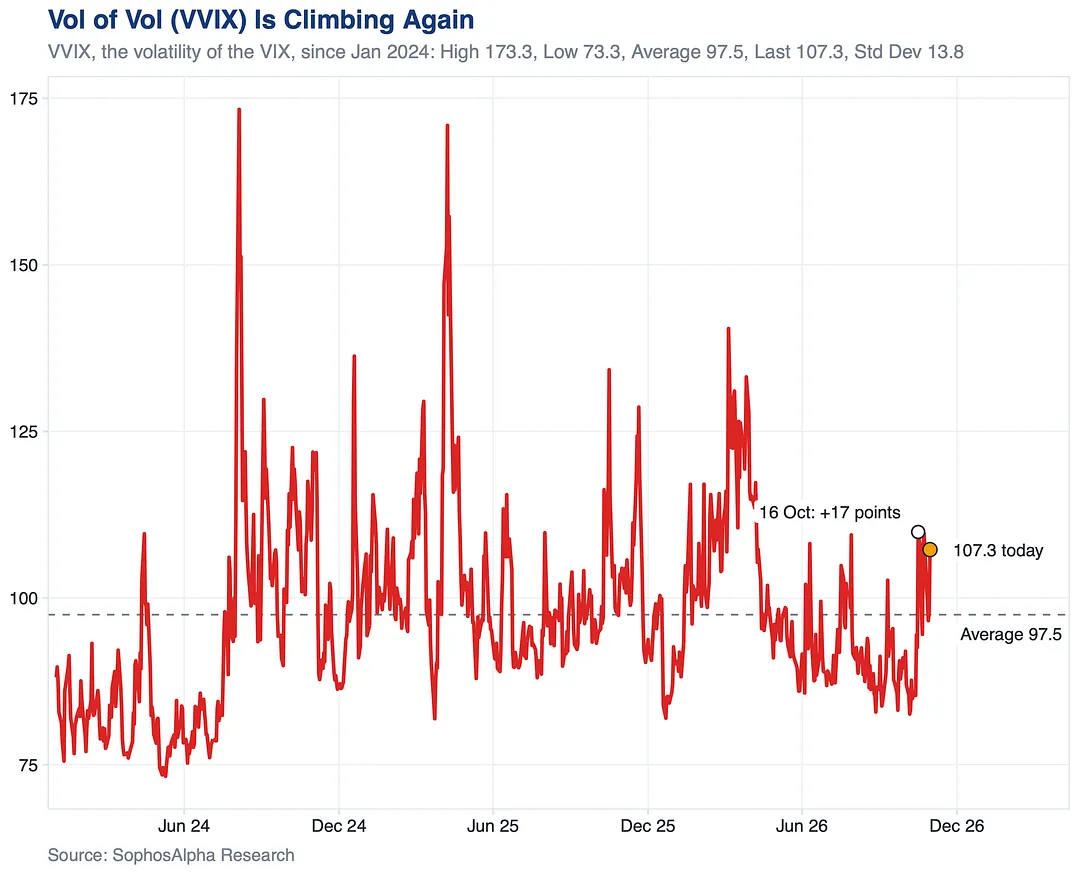
VIX is rising with it, but it is still below the bottom of its own war range. The gap is still there.
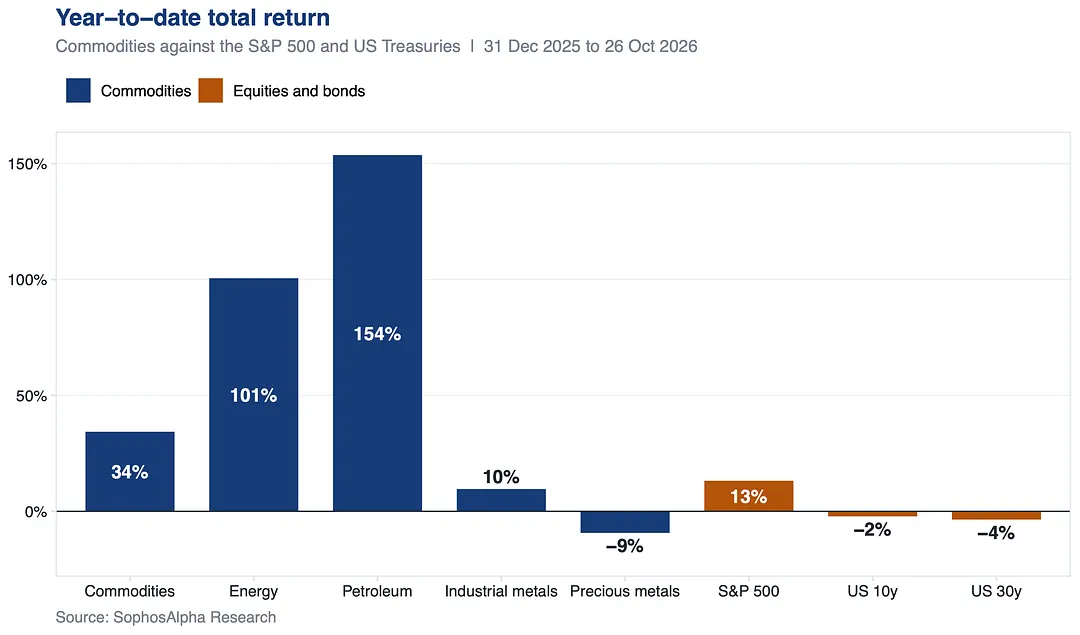
This year Treasuries lost money while energy doubled. In our latest research a few days ago, we made the case for "Hedging Portfolios With Commodities".
In that piece, we shared positioning intelligence on systematic trend following strategies, and the distinction matters as our models have been long oil since July and short gold and metals since September.
10 notes
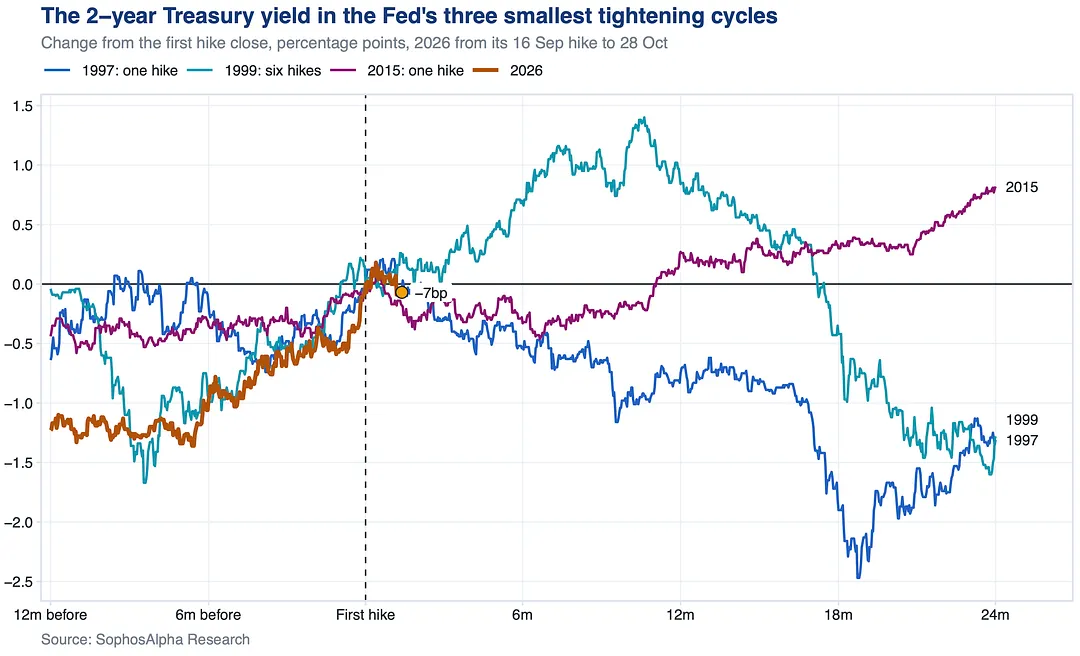
The 2 year yield ran up into September’s hike, stalled, and slipped again after yesterday’s hold.
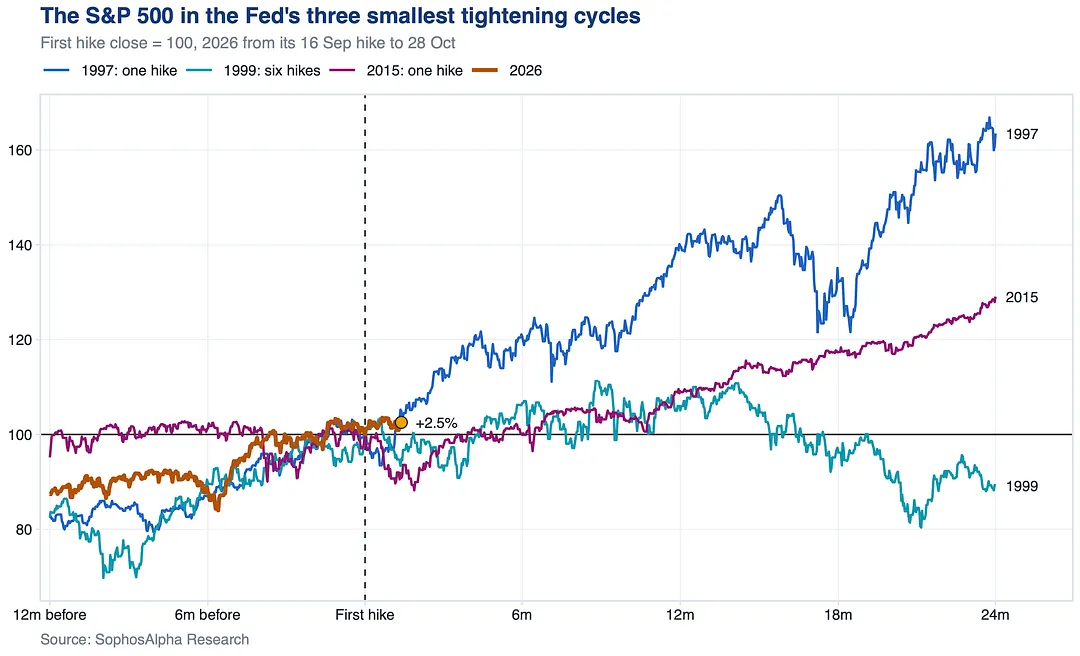
That is how 1997 and 2015 looked, when the Fed hiked once and stopped. In 1999 the 2 year kept climbing for a year.
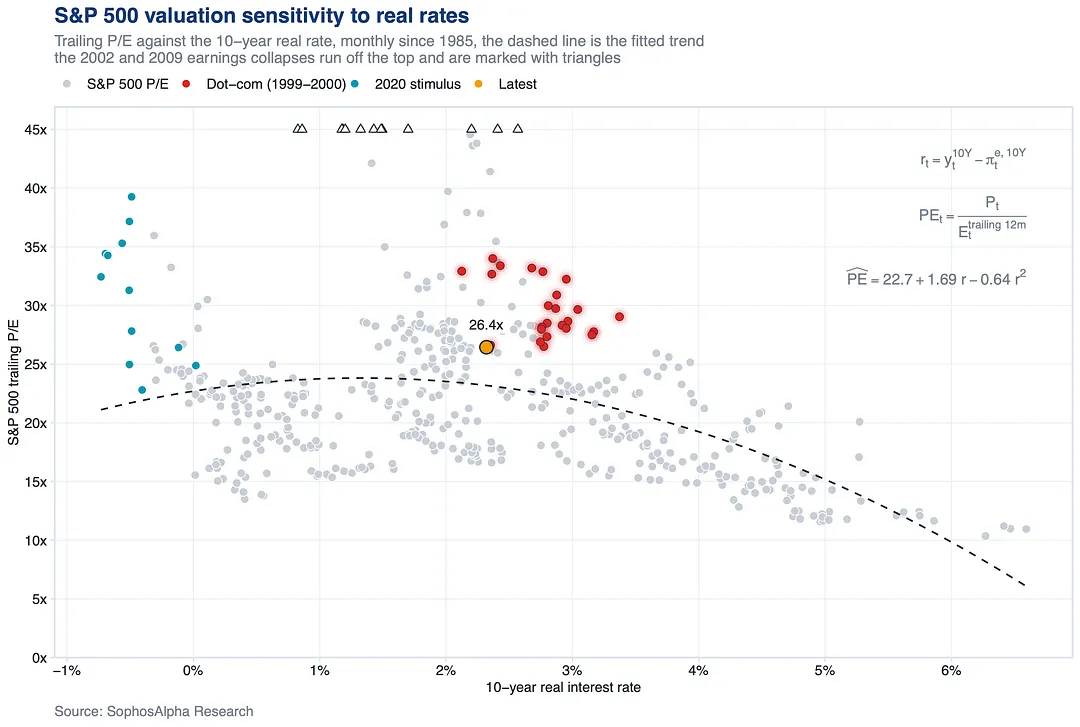
Valuations have peaked with real rates around 1% to 1.5%, eased slowly and fallen fast past 4%. At 2.3% today, we are just past the peak. Strong earnings growth is the likely reason for the premium.
1997: inflation cooled, one hike, stocks ripped.
2015: growth scare, one hike, a long grind higher.
1999: hikes into a boom, stocks stalled, then the bubble burst.
Yesterday’s hold keeps all three in play.
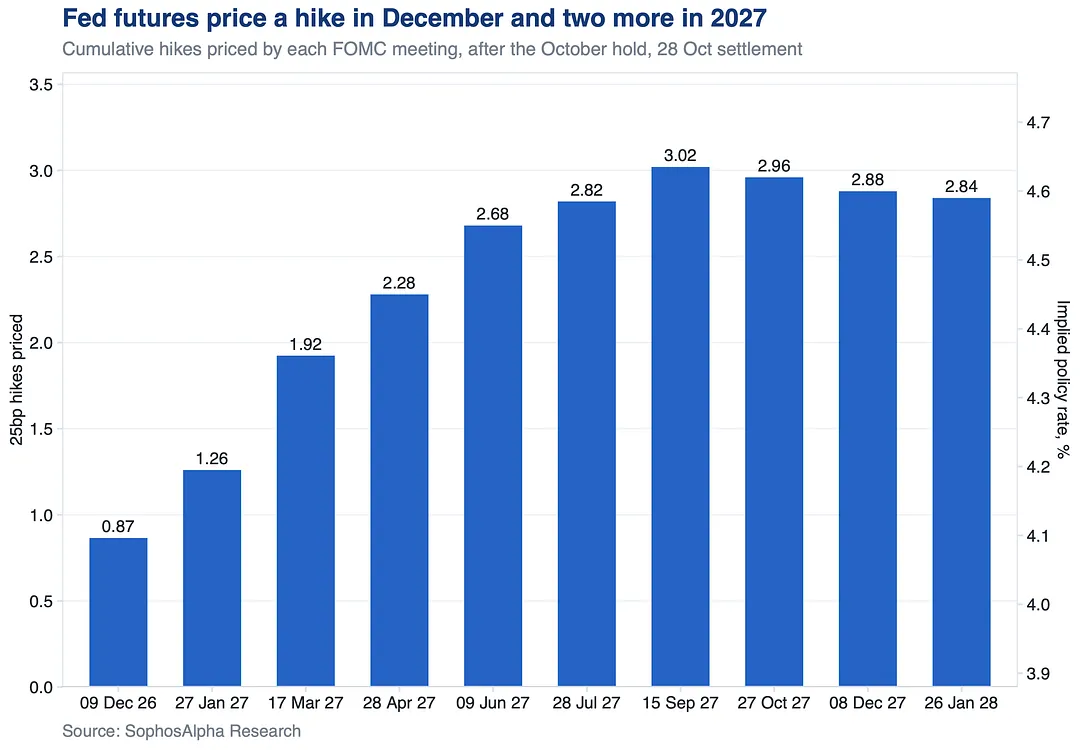
The futures market says it is a pause, not the end.
A December hike is close to fully priced, a second by March and a third by July, which would take the funds rate to 4.50% to 4.75%. Only after that does the curve go flat.
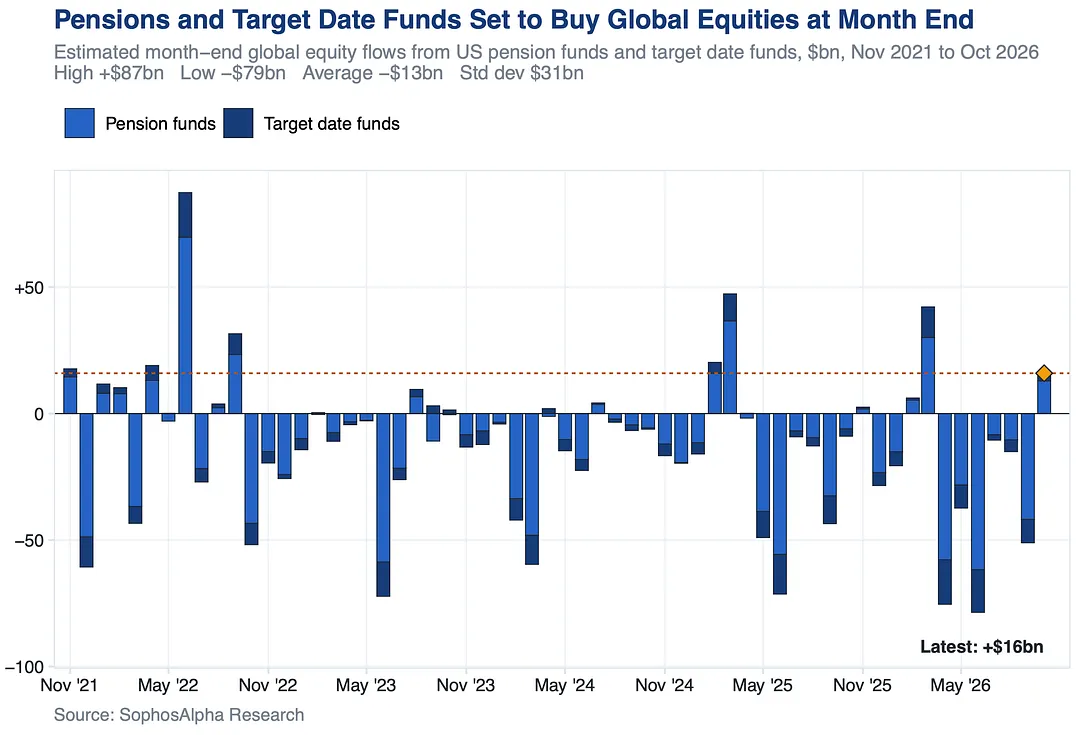
International equities take $19.7bn of the demand. US equities see $3.7bn of selling.
The month end bid is international this time. The S&P 500 gets no help from it.
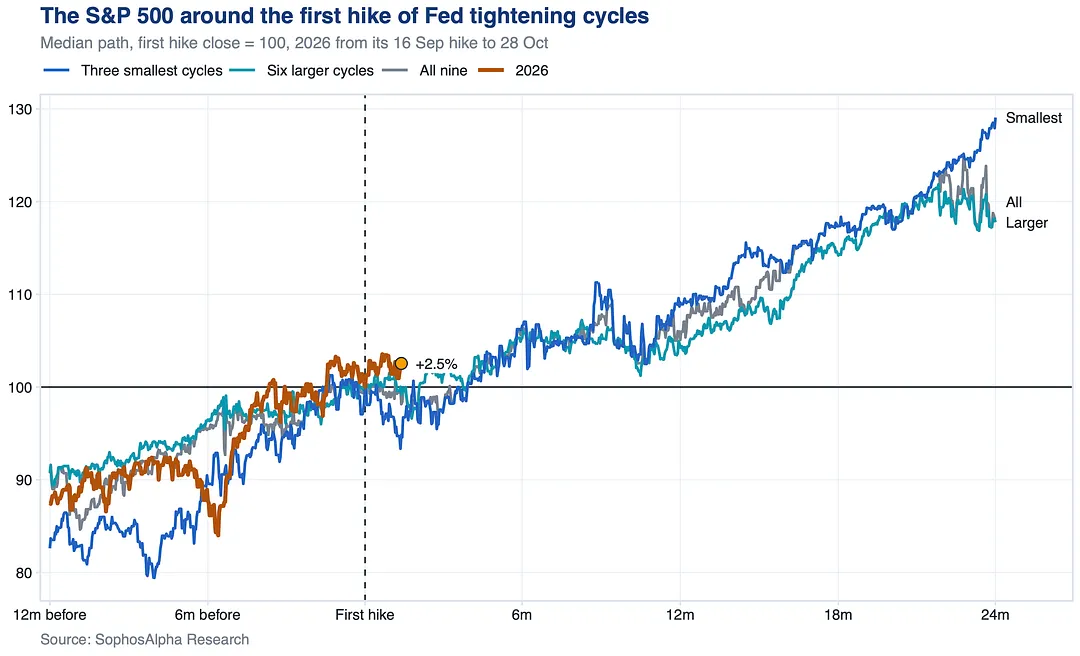
In the last nine hiking cycles, the S&P 500 dipped in the first few months and was higher a year later in eight of them. The smallest cycles did best.
After yesterday’s hold, 2026 hasn’t even hit the bump.
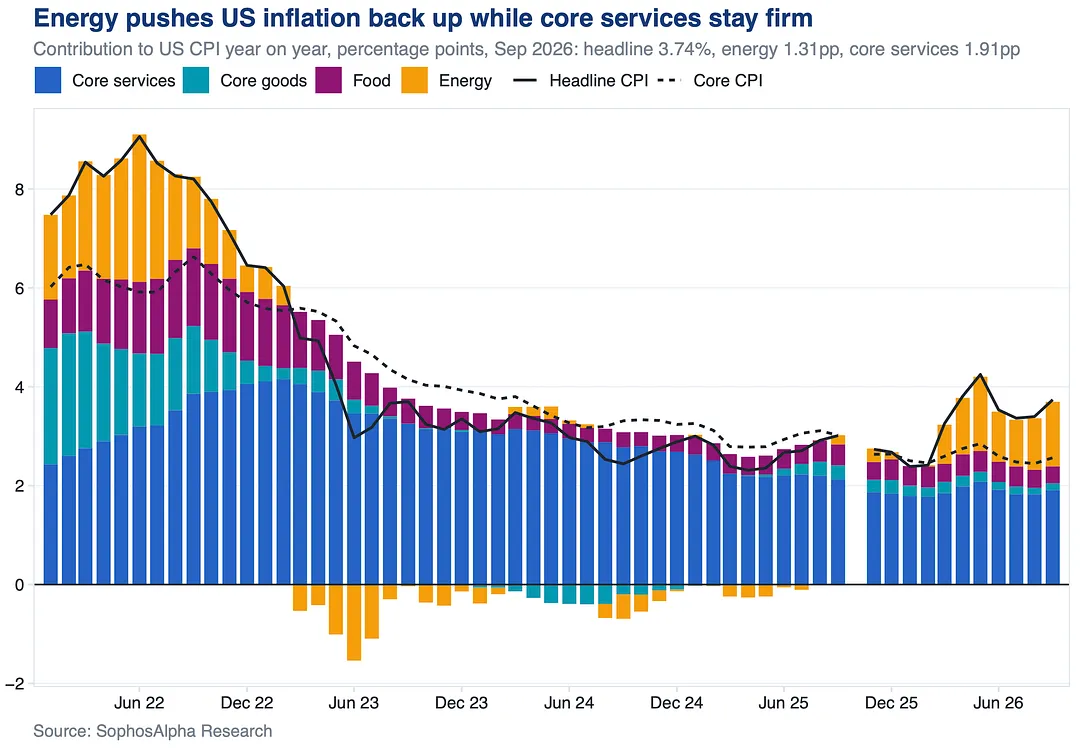
Energy drove most of September’s jump, but core prices firmed too, and core services are still the biggest single driver. That makes it hard to dismiss this as a purely external shock.
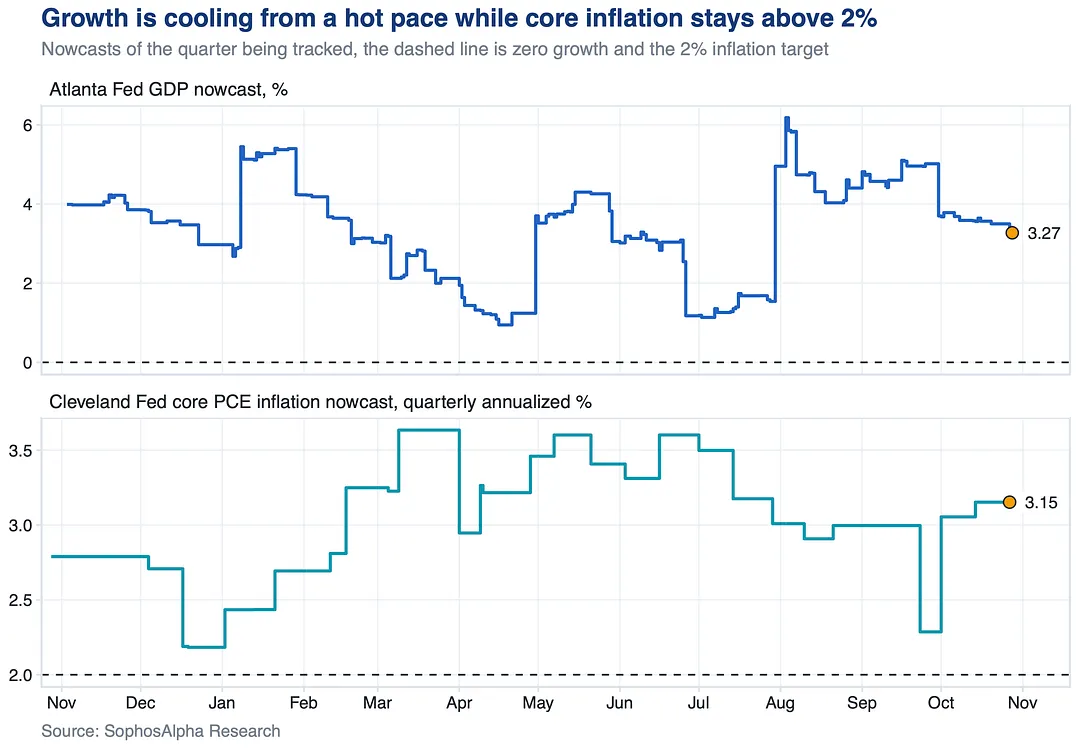
The Atlanta Fed’s GDP nowcast fell from around 5% in late September to about 3.3%. The core PCE nowcast crept up to 3.15%, well above the 2% target.
Q3 GDP and September PCE are out today.
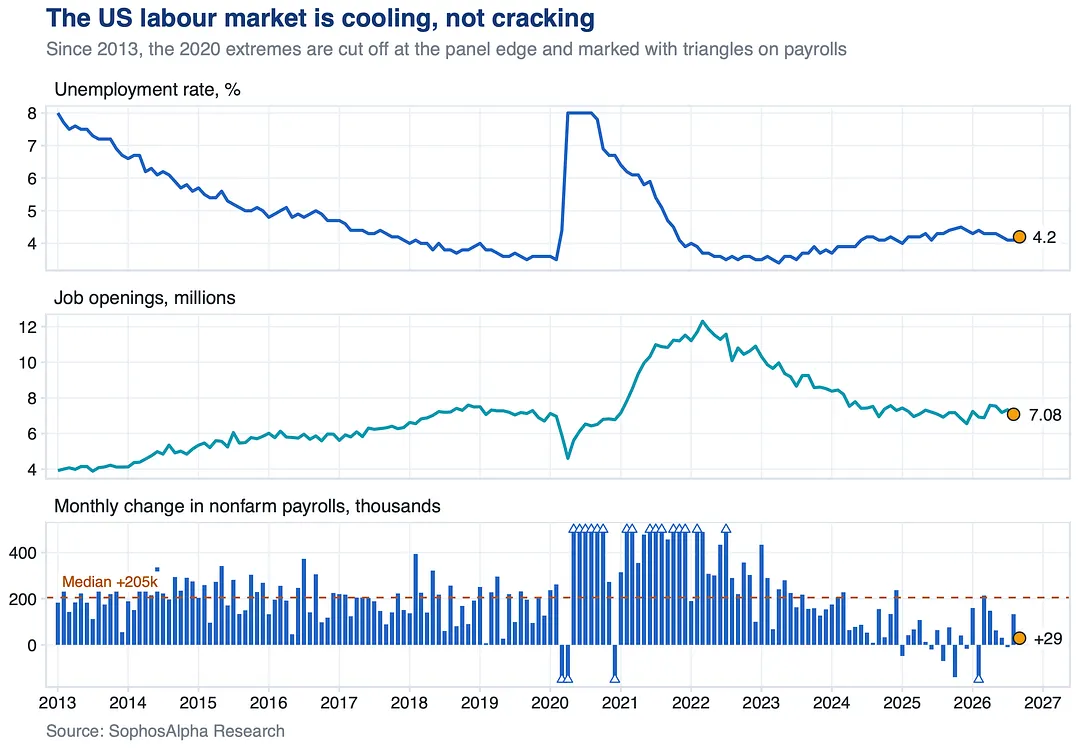
Payrolls added just 29k in September and job openings fell again. Unemployment is 4.2%, inside its range of the past two years. Cooling, not cracking.
Next tests: job openings on 3 November, payrolls on 6 November.
That tells you how crowded the long side is.
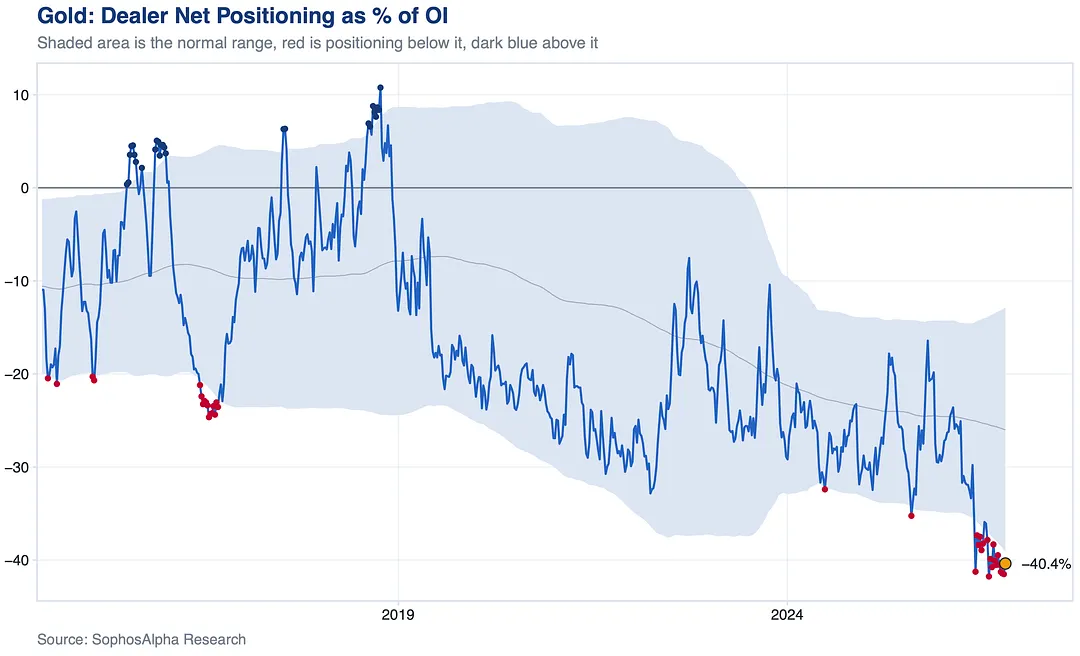
Every futures contract has a buyer and a seller. Dealers are net short 40.4% of open interest and have sat below their normal range in 19 of the last 21 weeks.
8 notes
Every one that kept going ended higher than that low.
The typical fall was around 10%. This cycle's dip so far is a fraction of that.
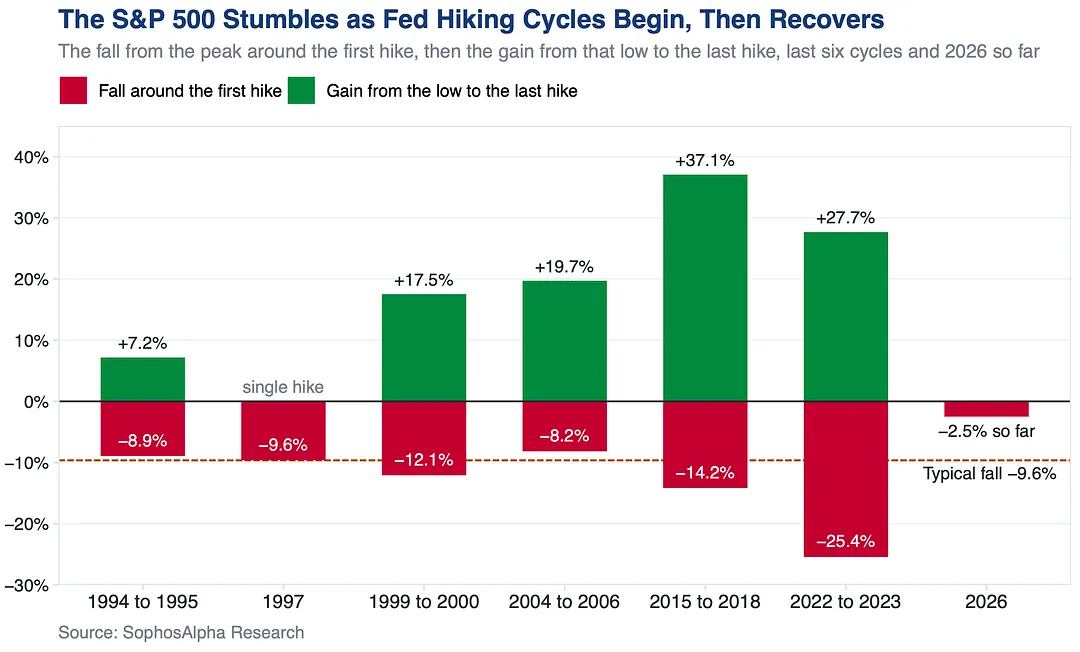
In the last six cycles it fell around 10% from its peak, with the low coming within a few months of the first hike. 2022 went much deeper.
Six weeks into this cycle, the stumble hasn't shown up, yet.
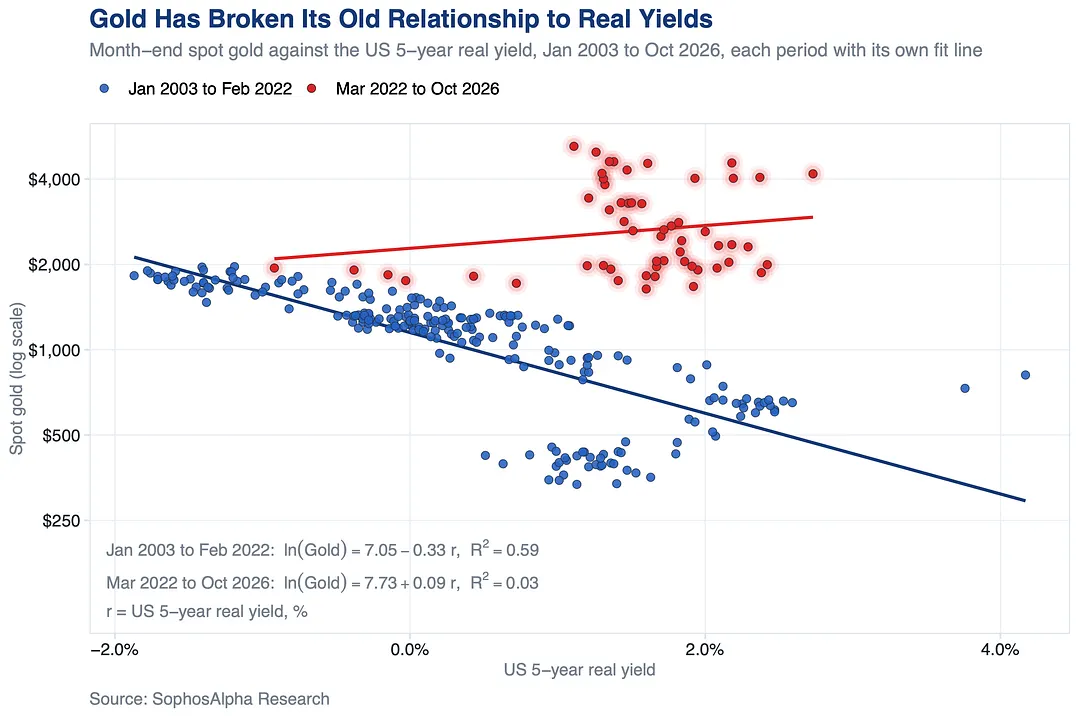
For nearly two decades, higher real yields meant lower gold. On that old relationship, today's real yield would put gold near $500. It's above $4,000.
Since 2022, gold has climbed no matter where real yields went
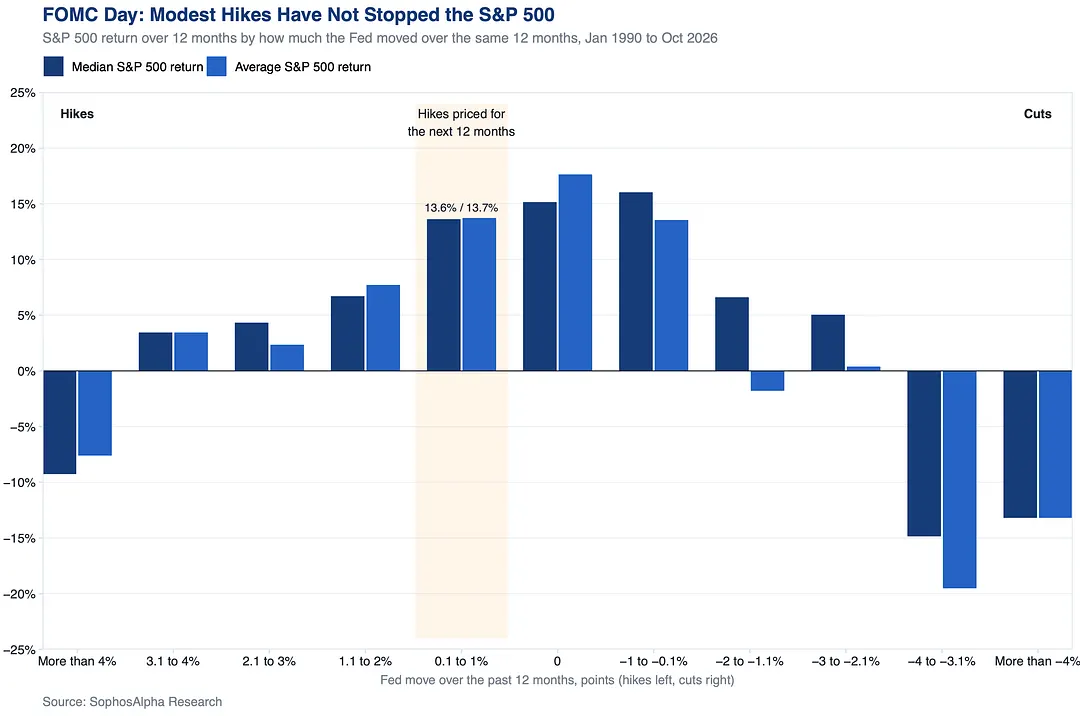
Since 1990, years when the Fed hiked by a point or less still saw stocks gain double digits on average. It's the big hiking years that hurt.
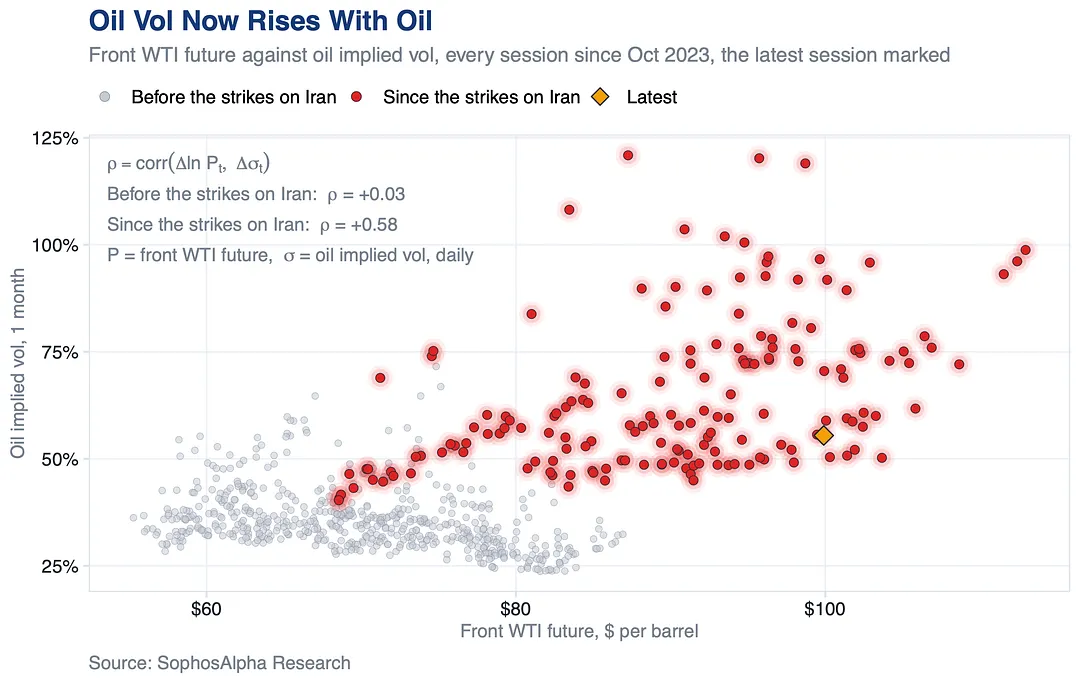
Since the strikes on Iran in late February, crude and its implied vol have moved together, a link that was absent before. Front month vol is still under half its March peak.
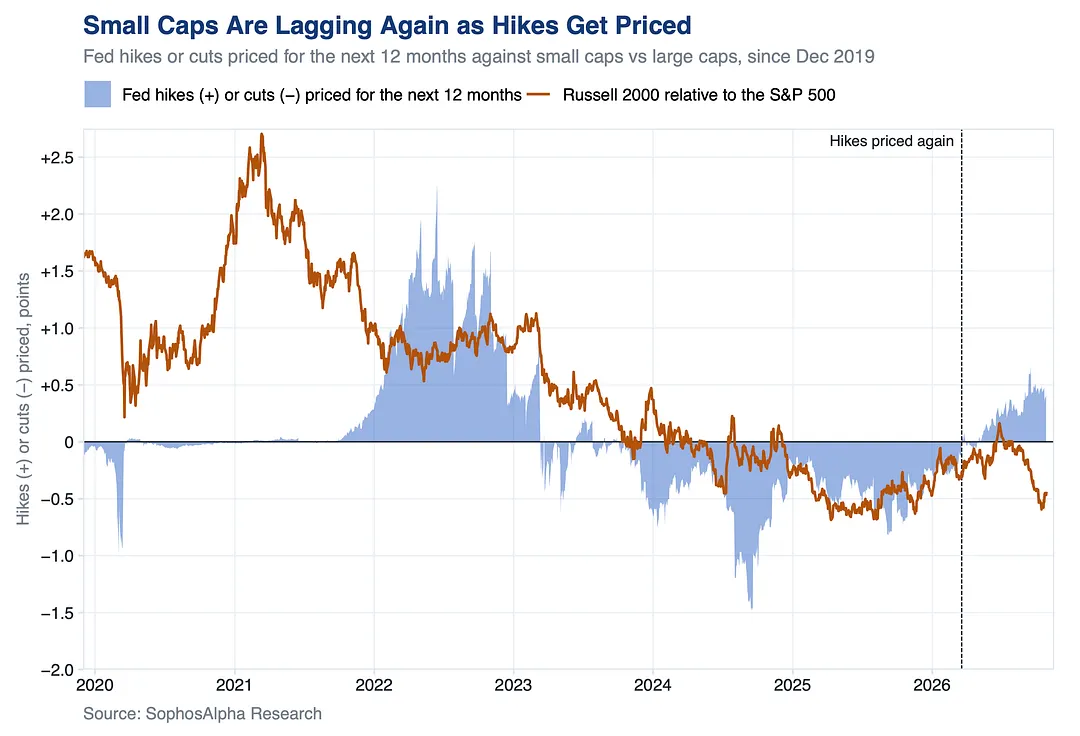
Small caps haven't.
The Russell 2000 has lost more than 10% against the S&P 500 since June, sliding back toward its 2025 lows as Fed hike pricing kept building.
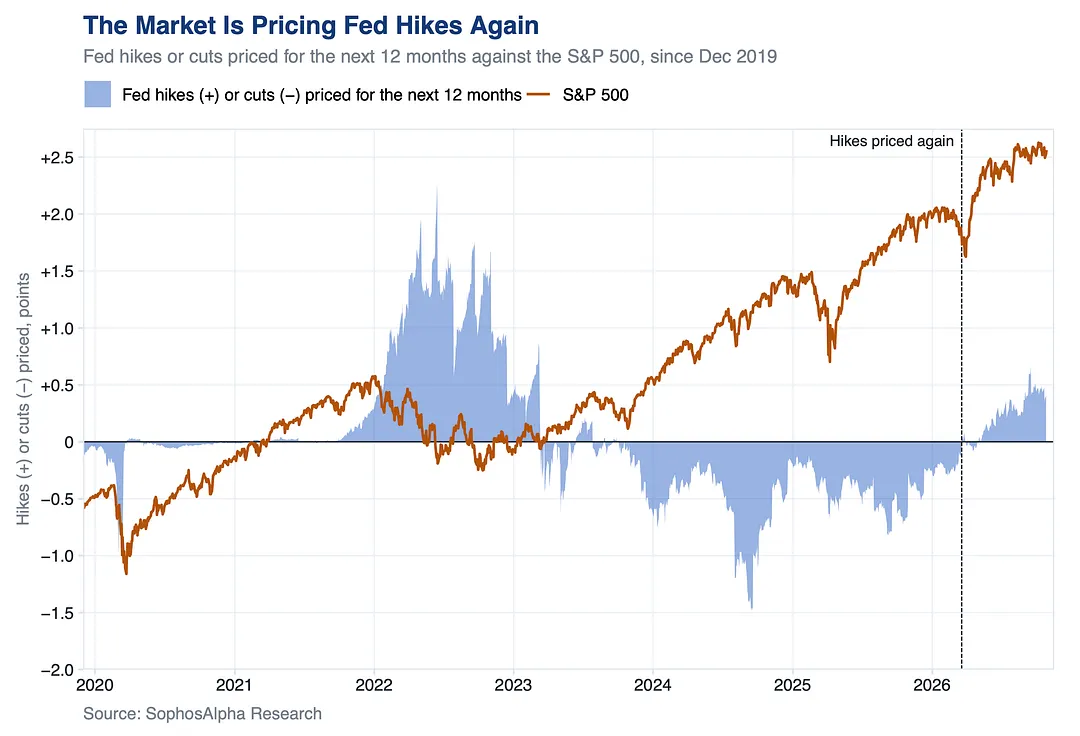
Hike pricing turned back on in late March, the first time since 2023. The last big build, in 2022, came with a rough year for stocks.
Midterm years run the same script harder: flat into late October, then the strongest finish. 2026 is a midterm year and well ahead of the script.
7 notes
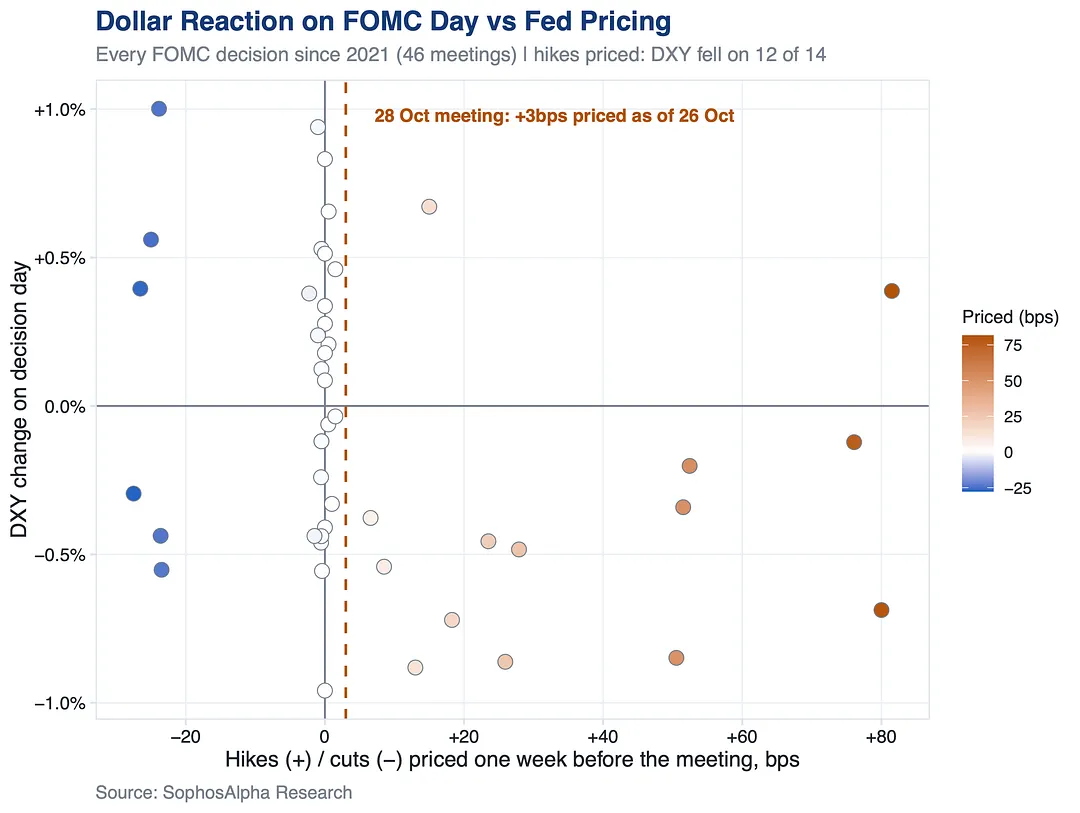
Tomorrow only 3bps is priced, leaving room for a hawkish surprise.
The S&P 500 traded sideways after Warsh took over in late May, through early August, before rebounding. Bernanke and Powell had choppy first years too.
Tomorrow's FOMC is Warsh's next test.
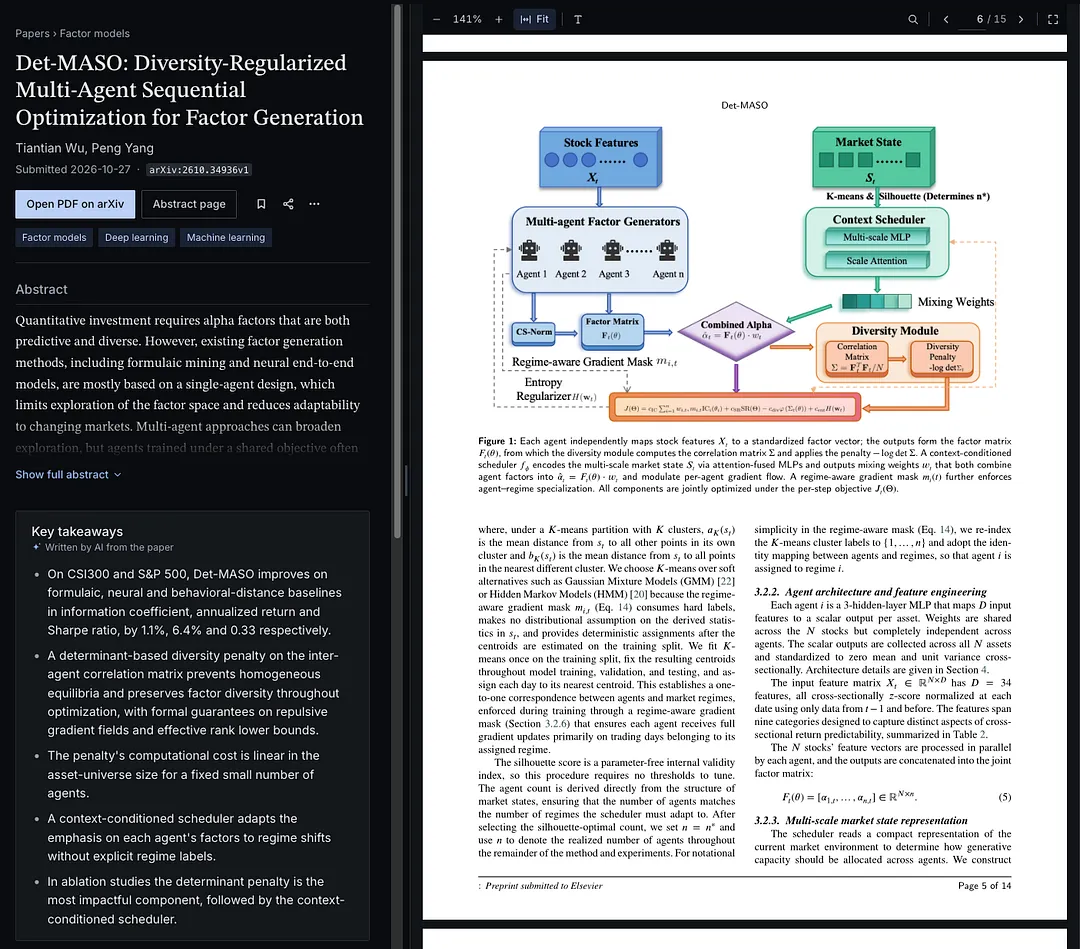
Most factor generators train a single model, so the factors it finds end up looking alike.
Today's pick from our upcoming open access library trains five AI agents together instead, each specializing in one regime: calm bull, volatile bull, sideways, slow bear and tail risk. A diversity penalty stops them converging on the same factor.
In backtests on the CSI 300 and S&P 500, it beat every model it was compared against.
Get notified when the library is live:
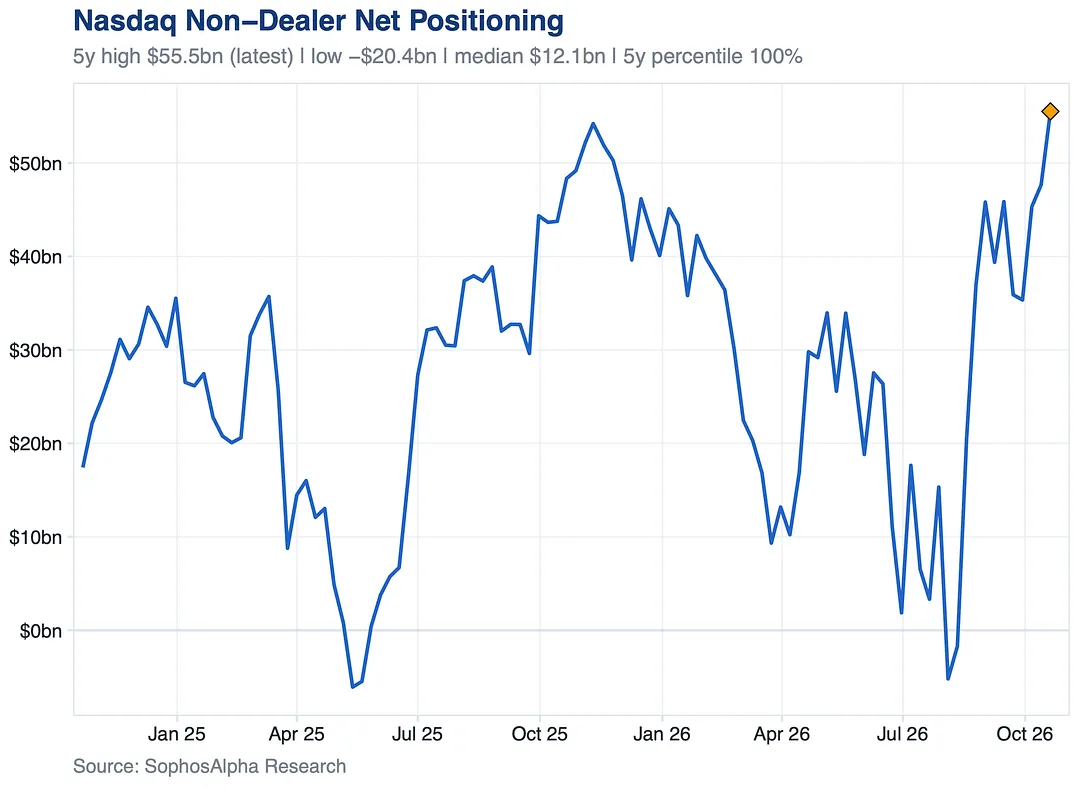
Non dealers bought $9.5bn in the week to October 20 while the index fell 3.5%. Third straight week of buying, $21.8bn since September 29.
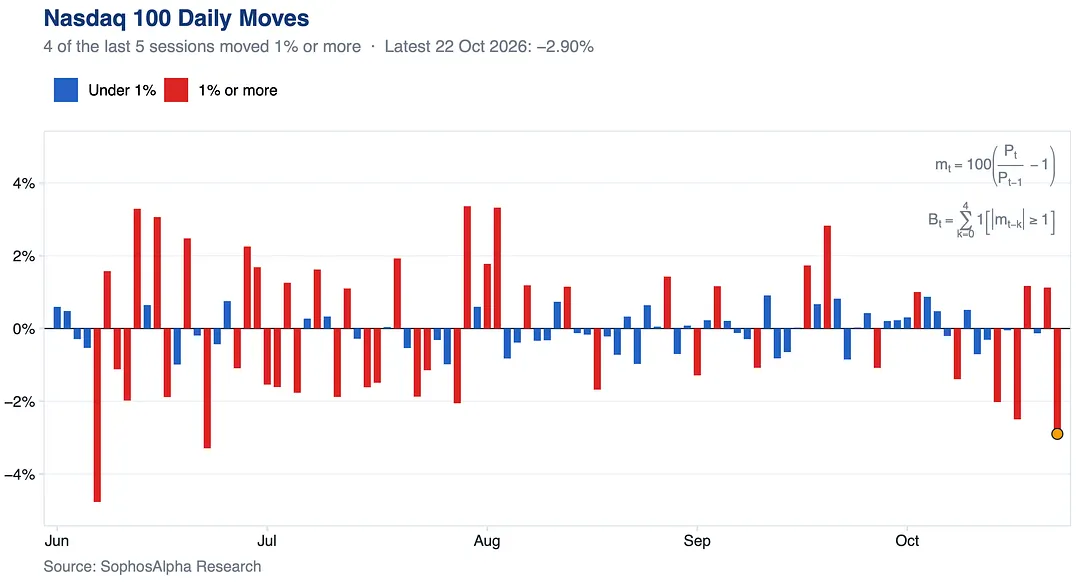
Meta's earnings sent the Nasdaq down 2.9% on October 22 and futures open interest jumped $10.6bn, the largest one day rise this year outside roll periods. Shorts were put on.
From October 22 to 26 the Nasdaq recouped 1.1% and open interest gave back $9bn. Shorts covered, and with funding cheapening, longs cut too. CTAs were likely a key driver after a momentum break.
Length is still elevated into Microsoft and Alphabet results on Wednesday and Amazon on Thursday. If they fail to impress, meaningful futures selling could follow.
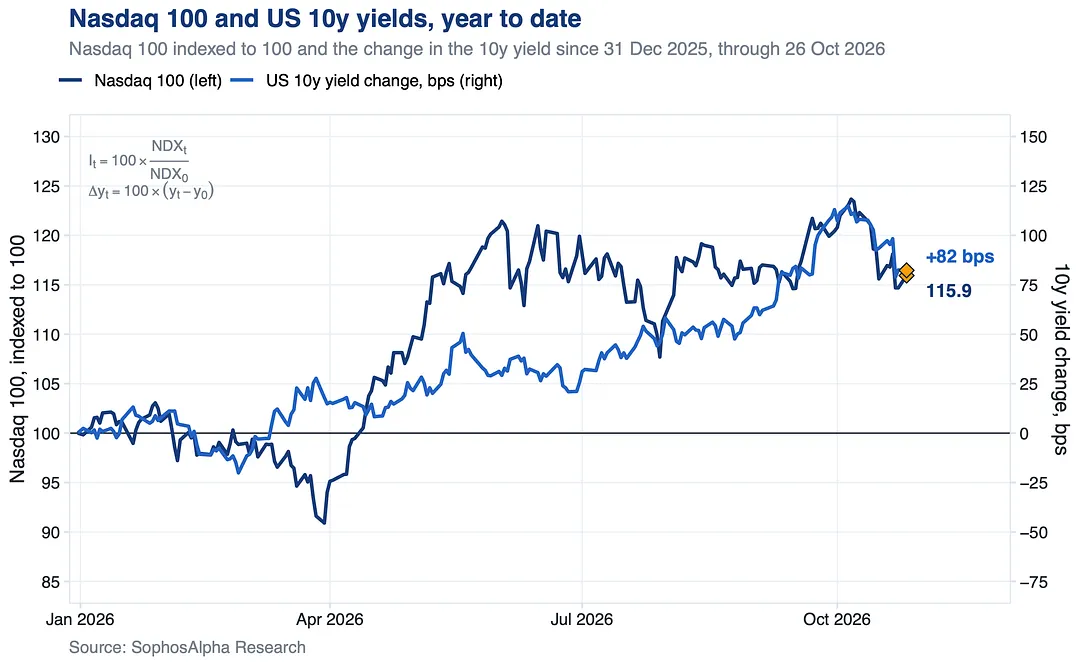
Last Thursday the Nasdaq fell almost 3% and the 10y yield had its biggest one day drop since the 2023 banking scare.
In the spring selloff, yields rose as tech fell. This time they are falling together.
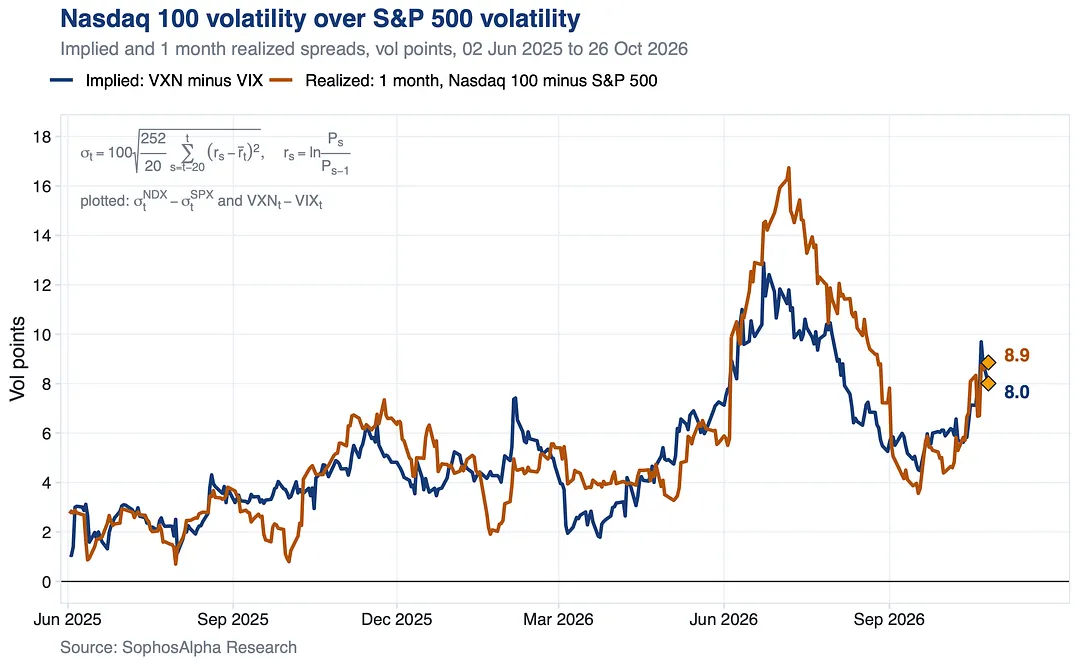
The volatility gap between them, both what options price and what the market delivers, has roughly doubled since September.
As long as AI drives this market, the Nasdaq moves further than the S&P in both directions.
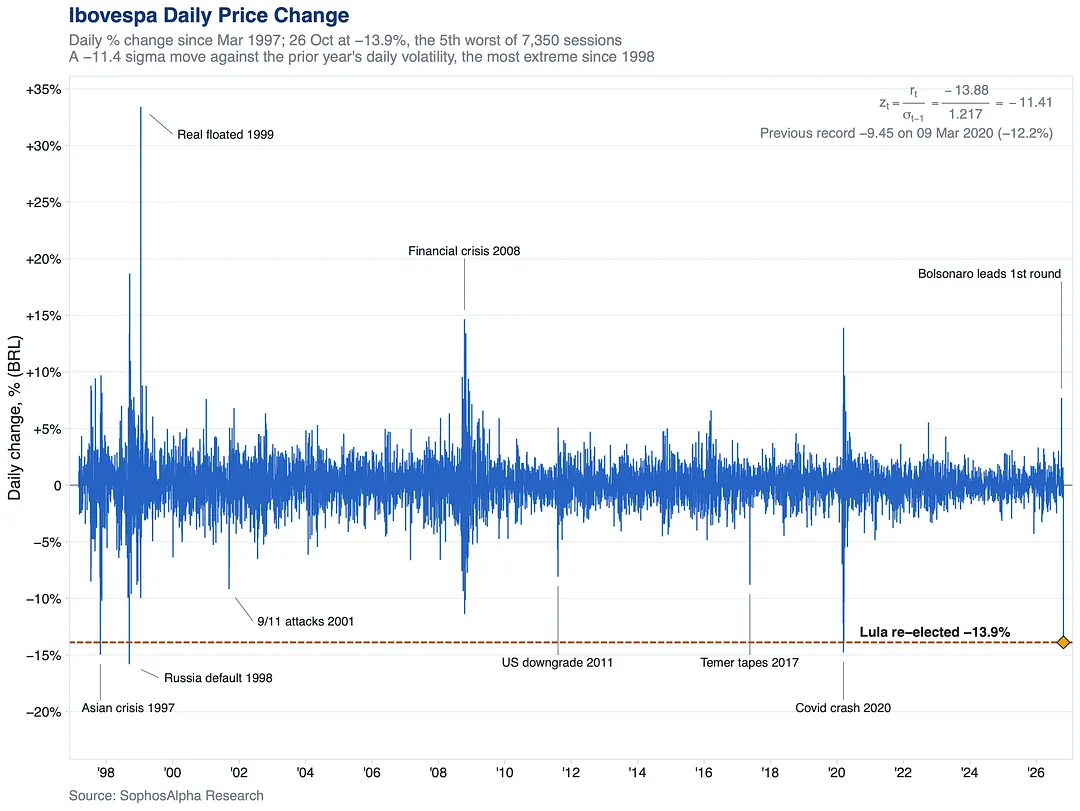
The Ibovespa, Brazil's benchmark stock index, fell 13.9% on Monday after Lula's reelection. It was down as much as 17.3% intraday and tripped the circuit breaker for the first time since March 2020.
The Asian crisis, Russia's default and Covid all brought drops as deep or deeper, but in markets already in panic. Measured against how calm the market had been, Monday was the bigger shock. Covid's worst was 9.5 sigma.
12 notes
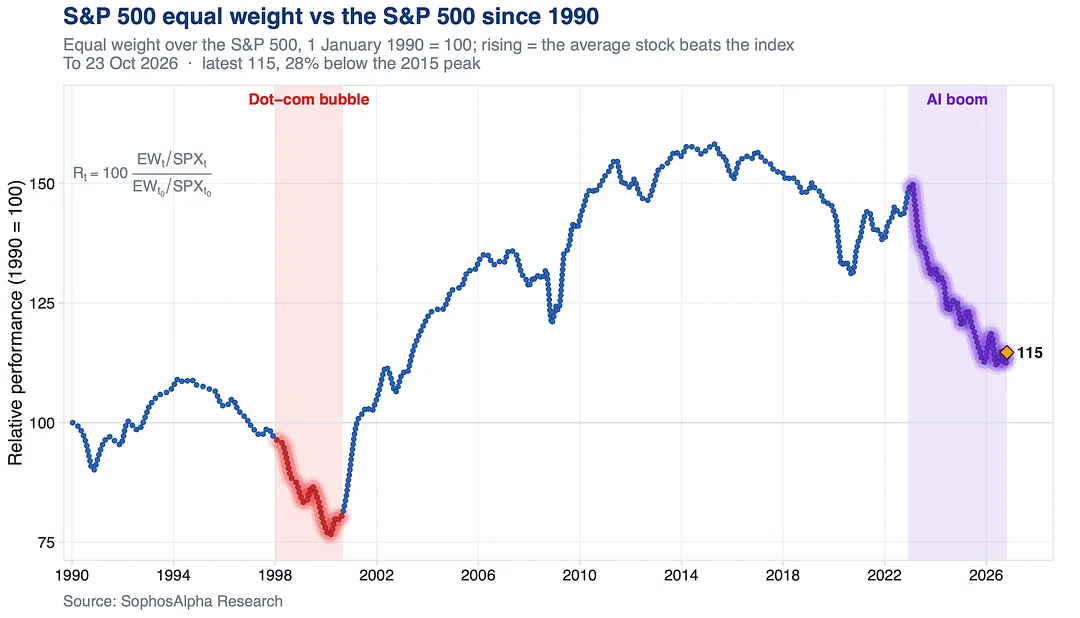
Equal weight slid through the AI boom just as it did into 2000. After that bubble burst, it beat the index by nearly 50% over five years.
The better opportunities now sit outside the megacaps, which favours portfolios spread across sectors, regions and company sizes in the years ahead.
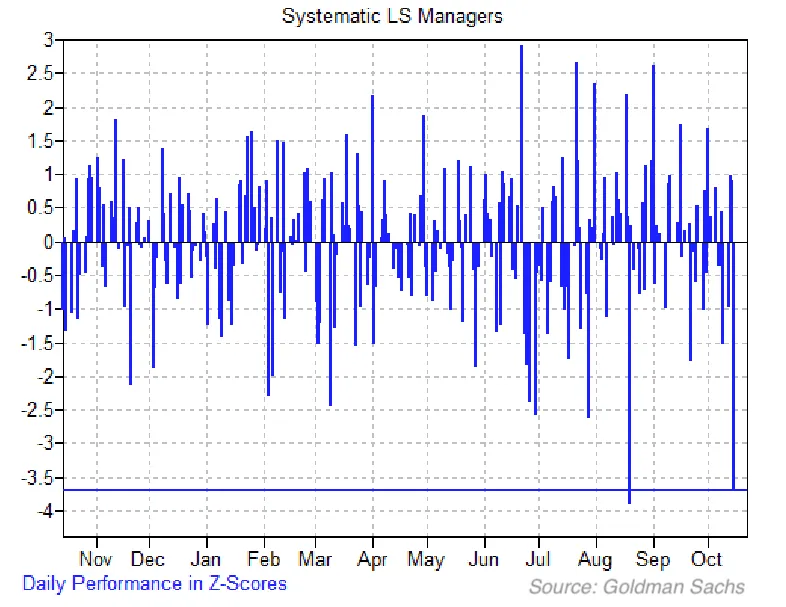
Last Thursday, all three major hedge fund groups lost more than 1% on the same day, a first since COVID.
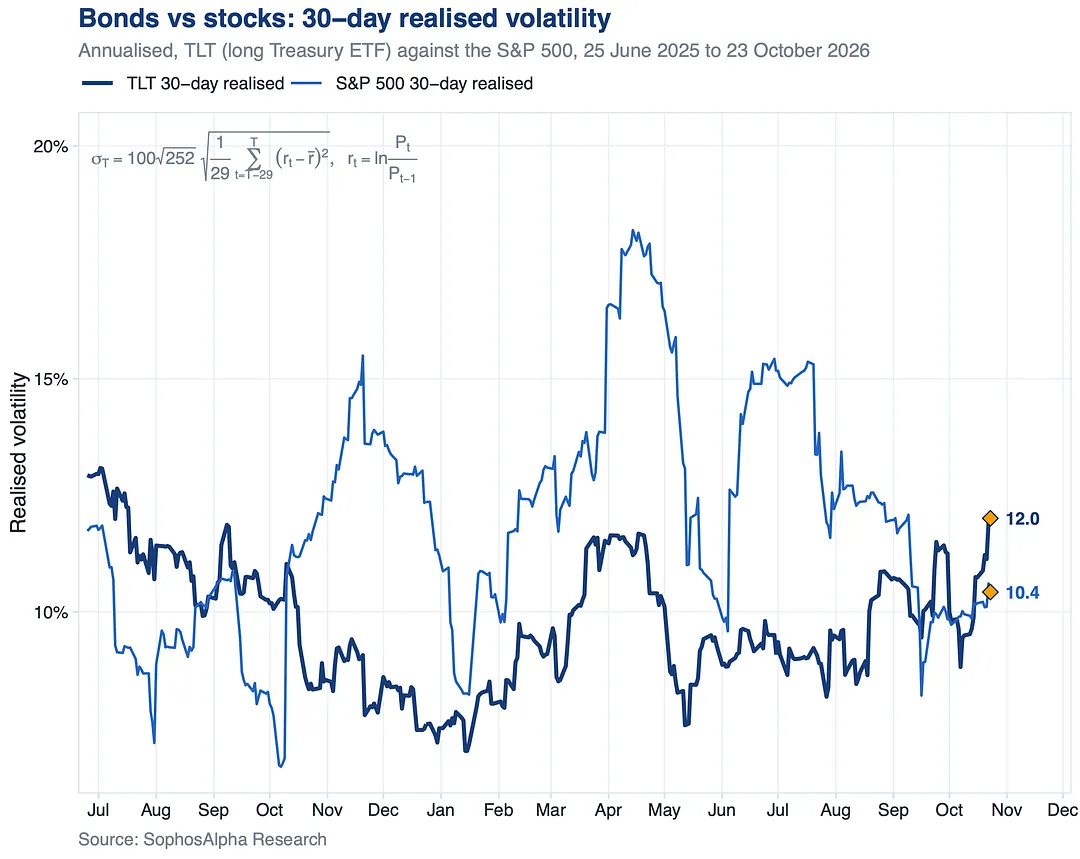
Long dated Treasuries have swung more than the S&P 500 over the past 30 days, by the widest margin in over a year.
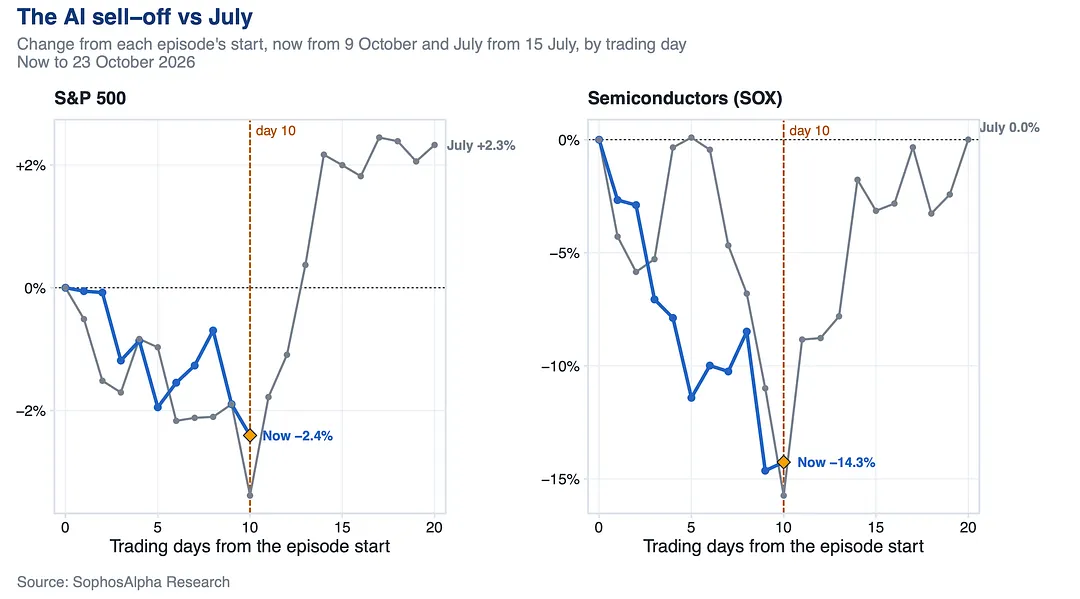
Ten trading days in, semis are down 14% and the S&P 500 just 2.4%. In July, both bottomed right at day 10, and semis were back to flat ten days later.
Friday was day 10. The next two weeks decide whether the pattern holds.
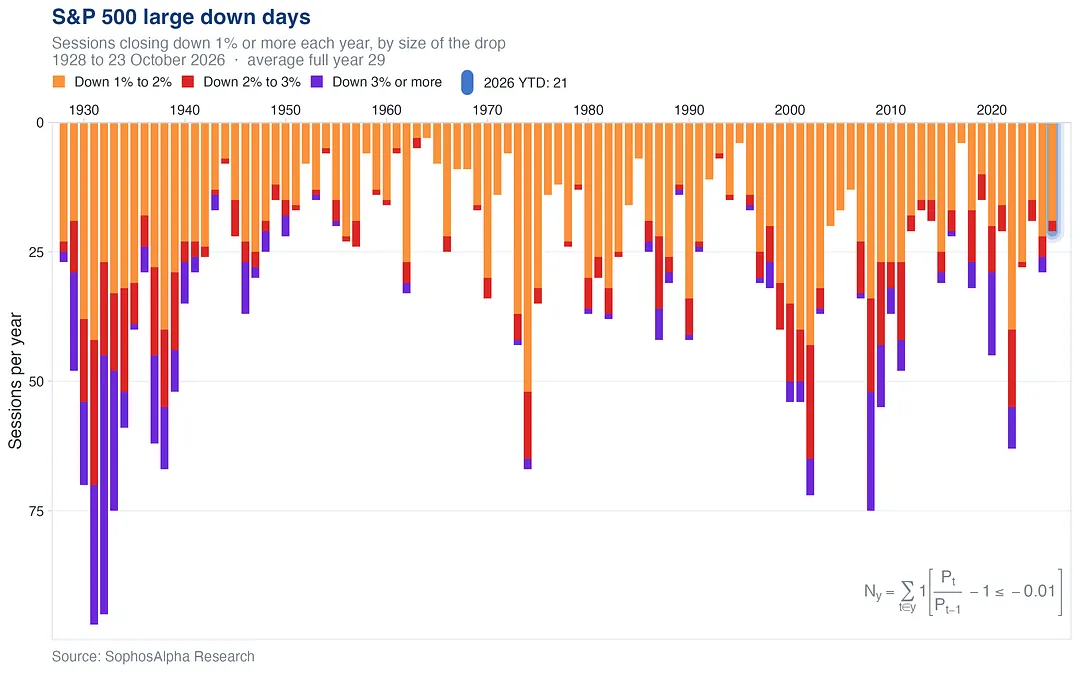
That is exactly the median for this point in the year since 1928, and the average full year brings 29.
Down days like these are the price of admission for stock market returns.
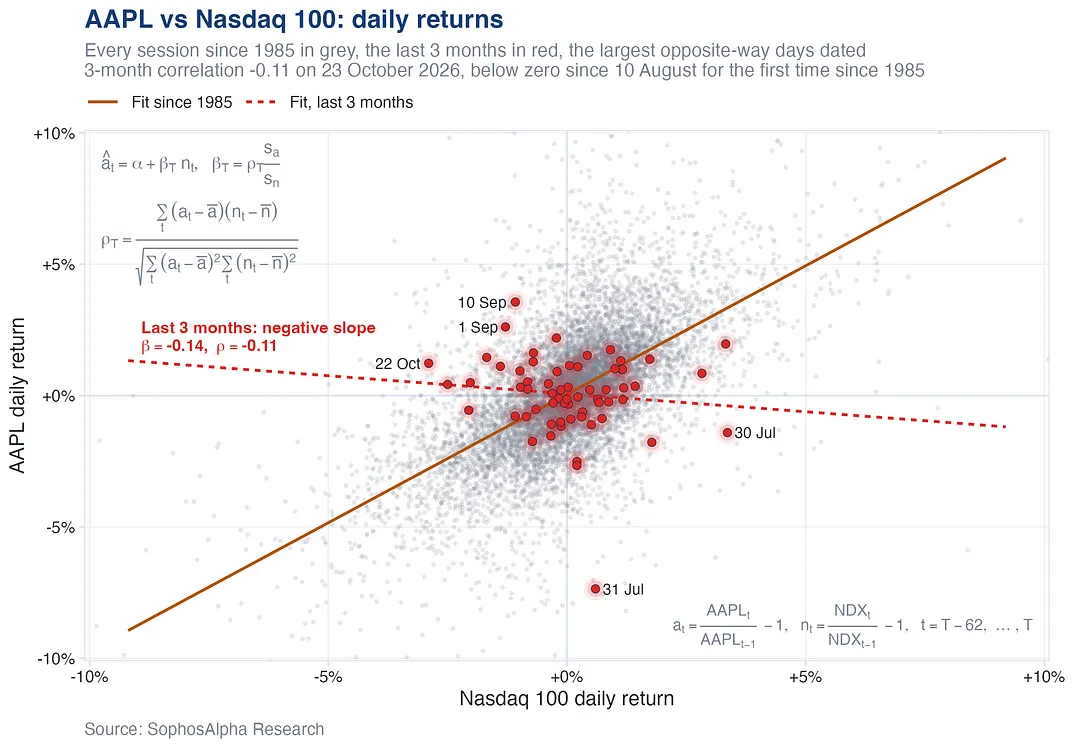
Their 3 month correlation turned negative in August and is still below zero. In four decades it had never even come close.
The stock that helped build the index is now trading on its own.
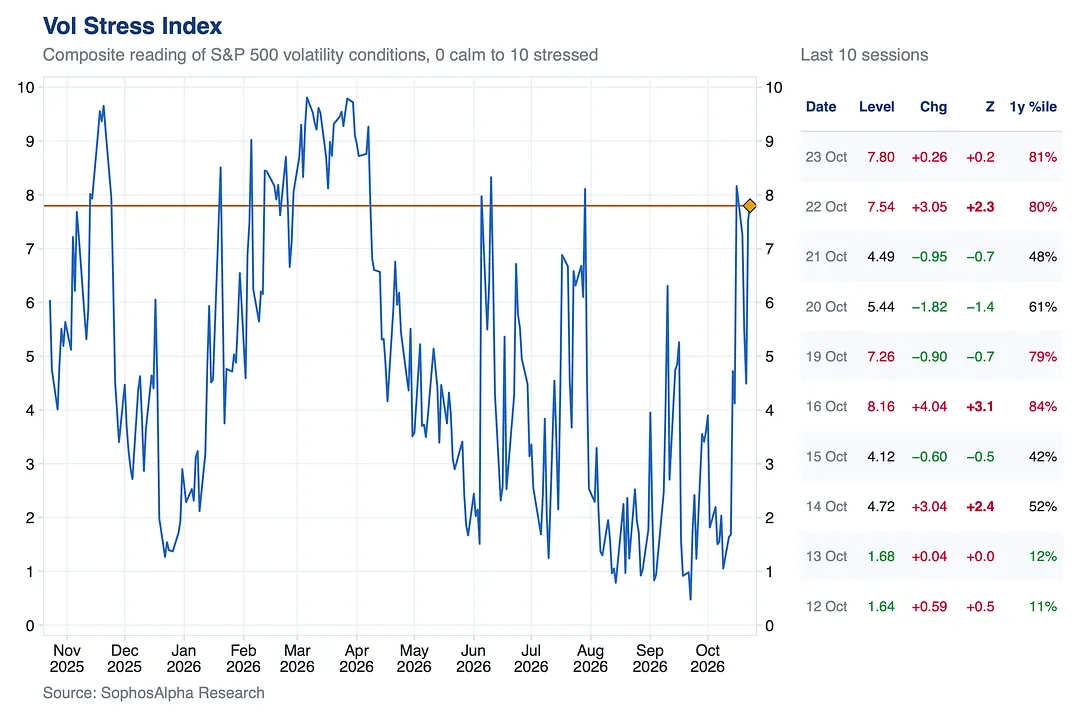
Two weeks ago it sat at 1.68.
That is a sharp change in hedging behavior for an S&P 500 sitting just 2.5% below its record close.
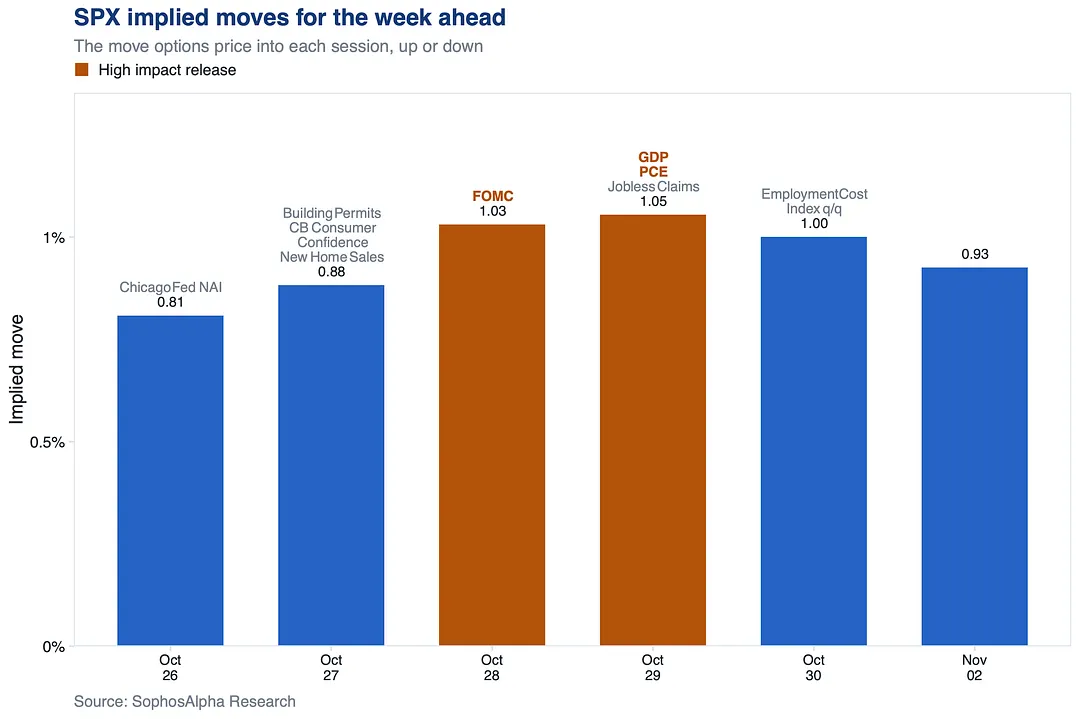
Options are pricing Wednesday and Thursday as the two biggest SPX sessions, at 1.03% and 1.05%.
FOMC lands Wednesday with Microsoft and Alphabet earnings. GDP, PCE and Amazon follow Thursday.
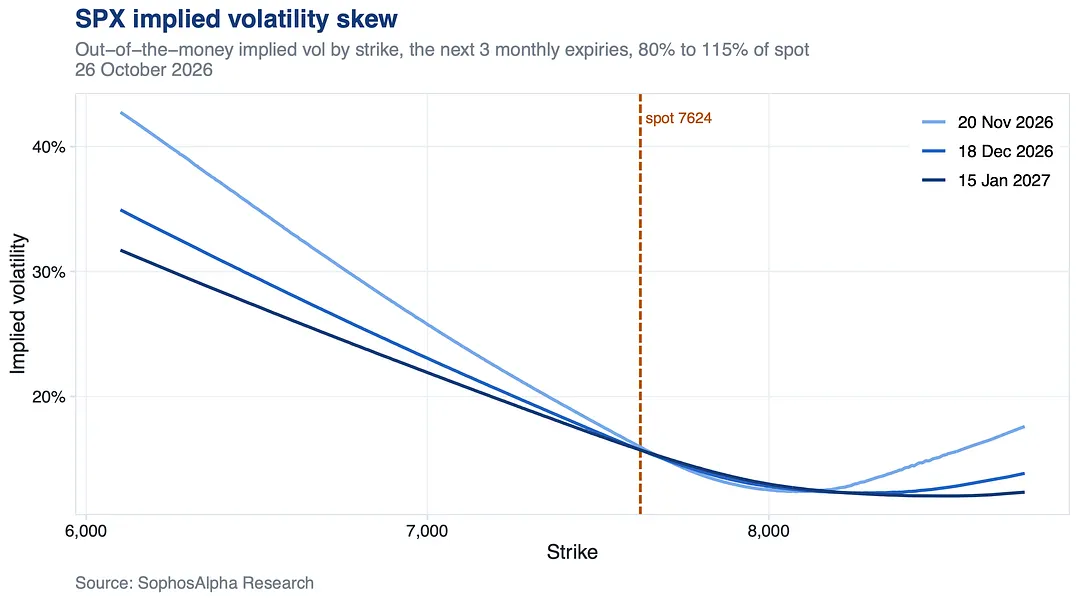
Crash protection is priced far richer than options at the market, and calls well above it are priced up too.
The Fed and big tech earnings both land before November expiry. The market is pricing both tails.
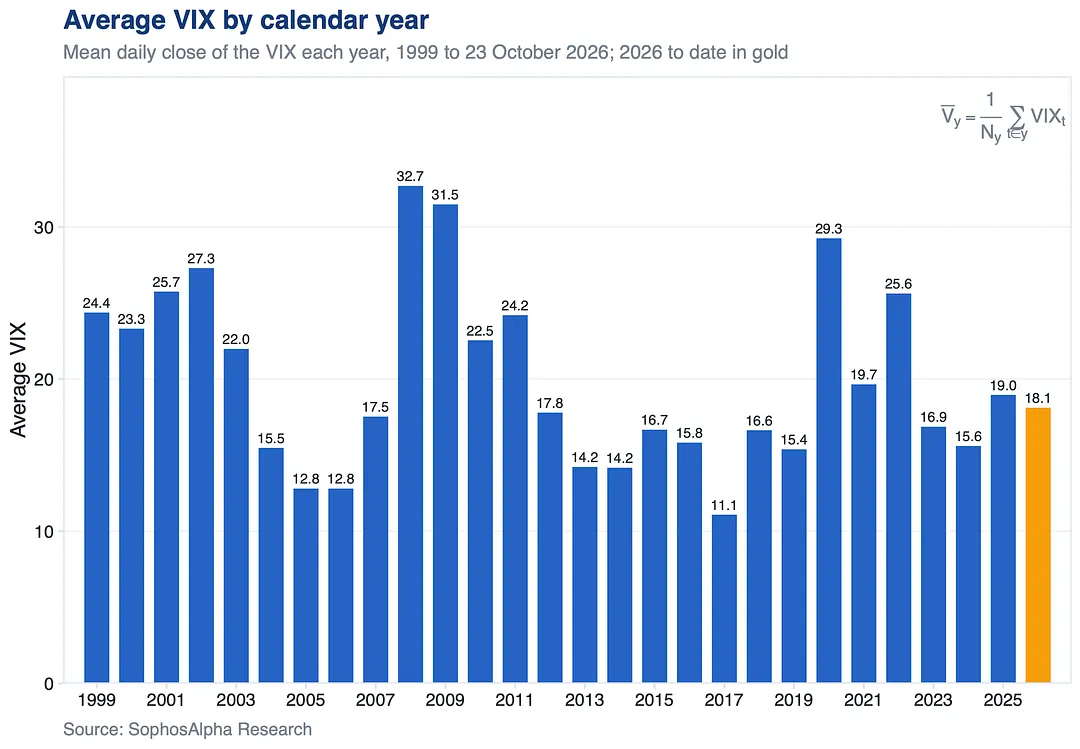
Its 2026 average sits right around the typical year since 1999, and nowhere near the crisis years of 2008, 2009 and 2020.
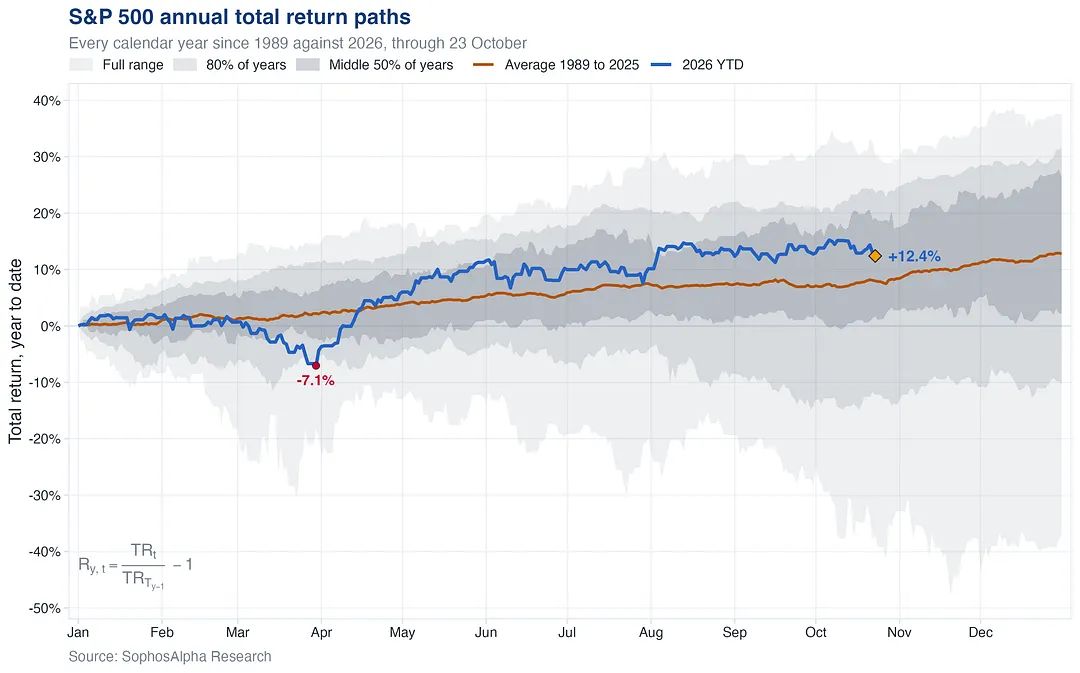
As of Friday it is up 12%, well ahead of the 8% an average year had gained by this date.
Last year's tariff low ran deeper, down 15% in April, and was up 16% by this point.
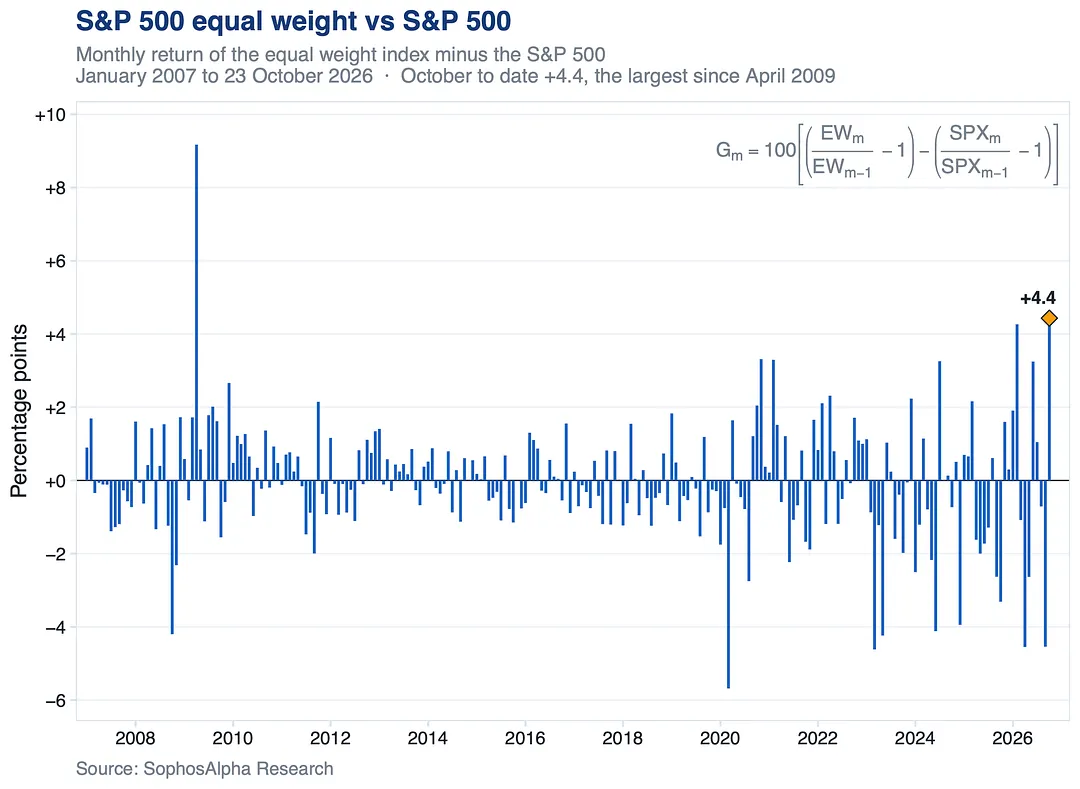
Leadership is shifting from the biggest names to the rest of the market.
2 notes
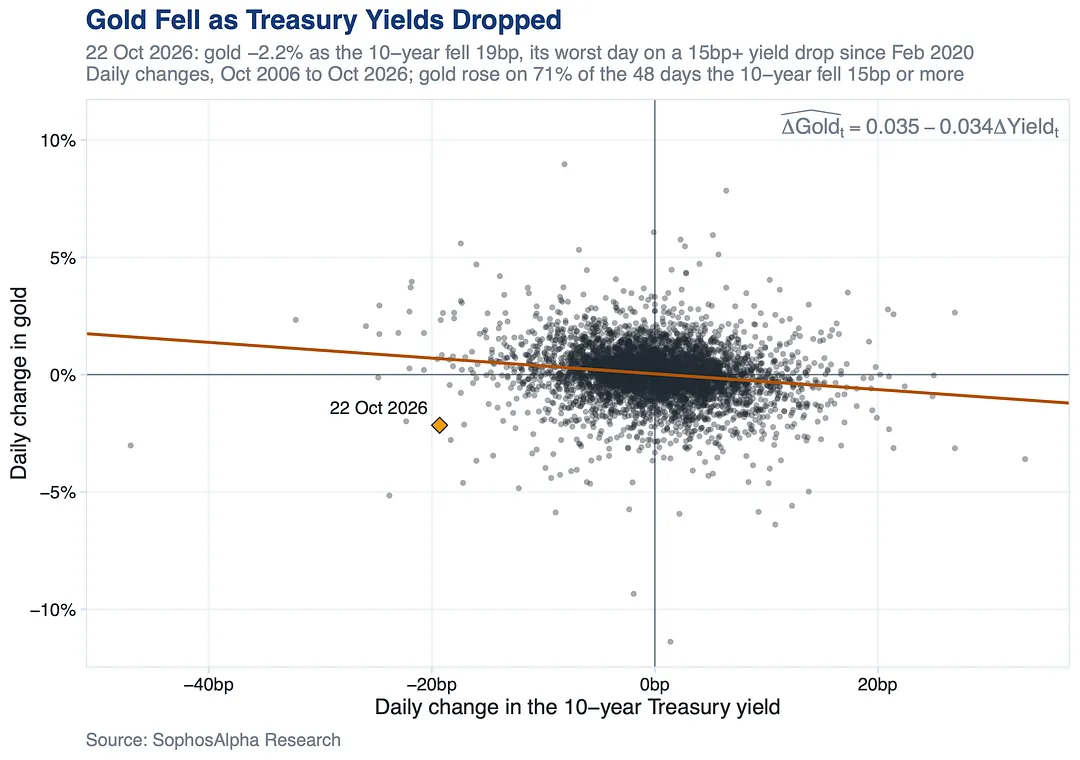
Over 20 years, gold rose on about 7 in 10 of those big yield drops. This time it traded with the Nasdaq 100, down nearly 3%, not with bonds.
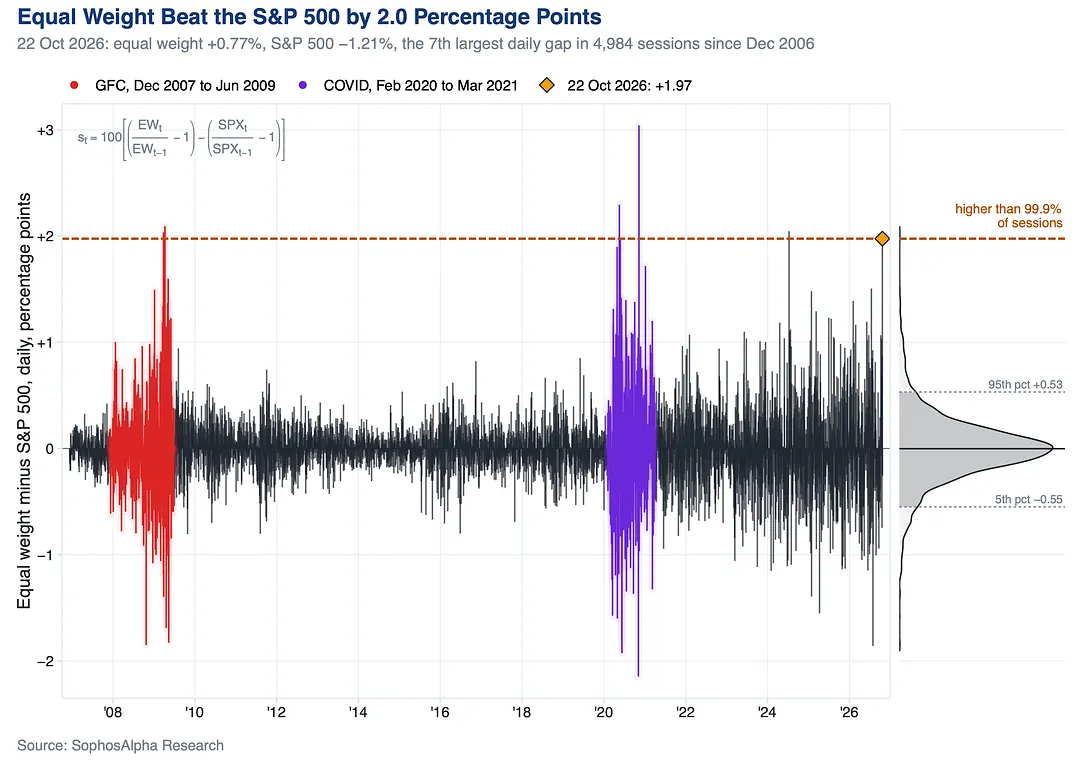
Equal weight beat the index by about 2 points, a gap seen only a handful of times since 2006, mostly in 2009 and 2020.
In October equal weight is up 4%, the S&P 500 roughly flat.
3 notes
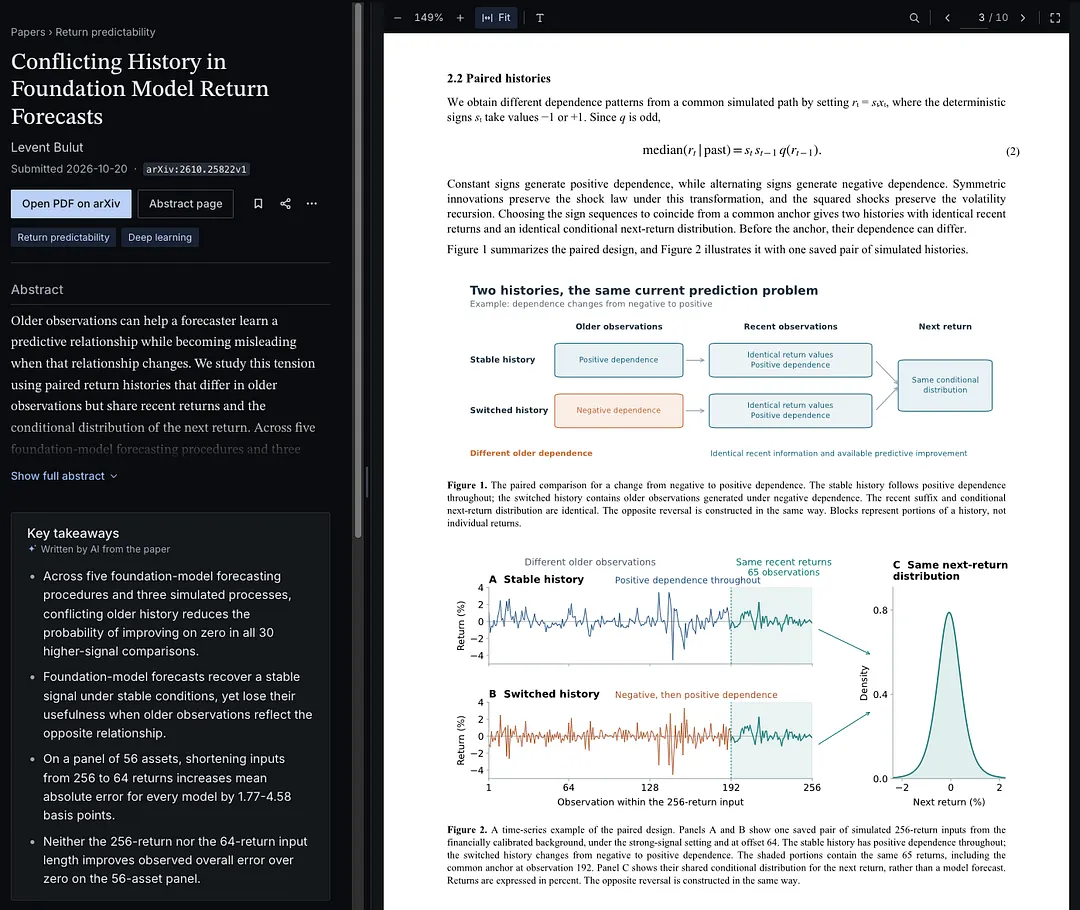
Today's pick from the library asks how much history a return forecaster should use. Older observations may help reveal a weak predictive relationship, but they may also point to a relationship that no longer holds.
In simulations, old data pointing the wrong way made all five AI models tested worse. But cutting the history made every model less accurate on 56 real assets.
Get notified when the library is live: https://sophosalpha.substack.com/subscribe
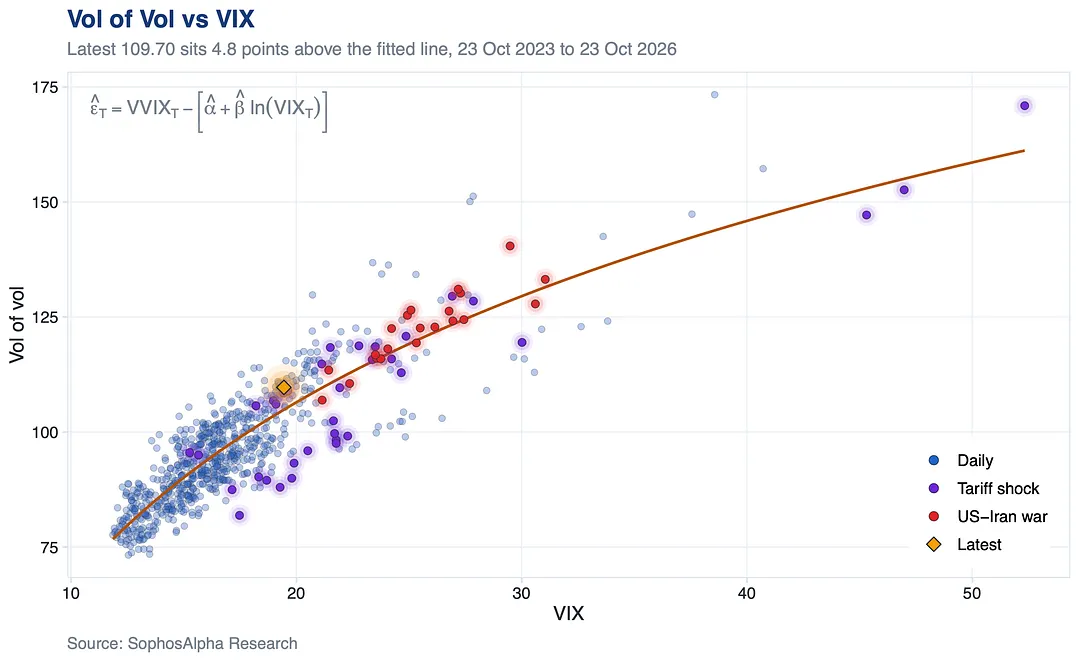
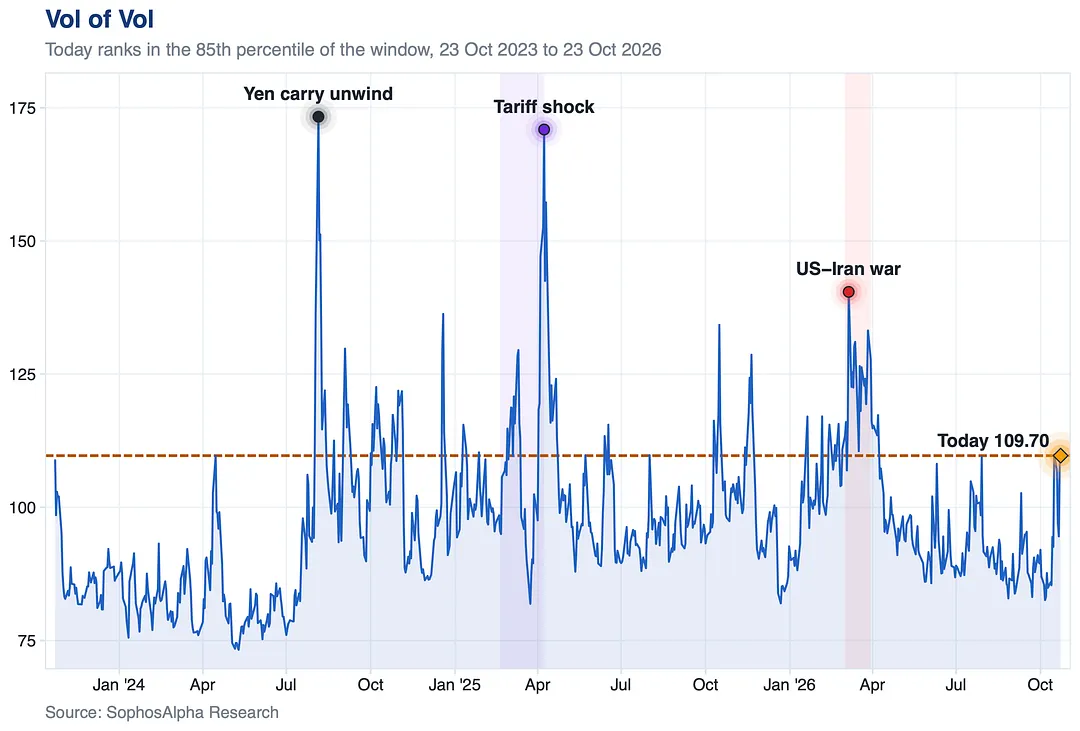
It has climbed back into the range it held during the Iran war, while VIX is still below the bottom of its own war range.
Measured against the VIX level, vol of vol sits in the 78th percentile of the last 3 years.
The options market is bracing before the index has moved.
Since then VIX dropped into Wednesday's expiry and bounced right back by Friday.
Vol of vol is back near its highest since early April, in the 85th percentile on a 3 year lookback.
The latest data shows asset managers trimmed that short, but it is still one of the largest on record.
Not an extreme yet, but there is a lot of short left to cover if anything breaks.
7 notes
In reinforcement learning and LLMs, a book is out of date the month it comes out.
To keep up with these fields, read the research papers. That is where new work shows up first.
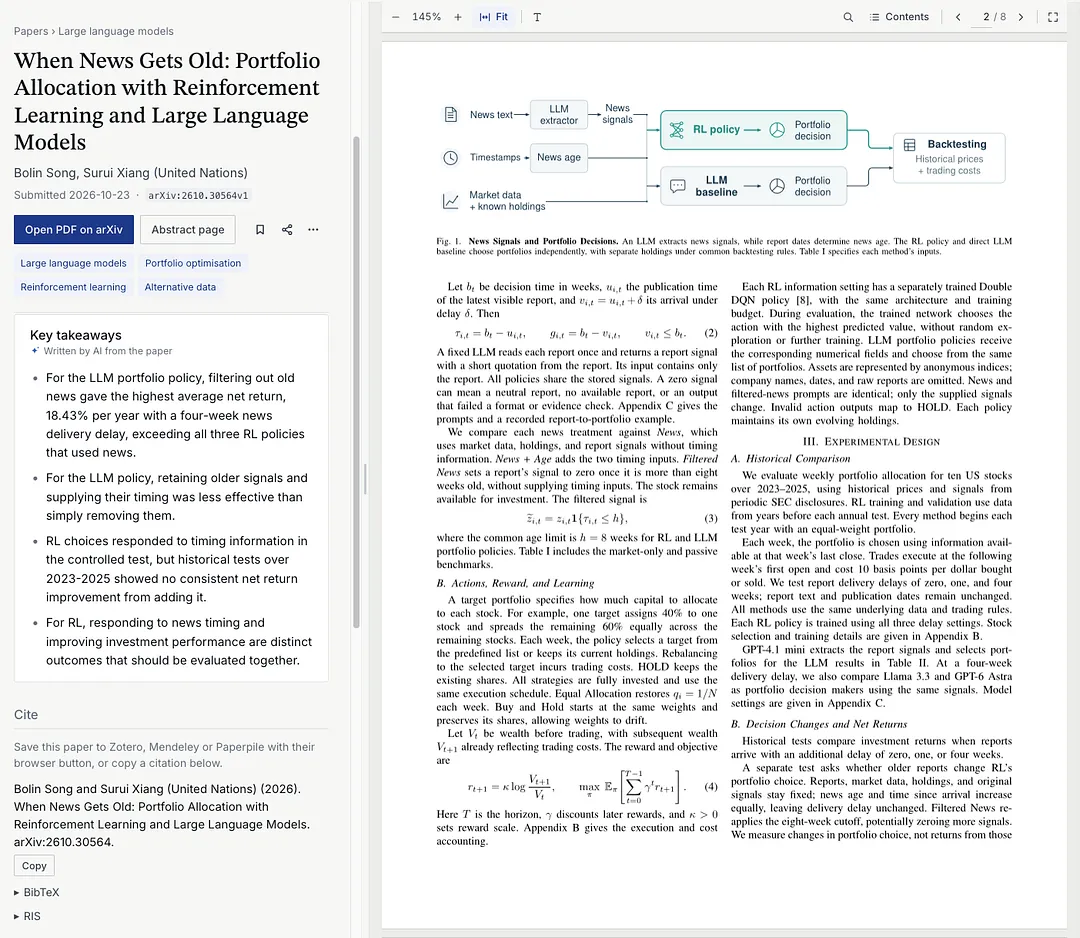
Today's pick in our free index of 10,000+ papers asks what an AI portfolio should do with old news.
On ten US stocks over 2023 to 2025, an LLM that simply ignored SEC filings older than eight weeks earned 18.43% a year after costs, with the news arriving four weeks late.
That beat every reinforcement learning model that used news. Keeping old news and telling the models its age did no better.
Get notified when our free library is live: https://sophosalpha.substack.com/subscribe
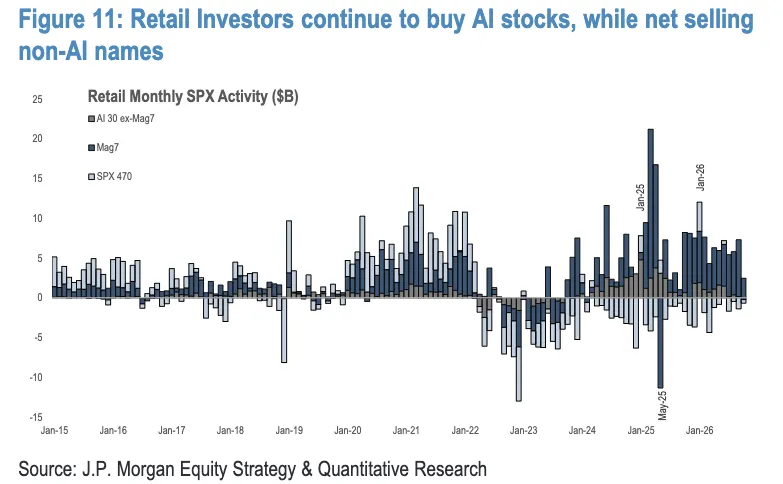
Hedge funds sold tech at the fastest pace in a decade and cut risk to near three year lows.
Retail bought the dip: tech ETFs had their biggest inflow day on record, and buying spread to chip names beyond the Mag 7.
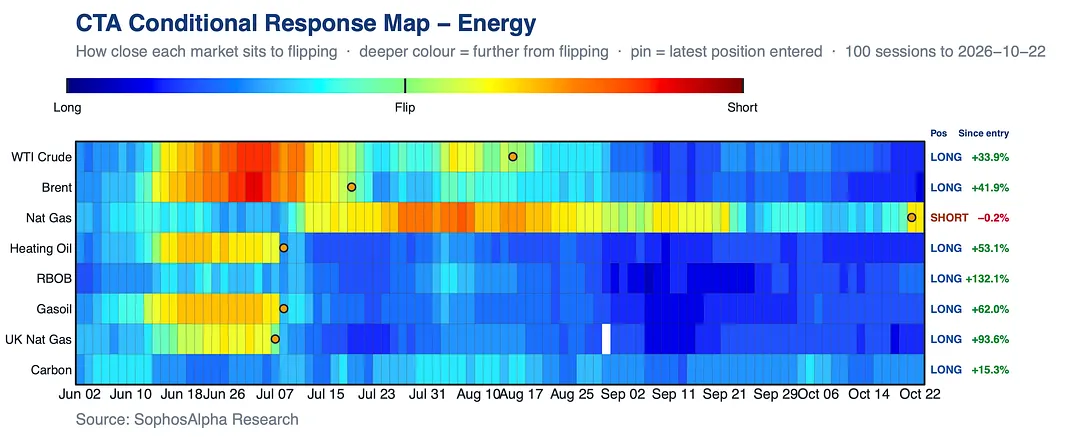
A few days ago we shared that trend followers have been well positioned to capture this move for weeks.
One of our in house trend models has been in these longs since July and is well into profit on the energy front.
The average member actually gained 0.74%.
Six of the Magnificent 7 fell, led by META down 7%, and their weight was enough to drag the whole index into the red.
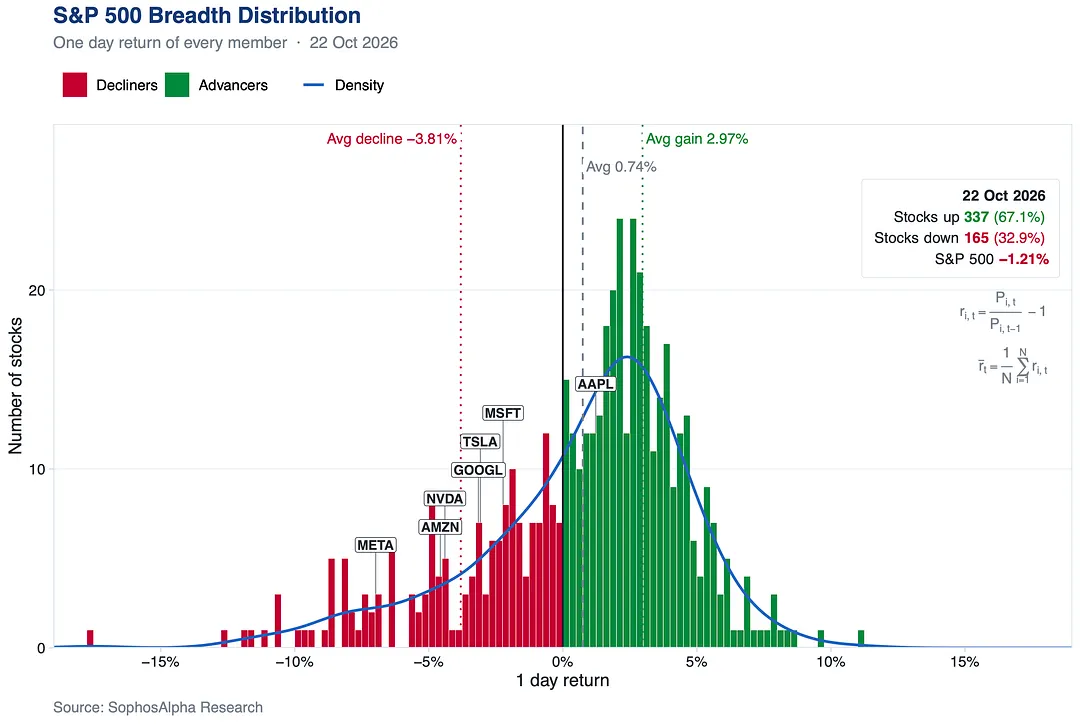
The index closed red, yet two thirds of its stocks finished higher and most of the big moves were to the upside.
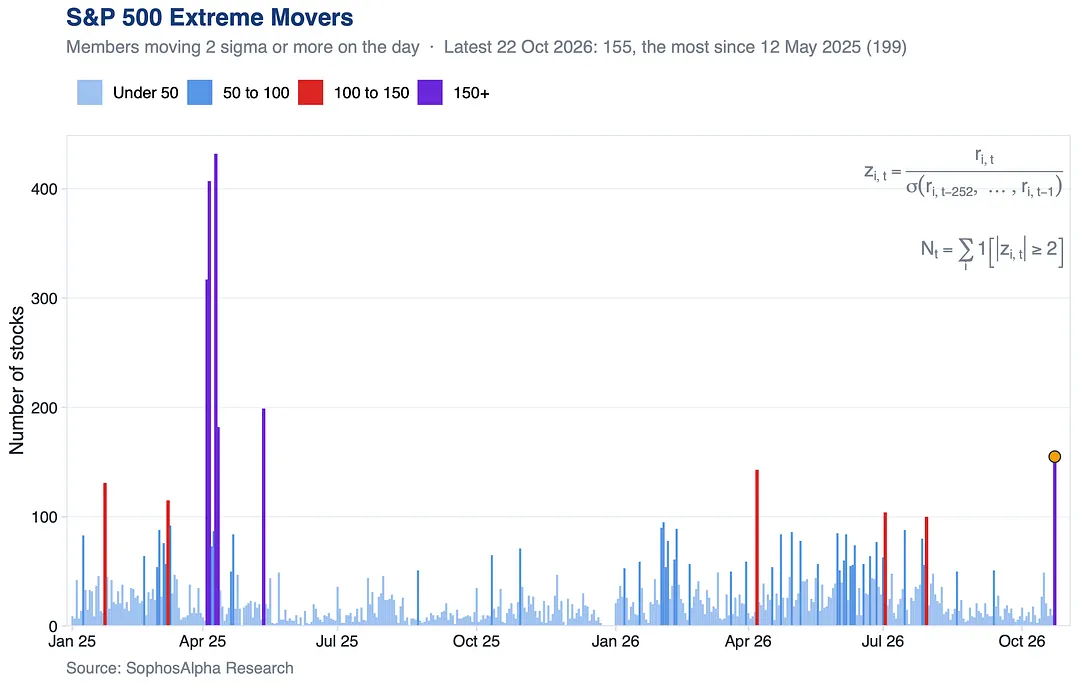
That is not a first.
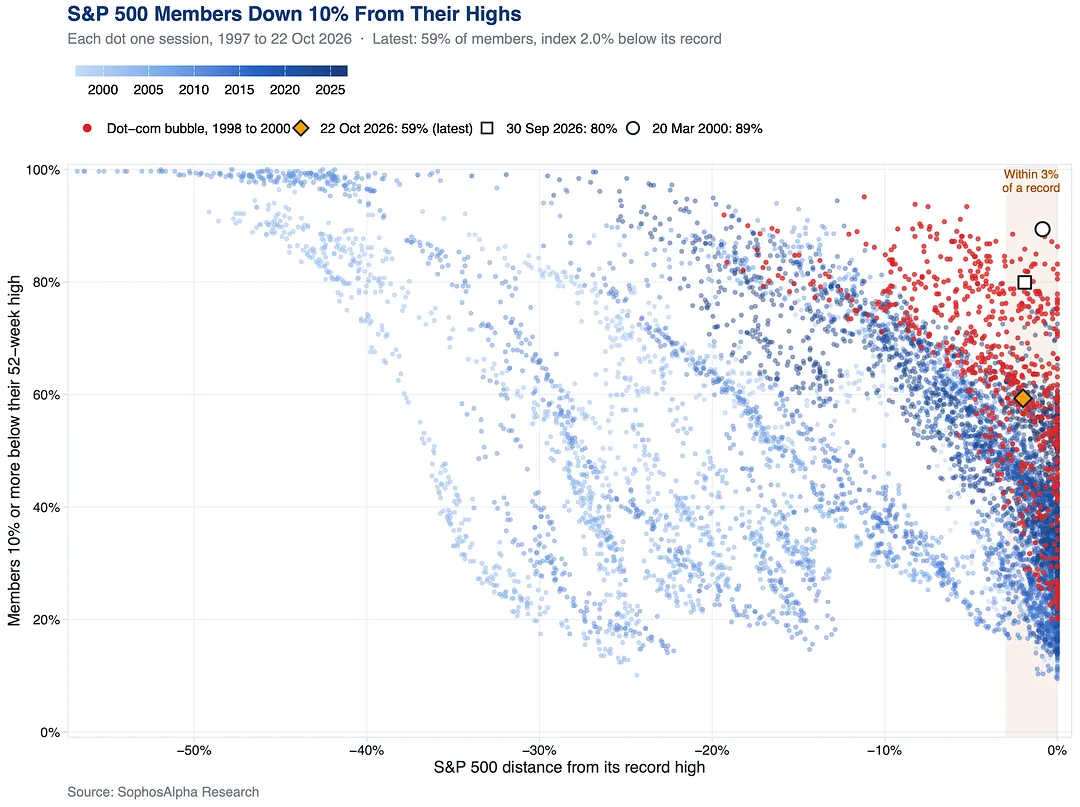
On 30 Sep it was about 80%, with the index just as close to its record. The dot com bubble ran higher still.
Two of those big days were gains of about 1%. Two were losses of 2.5% or more. The selling days are the heavier ones.
4 notes
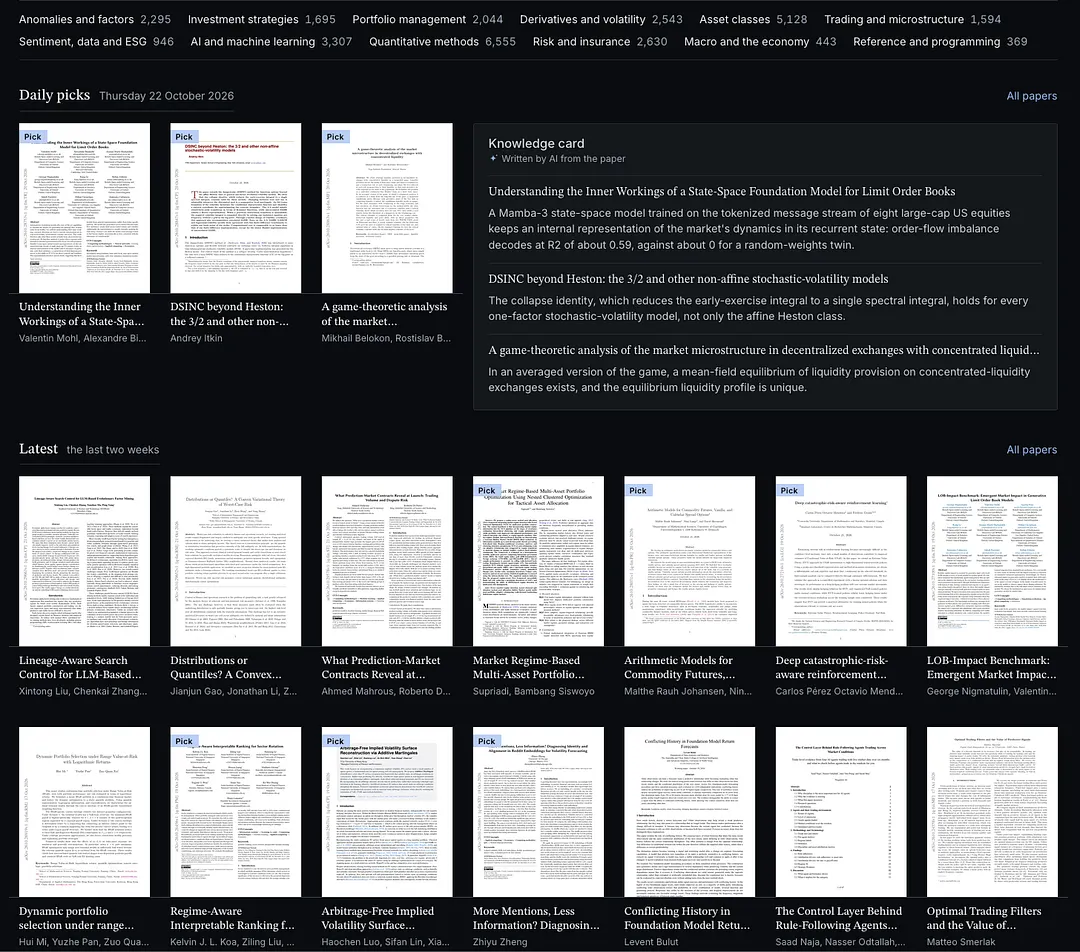
Every day we add new research as it comes out and pick 3 papers worth your time.
Today: what an AI trained on order book data actually learns, American option pricing beyond Heston, and the volatility at which providing liquidity on DeFi exchanges stops paying.
No login, no paywall.
Get notified when it’s live: https://sophosalpha.substack.com/subscribe
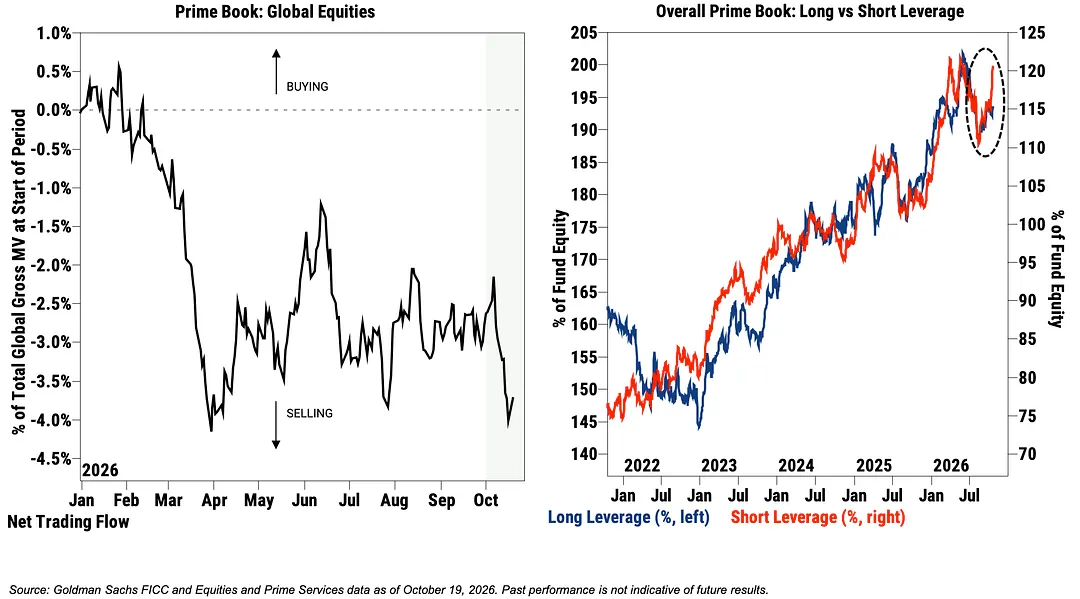
Net allocation to Global AI stocks now sits in the 38th percentile while aggregate long/short ratio is in the 6 th percentile vs. the past year.
Overall Long leverage now sits in the 73 rd percentile vs. the past year (94 th percentile 5-year), while Short leverage has risen sharply and is approaching 5-year highs in the 99 th percentile.
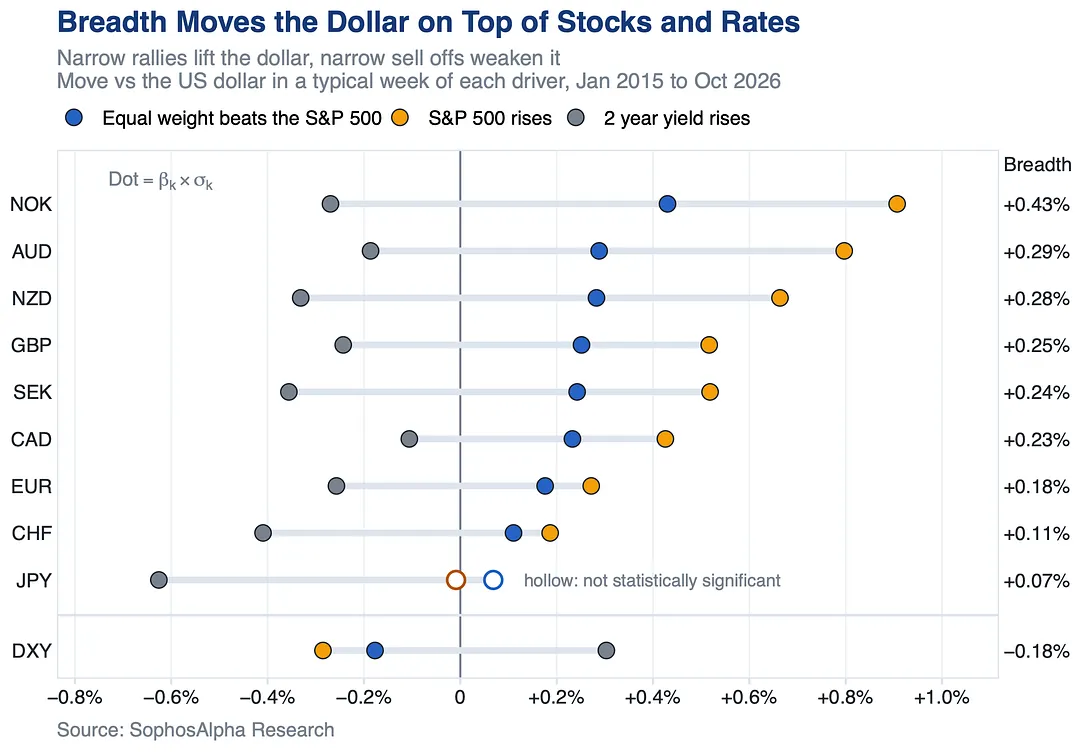
When equal weight beats the S&P 500, the dollar weakens on top of what stocks and rates do. NOK, AUD and NZD react the most. The yen barely reacts and trades on US 2 year yields.
A broader rally takes that support away.
6 notes
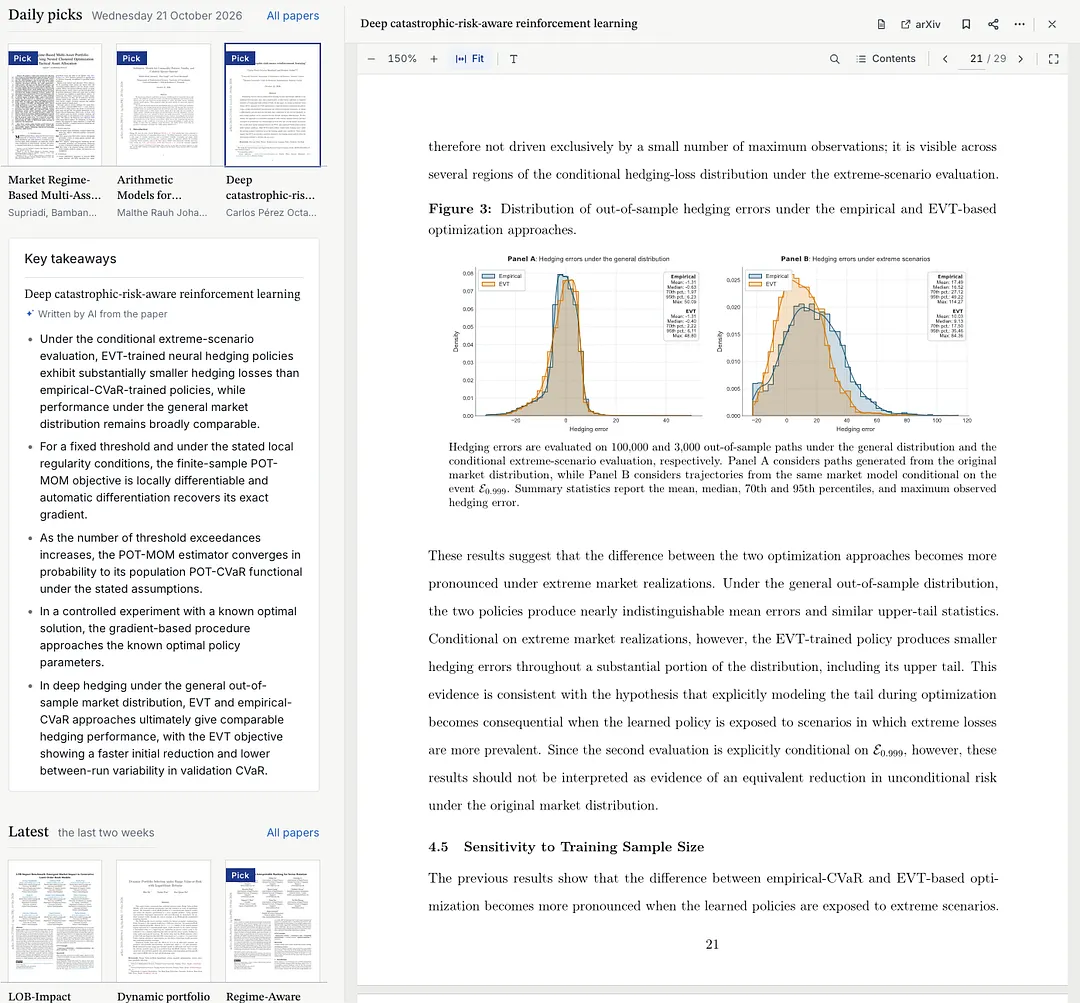
An AI trained to protect against rare disasters held up better in them when it estimated how bad things can get, rather than learning only from the few disasters it had seen.
Today's pick trains a neural network hedger to model that tail with extreme value theory (EVT), tested on simulated markets with rare price jumps.
On 100,000 normal paths, EVT and the standard empirical approach hedge almost identically.
On 3,000 paths from the most extreme 0.1% of outcomes, EVT cuts the average hedging error from 17.49 to 10.03 and the worst from 114.27 to 84.36.
Not better everywhere. Better where it counts.
We choose 3 new papers a day in our upcoming free index of 10,000+ papers. Get notified when it’s live: https://sophosalpha.substack.com/subscribe
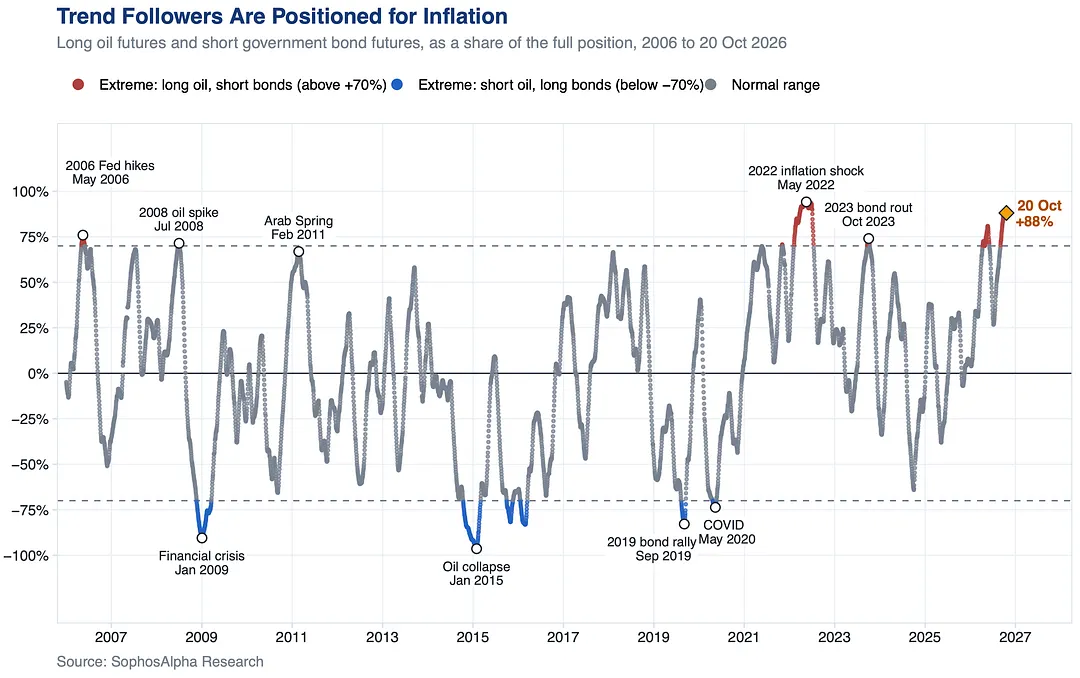
They have been this long oil and this short government bonds only twice in 20 years: the 2022 inflation shock, and now.
Debt worries and sticky inflation are pushing bonds lower, and the unresolved US Iran war is keeping oil supported. If that conflict escalates, this trade has more room to run.
This year most bad Nasdaq days came with rising yields, so bonds fell too.
The AI scares broke that. On DeepSeek and the 8 October OpenAI revenue scare, yields fell with tech, and DeepSeek’s drop beat almost every bad day of the dotcom unwind.
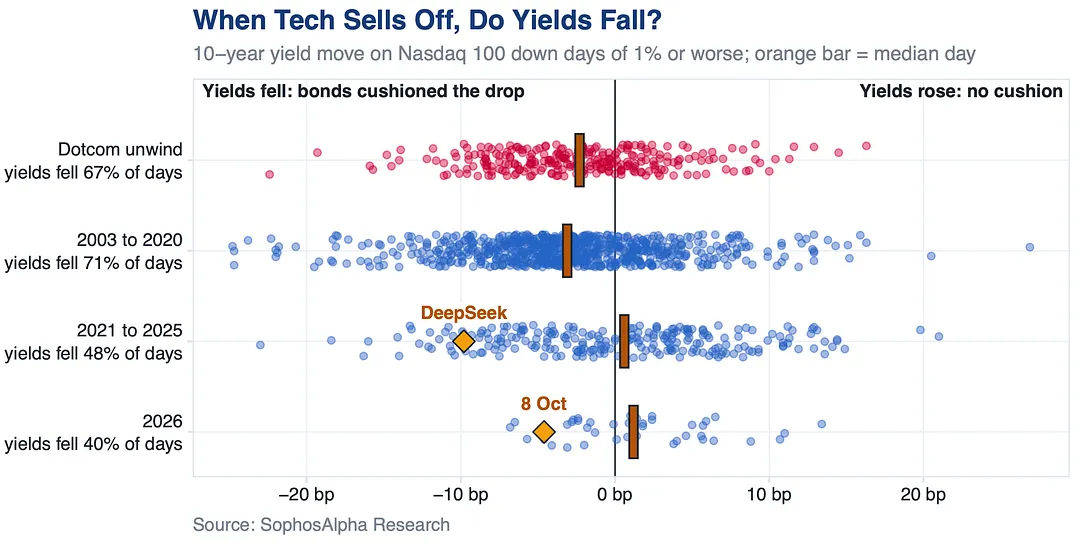
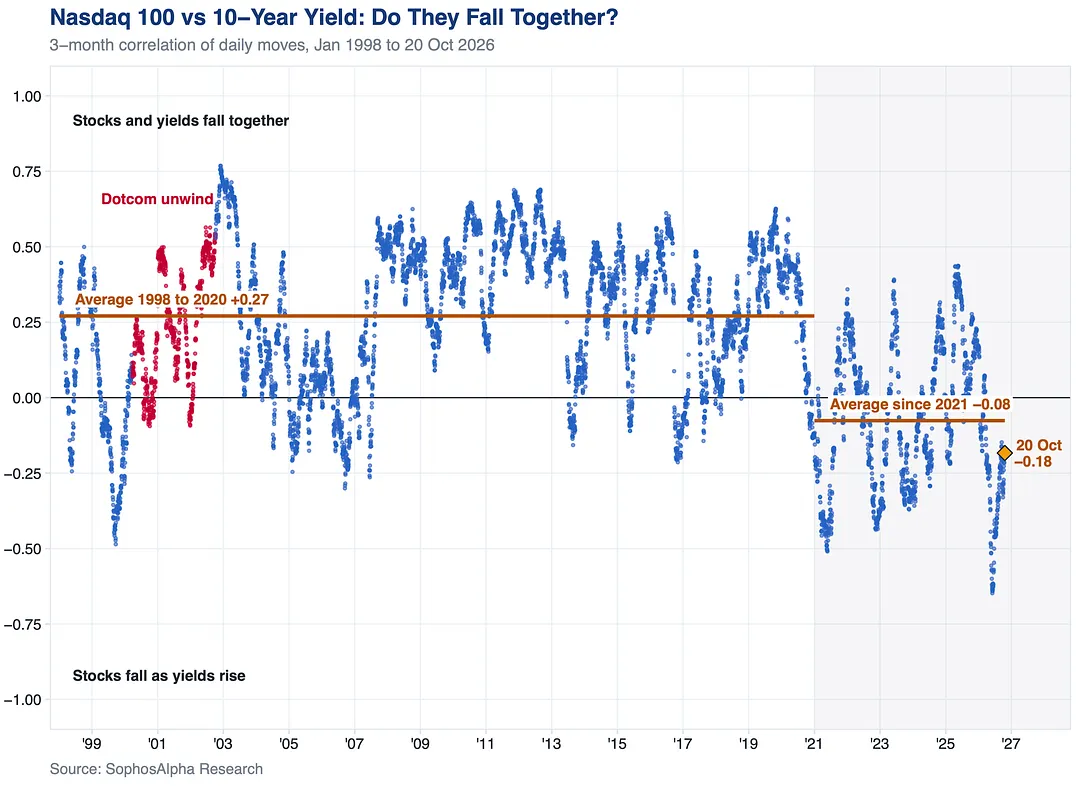
For two decades the answer was mostly yes. When tech sold off, Treasury yields usually fell with it, so bond prices rose and cushioned the drop. The dotcom unwind played out that way.
That broke in 2021. In 2022 the Nasdaq 100 fell by a third while yields climbed, and investors lost on both sides. In June the link hit its weakest since 1994.
It’s been climbing back since, and in the recent AI scares, DeepSeek and 8 October, tech and yields fell together again.
If the AI trade ever unwinds like dotcom, this is the chart to watch.
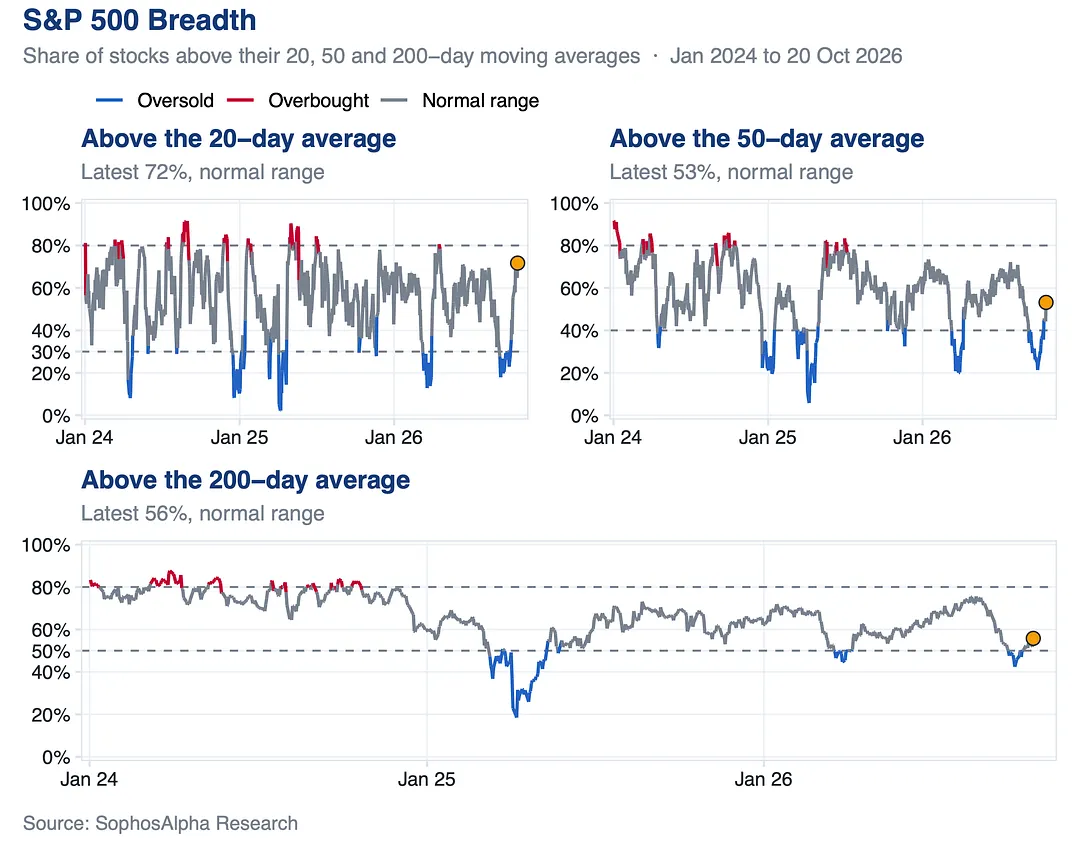
To start October all three gauges were oversold at once, like April 2025 and March 2026. All three are back in range.
With volatility rising too, it looks more like rotation than selling.
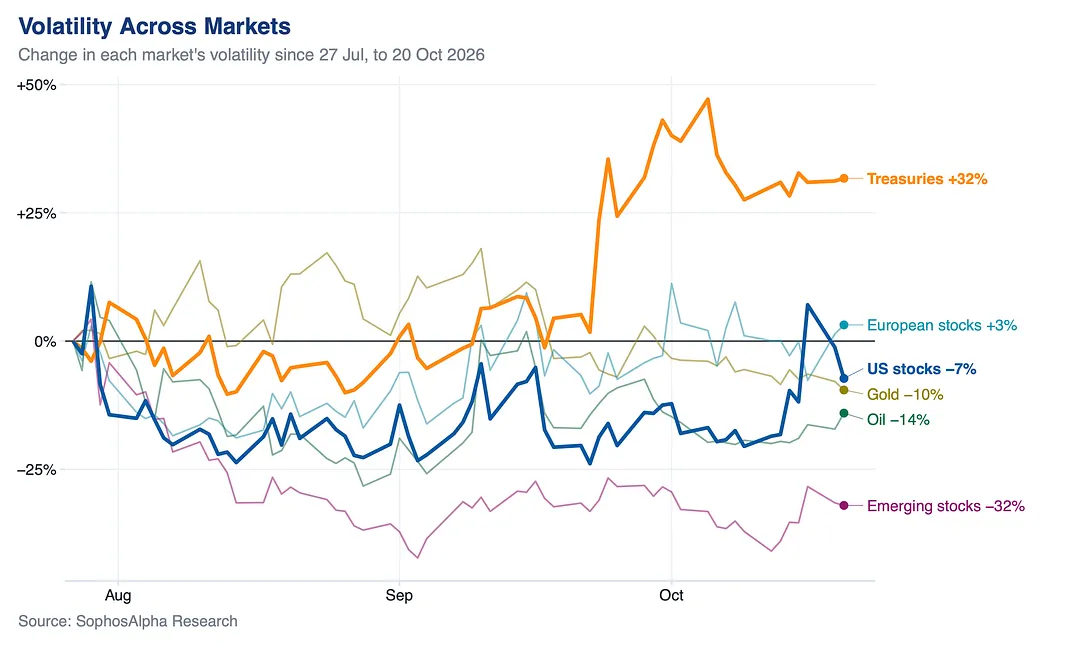
Treasury volatility is up about a third since late July. US stock volatility is below where it started.
7 notes
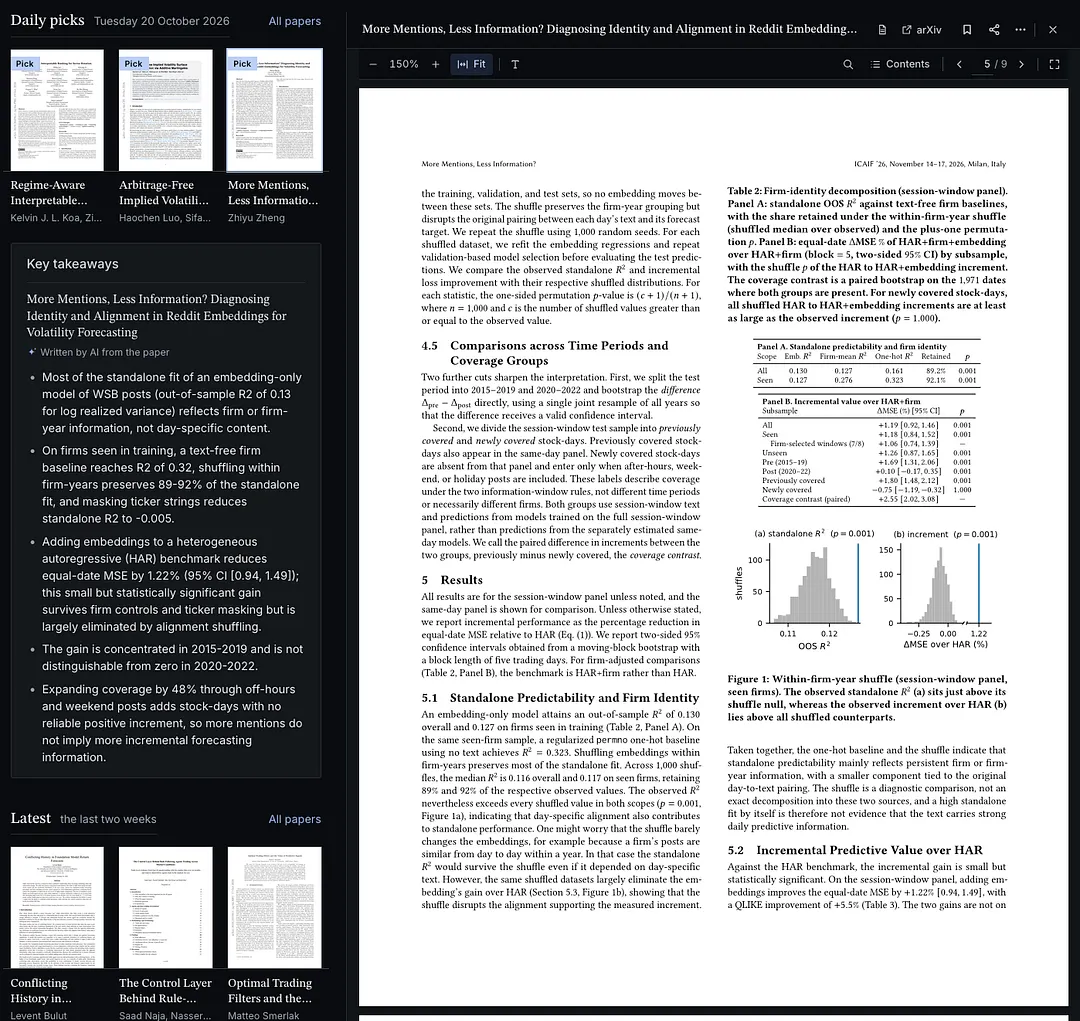
WallStreetBets has been tied to extreme volatility since GameStop. Today's pick from our library finds most of the signal in its posts is just which stock is named.
We choose 3 new papers a day in our upcoming free index of 10,000+ papers. Swap doomscrolling for research by people who study markets.
Get notified when it’s live: https://sophosalpha.substack.com/subscribe
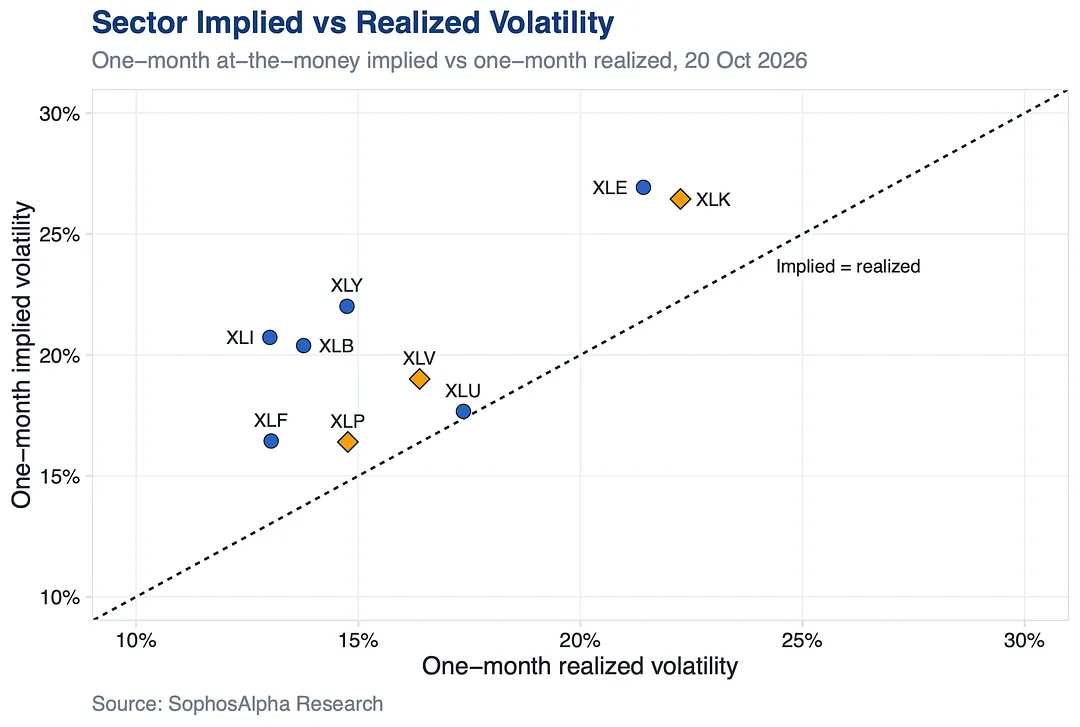
Staples and health care options price barely above what those sectors actually move, among the cheapest in the S&P 500. Tech options carry a bigger premium.
If the defensive rush reverses, that is the cheap place to hedge.
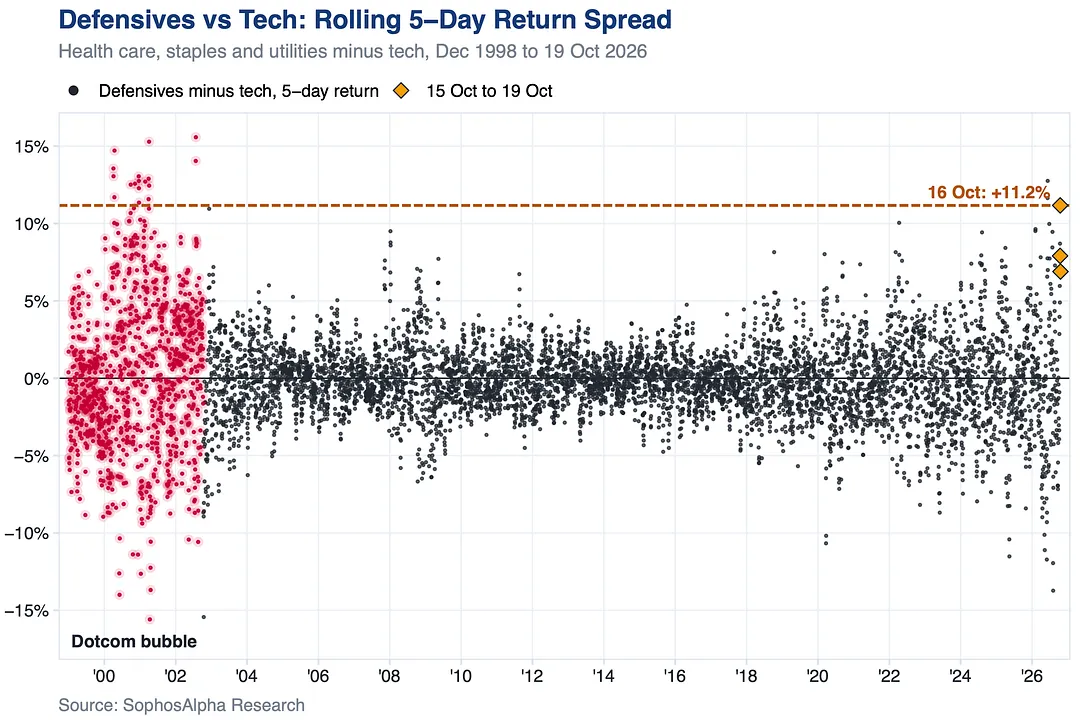
Last week health care, staples and utilities beat tech by a margin seen only a handful of times since 1998.
The S&P 500 isn't breaking, it's rotating.
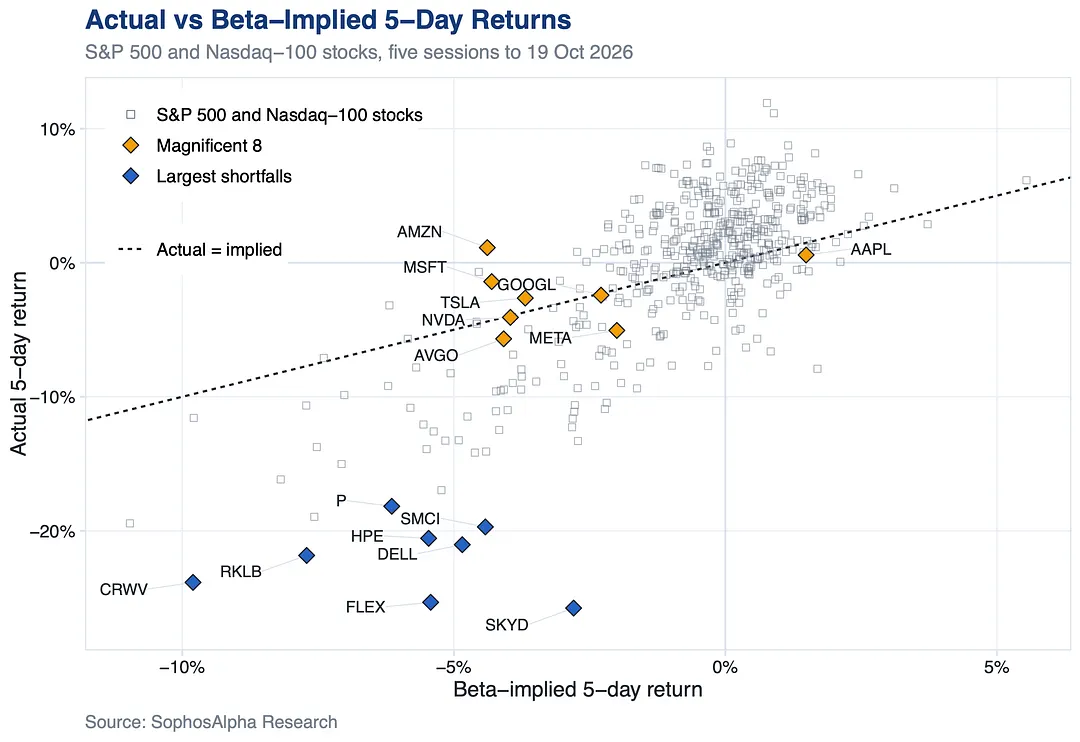
It hit the high beta fringe.
The Mag 8 landed almost exactly where their beta implied. The 8 worst, CRWV, SMCI, DELL and RKLB among them, fell 18% to 26%, about 16 points worse.
A positioning flush, not a crack in the AI core.
The market now wants proof that AI spending pays. Meta reports tomorrow, and the biggest spenders are still on track for vast outlays this year.
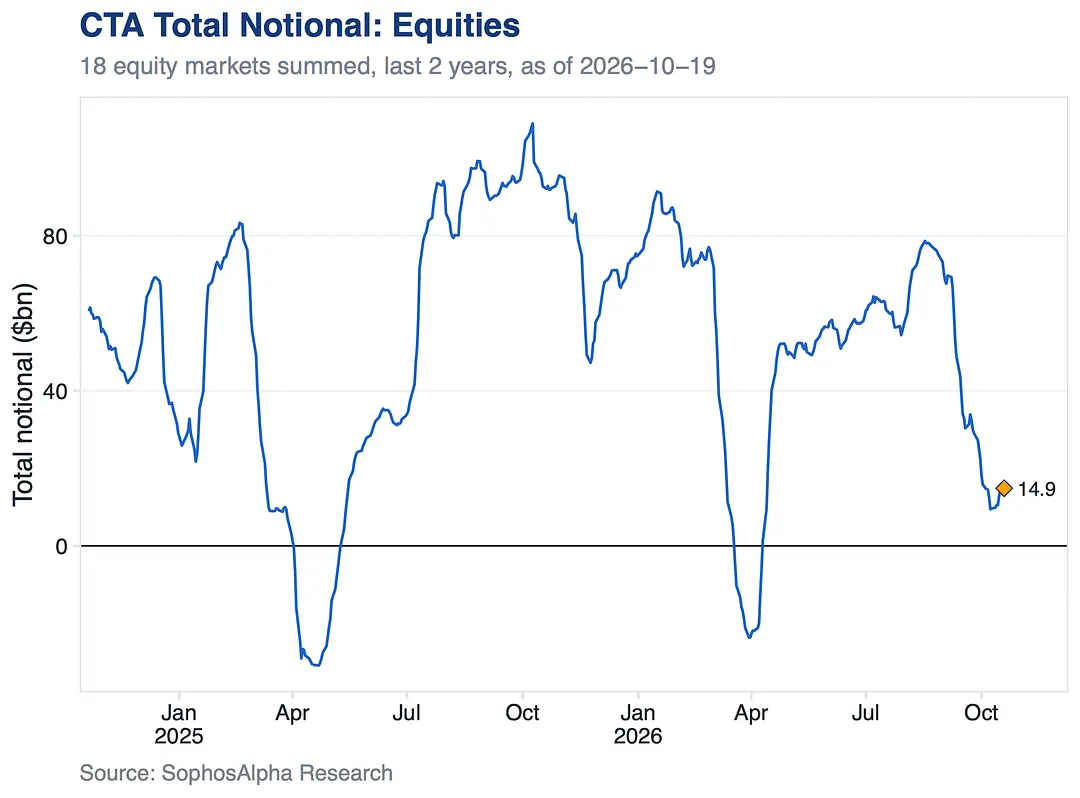
Since August they unwound most of their Europe and Asia longs, and several markets flipped short. US large caps now carry most of it.
If these funds return as buyers, the room to buy back sits outside the US.
5 notes
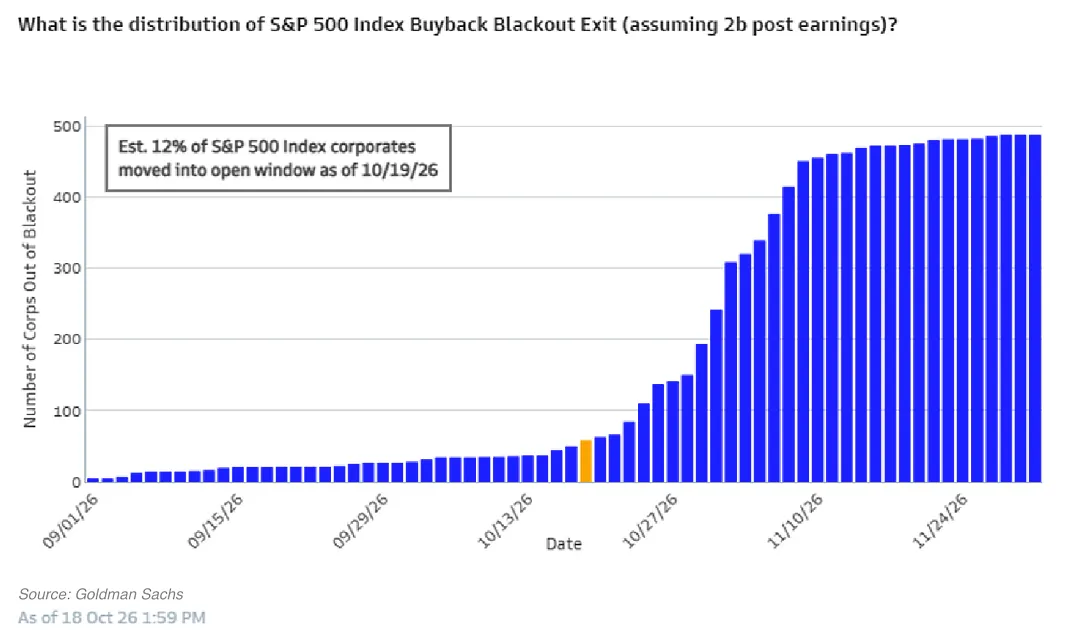
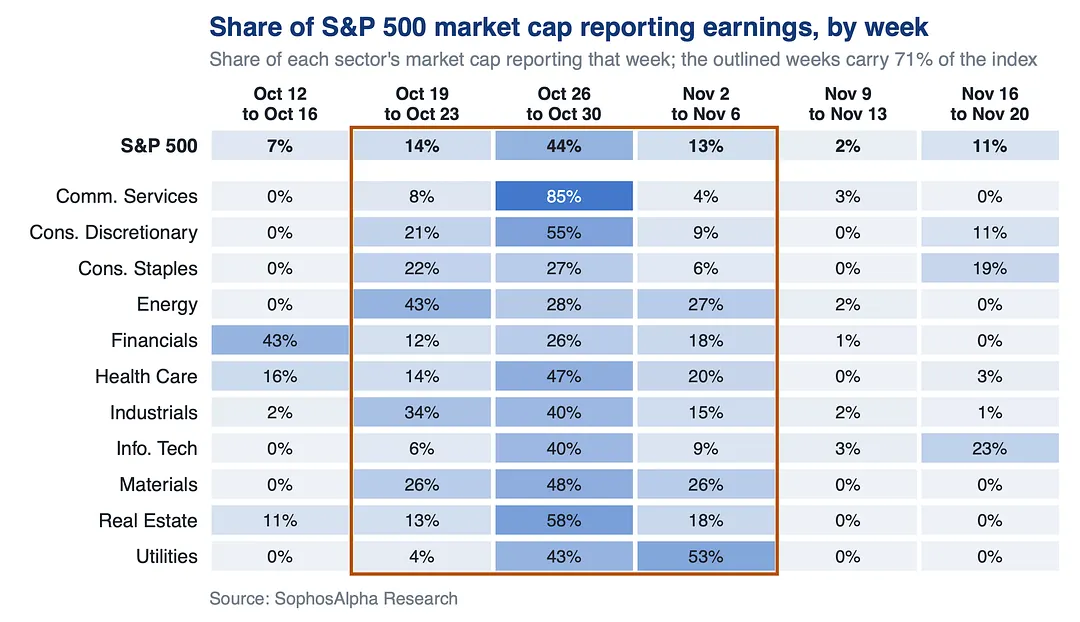
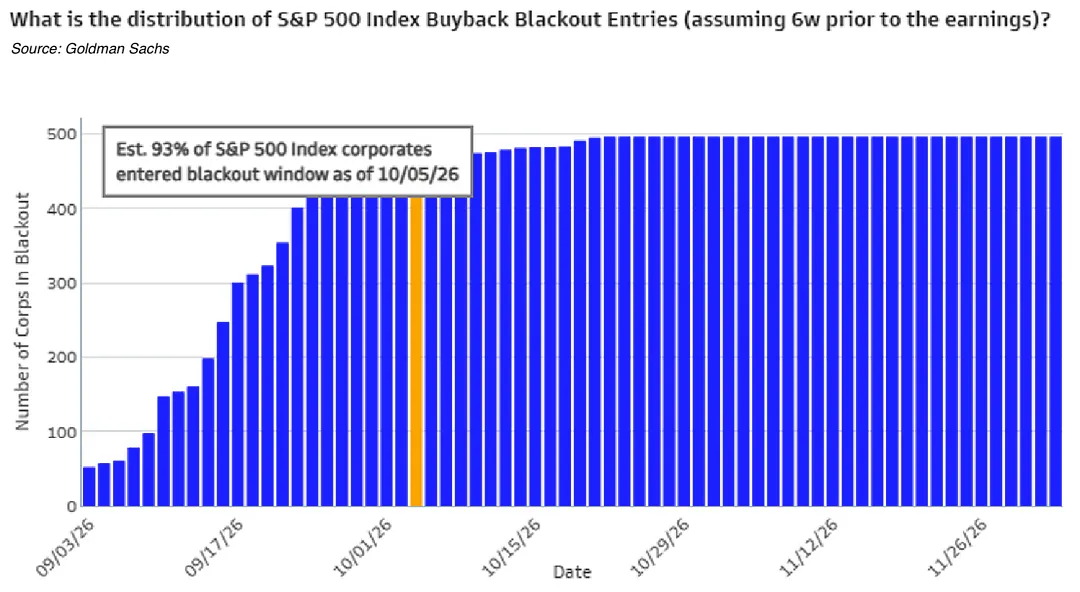
About 1 in 8 S&P 500 companies is out of its buyback blackout. With earnings packed into late October, that climbs to nearly all by mid November.
Flows have run light, mostly preset plans. Discretionary buying should follow as windows open.
The performance environment has been extremely challenging. Both fundamental and systematic managers lost money last week while global equities went broadly nowhere.
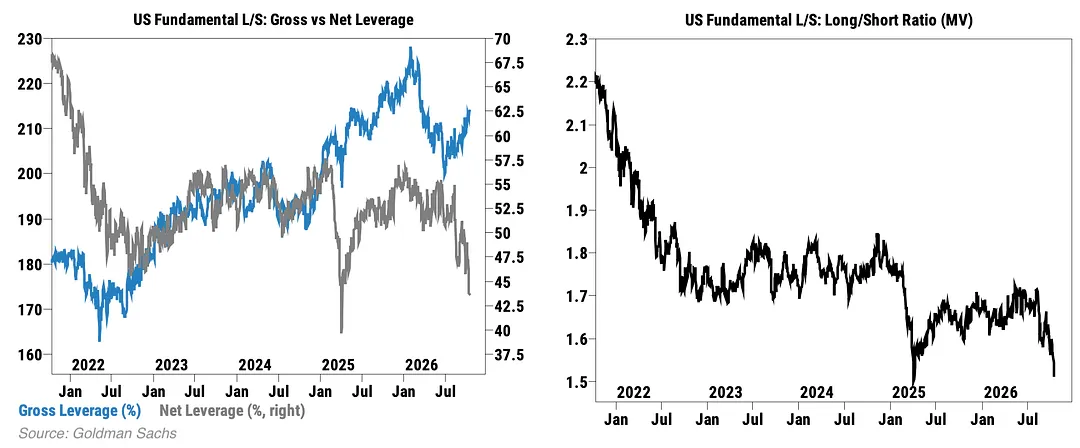
The pressure has been building for weeks. Funds have been adding shorts, selling single stocks at the fastest pace in two months and hiding in defensives. The long/short ratio is back near its Liberation Day low, and they are now reaching for protection through options.
Gross leverage is still elevated, so there is room to cut further. But with net leverage this low, shorts near five year highs and demand for protection accelerating, a lot of caution is already reflected in positioning.
A different volatility regime, but not necessarily a more bearish one.
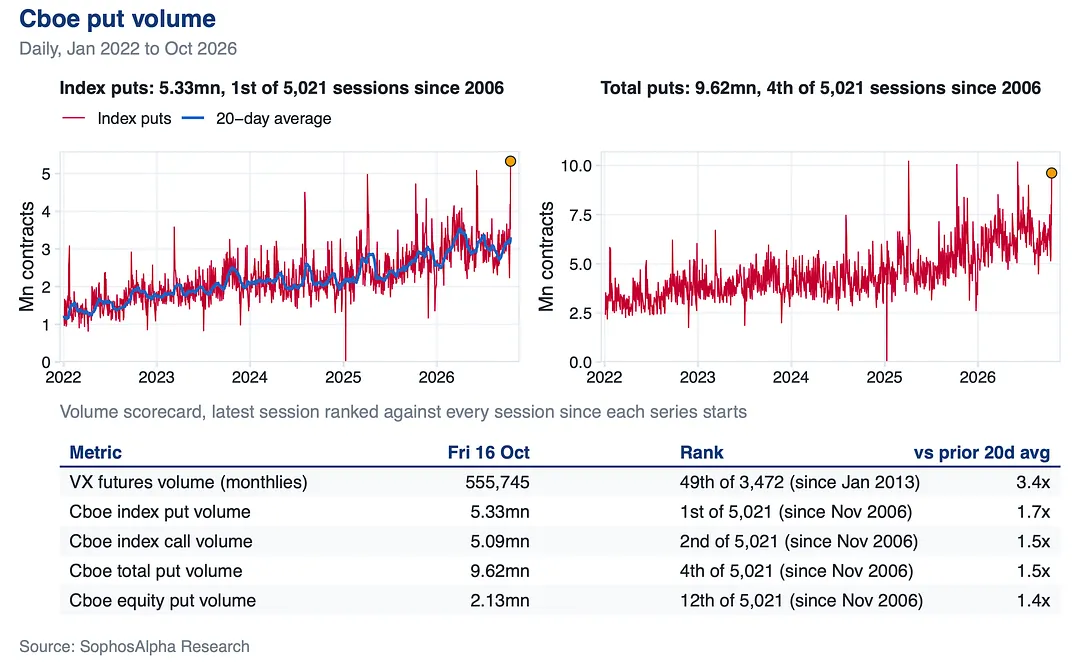
Index puts set a record too, and VIX calls were the busiest since the Friday before VIX spiked above 60 in August 2024.
After weeks of damage in single stocks, investors are finally hedging the index.
Single stocks swung hard all year while the index stayed calm. With less cushion, that calm looks fragile.
Remember, volatility cuts both ways, upside included.
We shared more information in our latest institutional monitor which you can read here: https://sophosalpha.substack.com/p/institutional-monitor-3ad
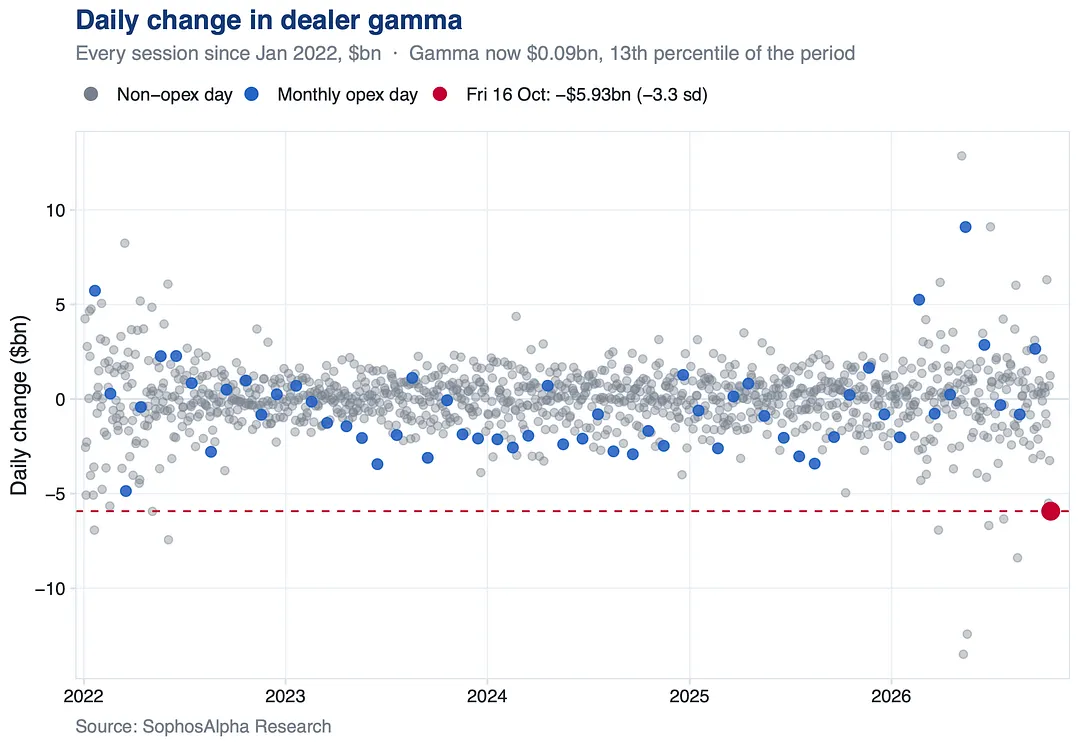
A week earlier it sat near its calmest level of the year
3 notes
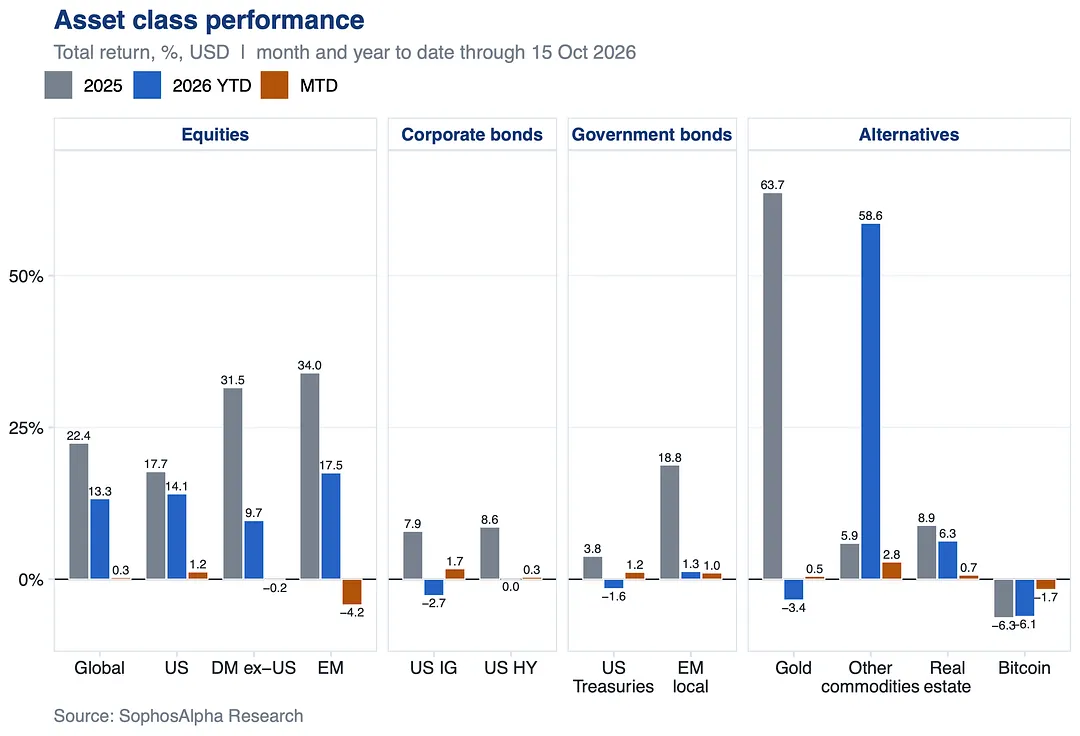
Investors rotated out of AI names into healthcare and staples.
Korea led Asia lower with a double digit fall. Safe haven demand lifted government bonds, and Europe held up.
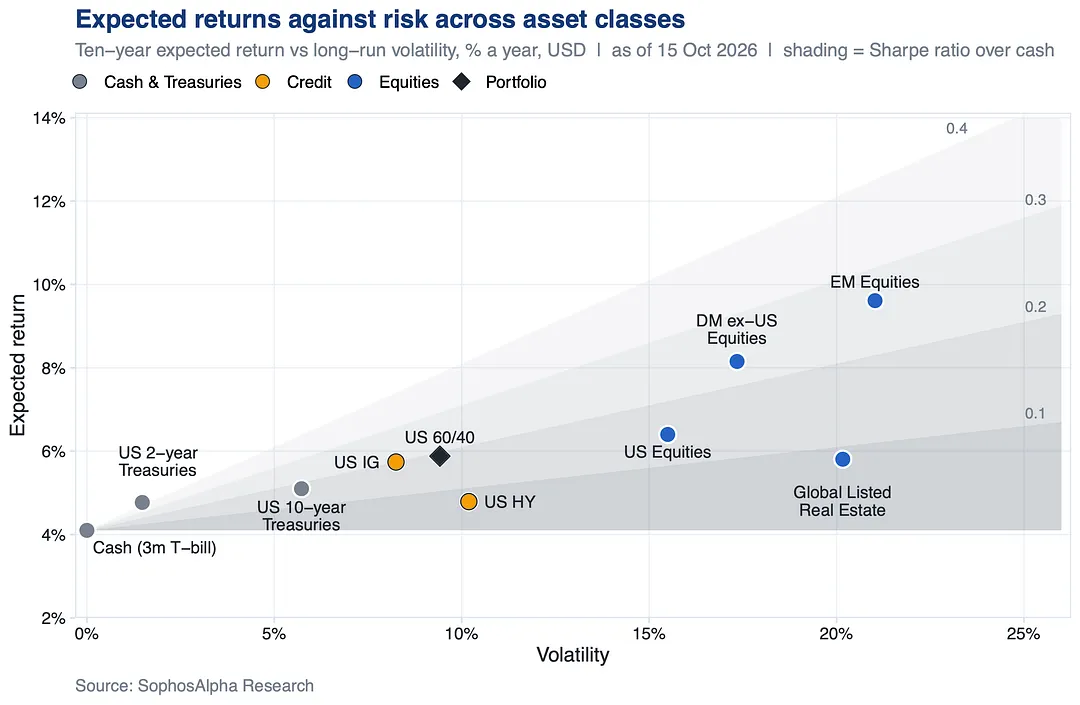
The expected returns point to rotating toward international and emerging market stocks, where valuations are cheaper and investors get paid more for the risk.
Then on Friday afternoon it flinched all at once.
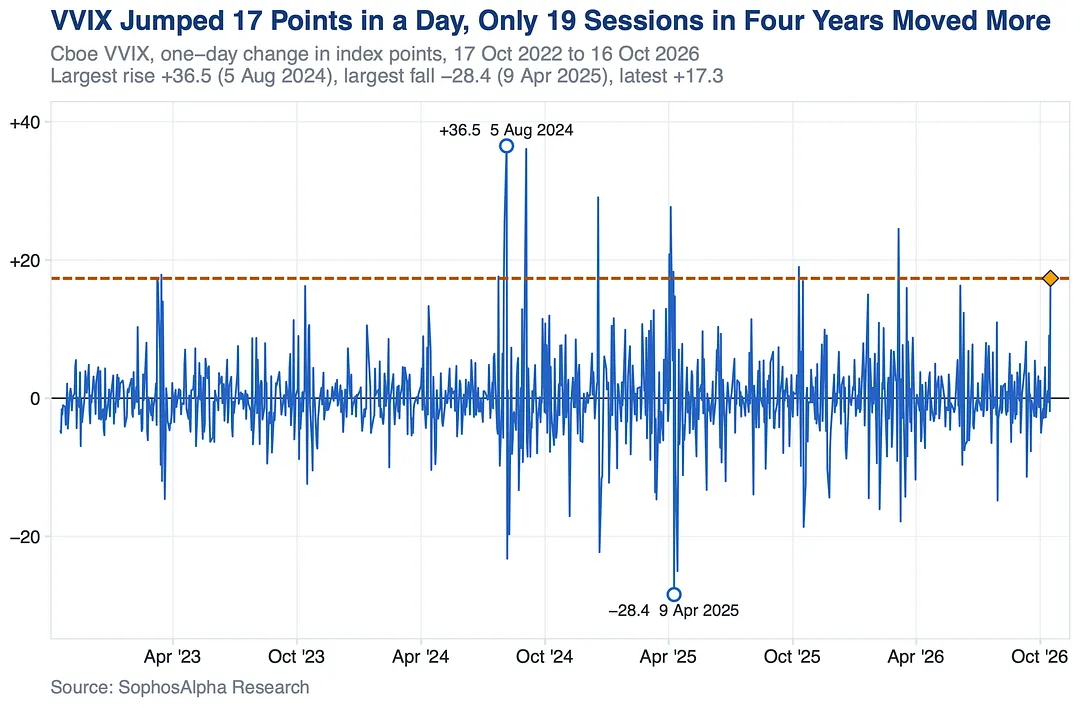
VVIX, which measures how hard VIX itself is expected to swing, had one of its biggest one day jumps in four years. VIX closed at its highest since July.
one note
5 notes
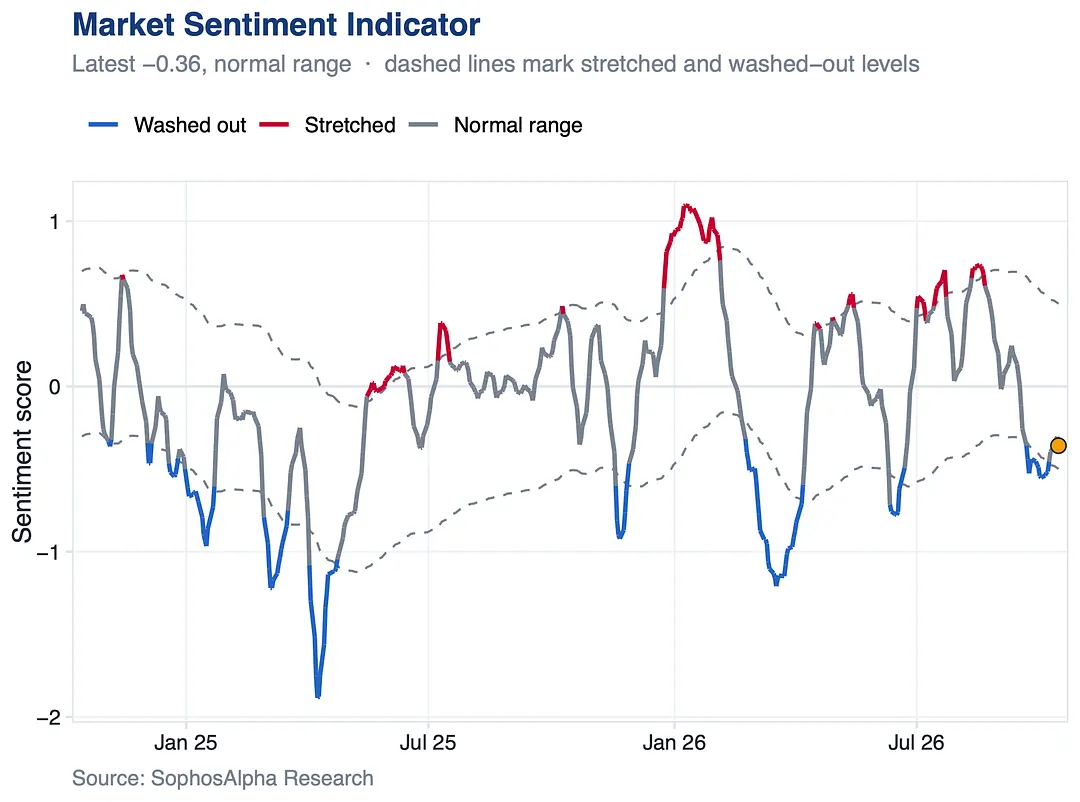
Market sentiment slid from stretched in August to washed out into early October, and S&P 500 futures positioning is still running light.
The summer froth is gone and sentiment has reset.
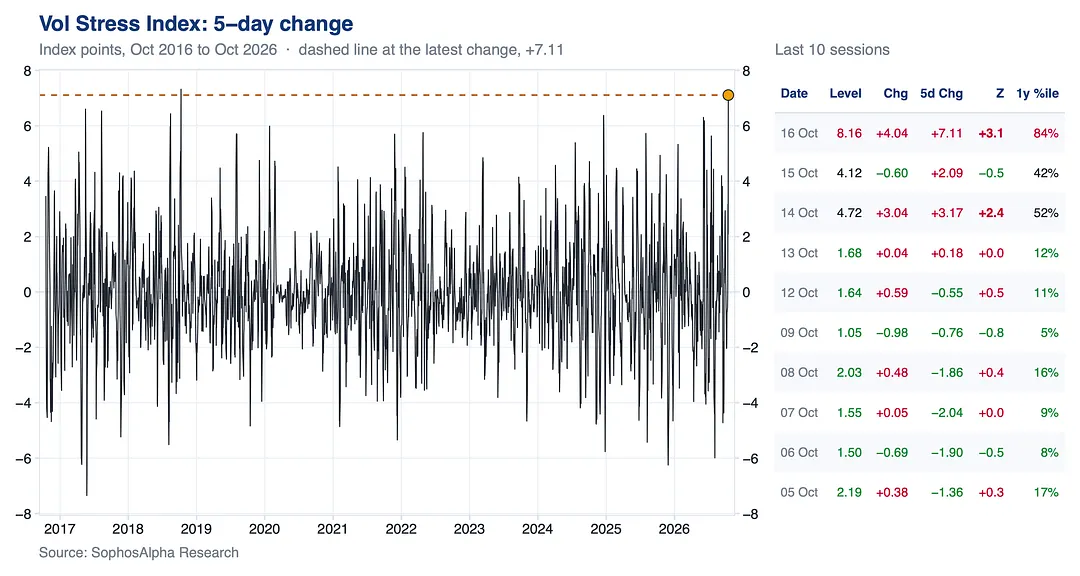
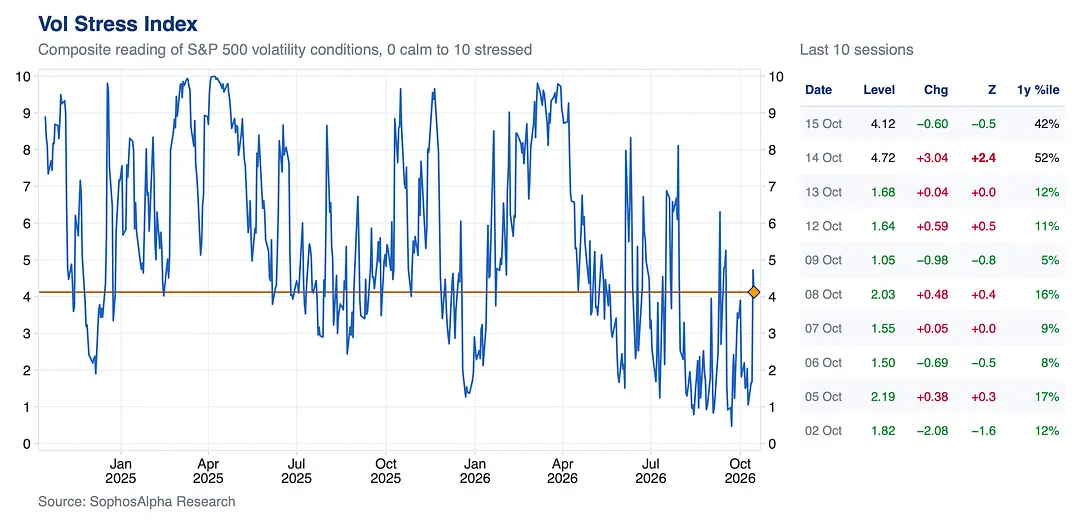
It has already eased to 4.1, below its one year median. Real stress reads 9 to 10, last seen in April.
One outlier session, not a stress regime (yet).
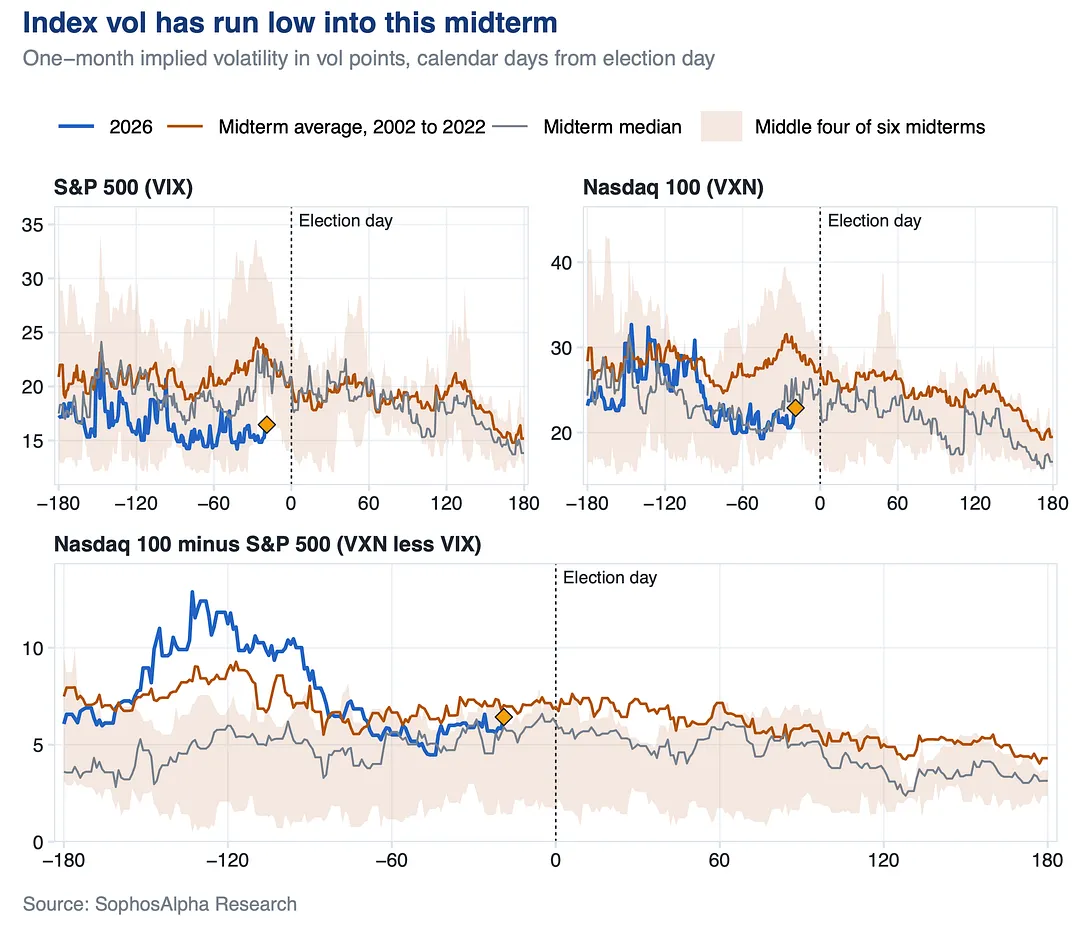
The vote usually brings a quick vol crush, and S&P 500 vol already sits below where past midterms settled after it.
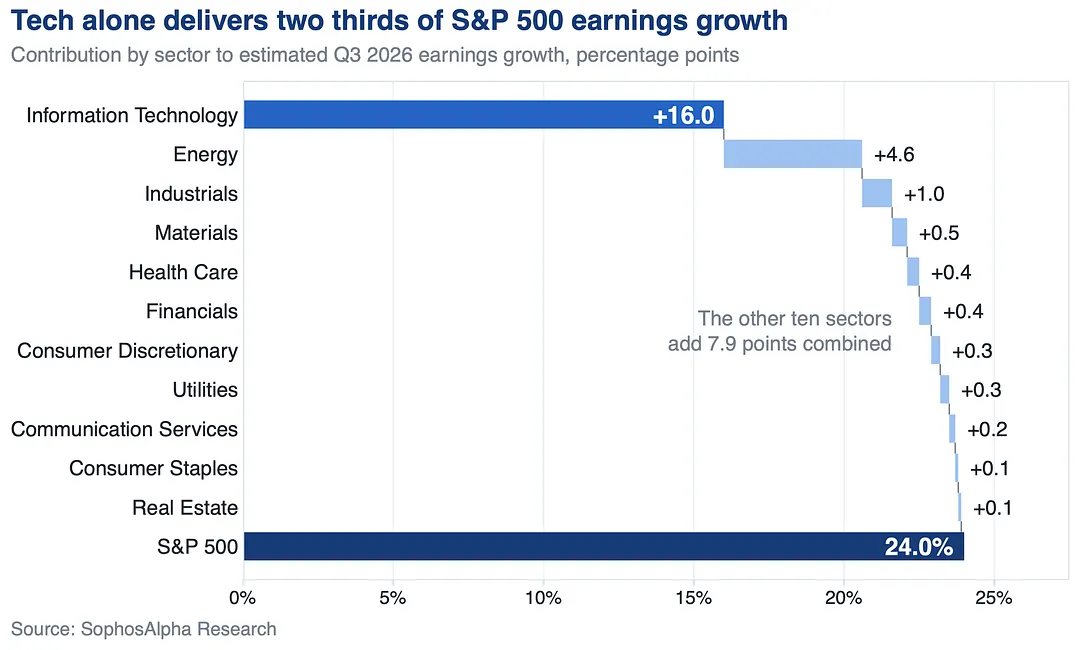
The headline looks demanding, but strip out two chip names and the bar sits far lower. The typical stock only needs modest growth.
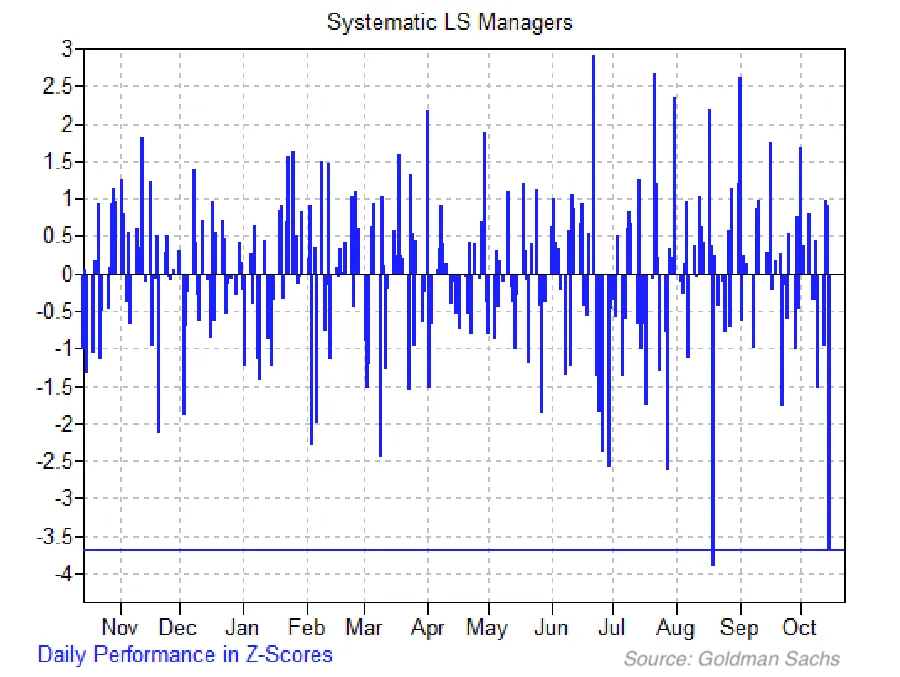
It has now happened 3 times in 2026, the latest on Thursday.
Fundamental, systematic and multi strat were all down close to 1%, led by momentum and crowding.
6 notes
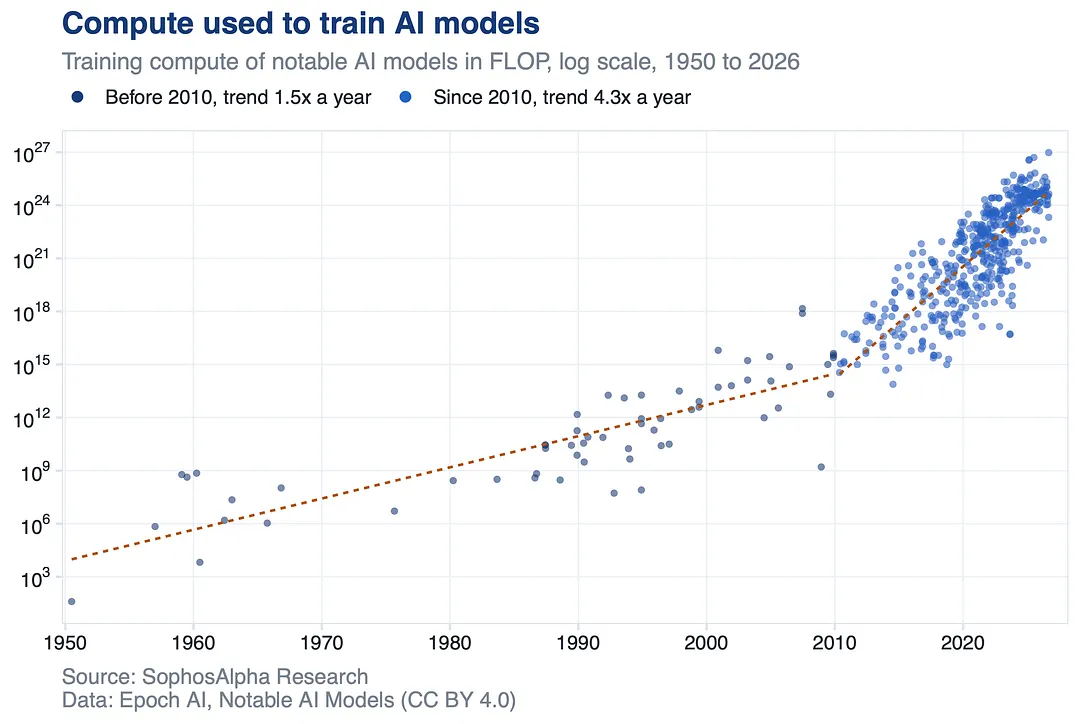
Since 2010 it has grown 4.3x a year.
Across 25 orders of magnitude, more compute has meant more capable models. That is a trend, not a law, and the industry is betting trillions it holds.
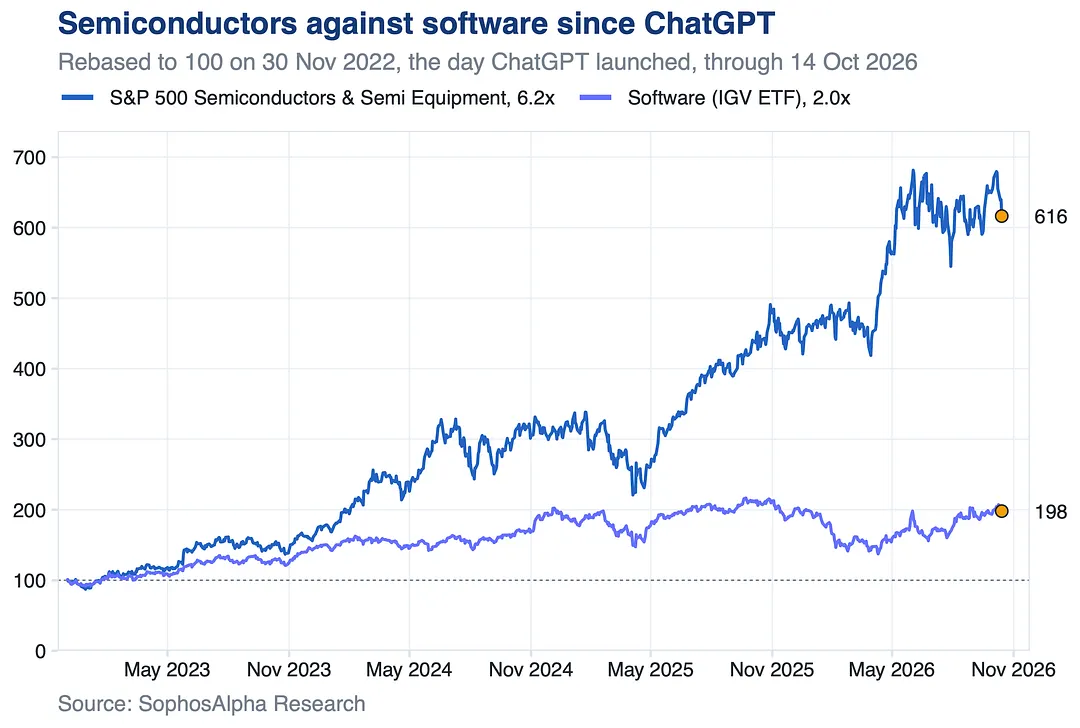
Software is up 2x.
AI is sorting firms into adopters and casualties, with little in between.
When outcomes split that hard, owning more names does not average the risk away. It just owns more of it.
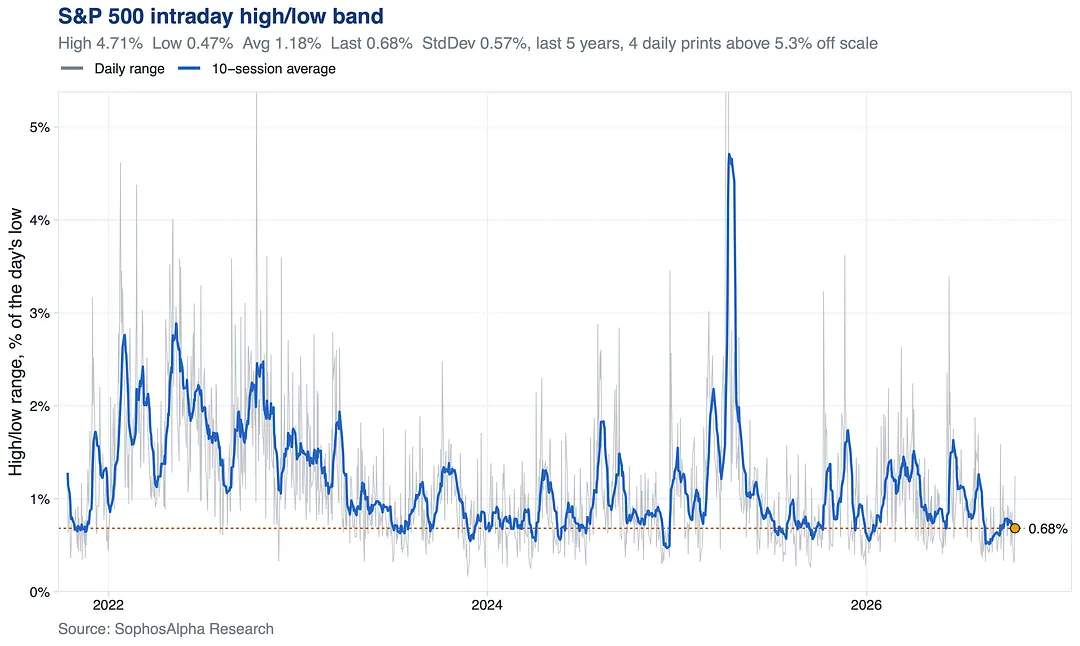
The S&P 500 average intraday range over the last 10 sessions is 0.68%, lower than 89% of the past five years and well under the 1.18% five year average.
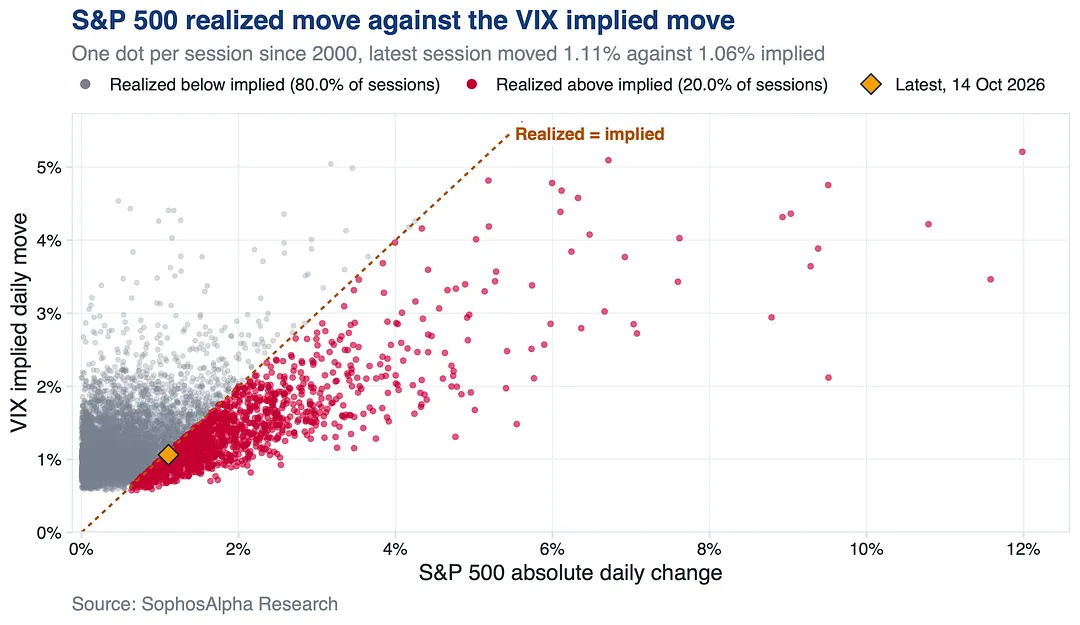
Just over the line.
Normal for a 1% down day: 62% of them since 2000 beat the VIX implied move. In 2026 only 28 of 197 sessions did, 14% vs 20% long run. Options have overpriced moves all year.
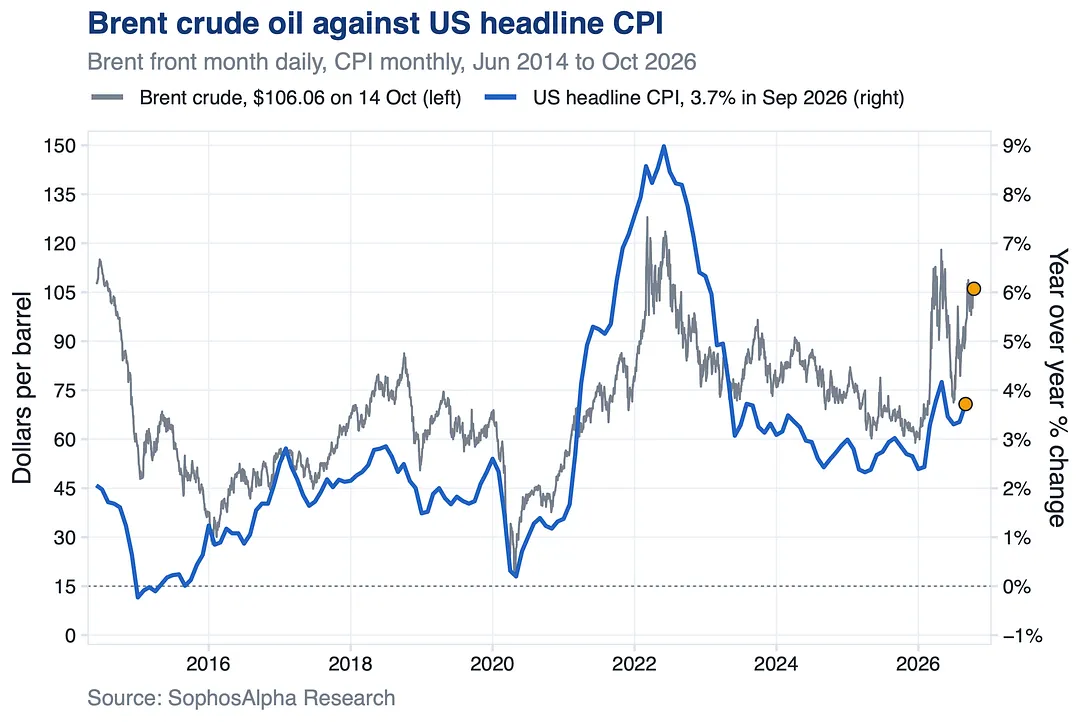
US CPI was running above 8% then. It is under 4% now.
Same oil, less than half the inflation. That spread is what to watch from here.
Why diesel matters for it, in our post below.
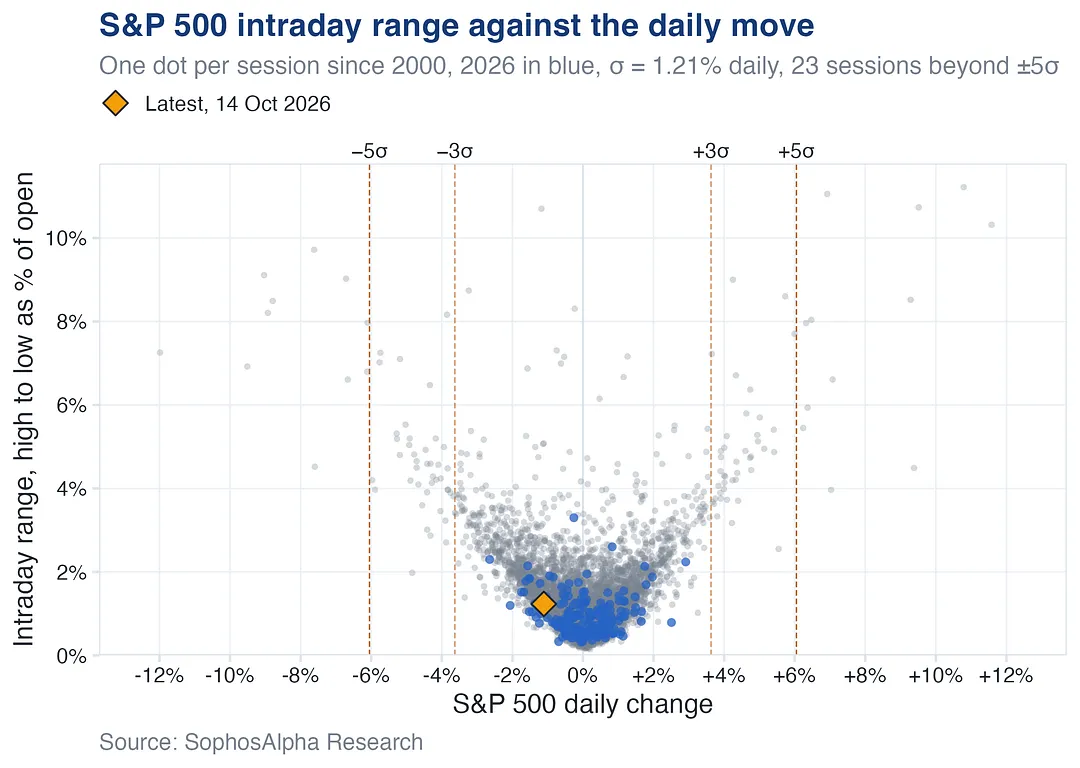
Only 11 runs that long since 2000.
The streak was the outlier, not the drop: under one standard deviation, a 1.23% intraday range, the 19th 1% decline of 2026.
6 notes
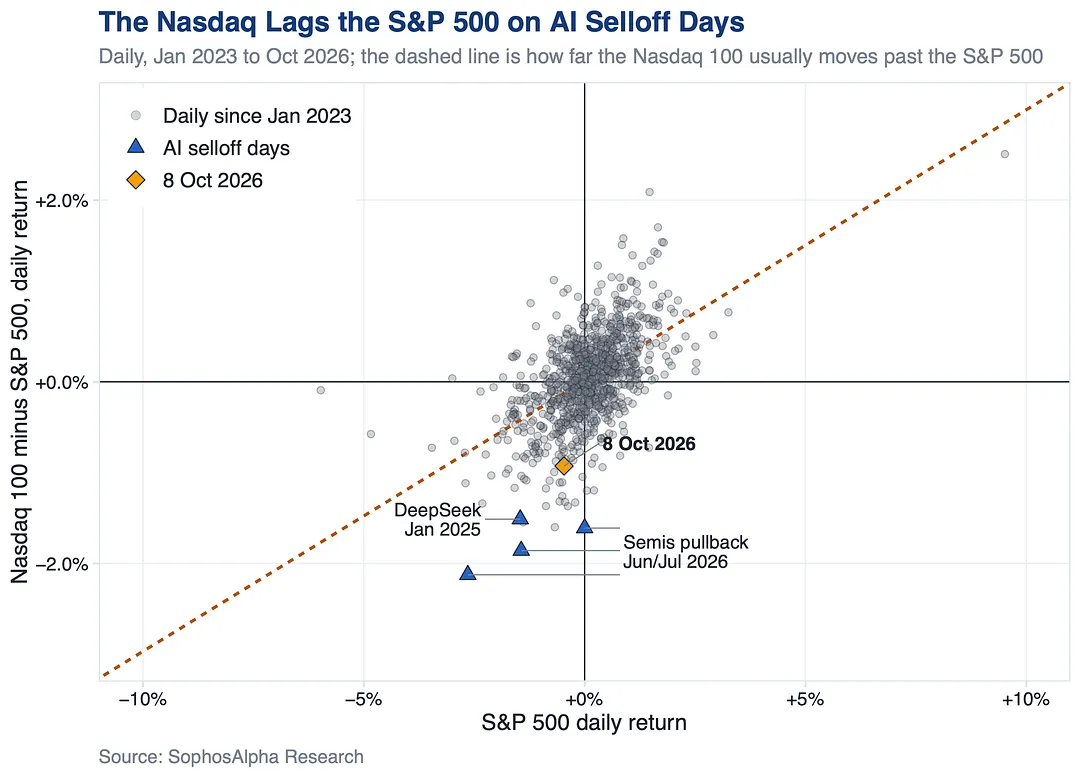
With the Nasdaq near record highs, a weak OpenAI revenue report sent it sliding far more than the S&P 500. DeepSeek and the summer chip rout looked the same.
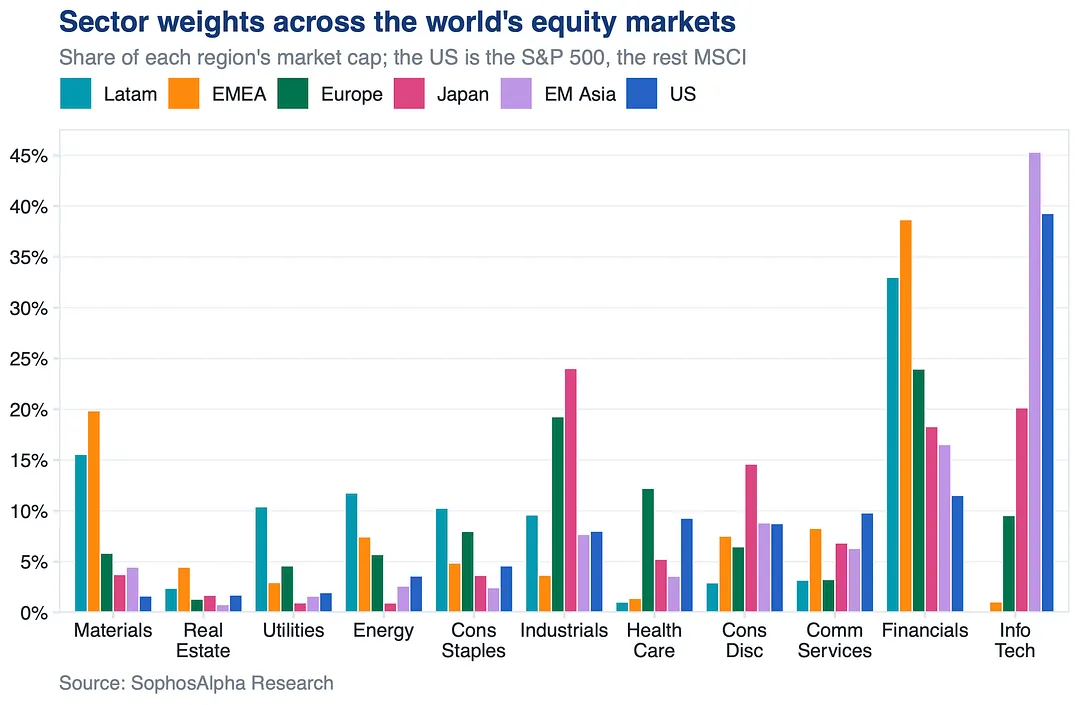
In Europe it trails financials, industrials and health care.
That is why one sector keeps deciding who wins across regions. Tech earnings are still booming, but the worry is now future profitability. The bar elsewhere is lower.
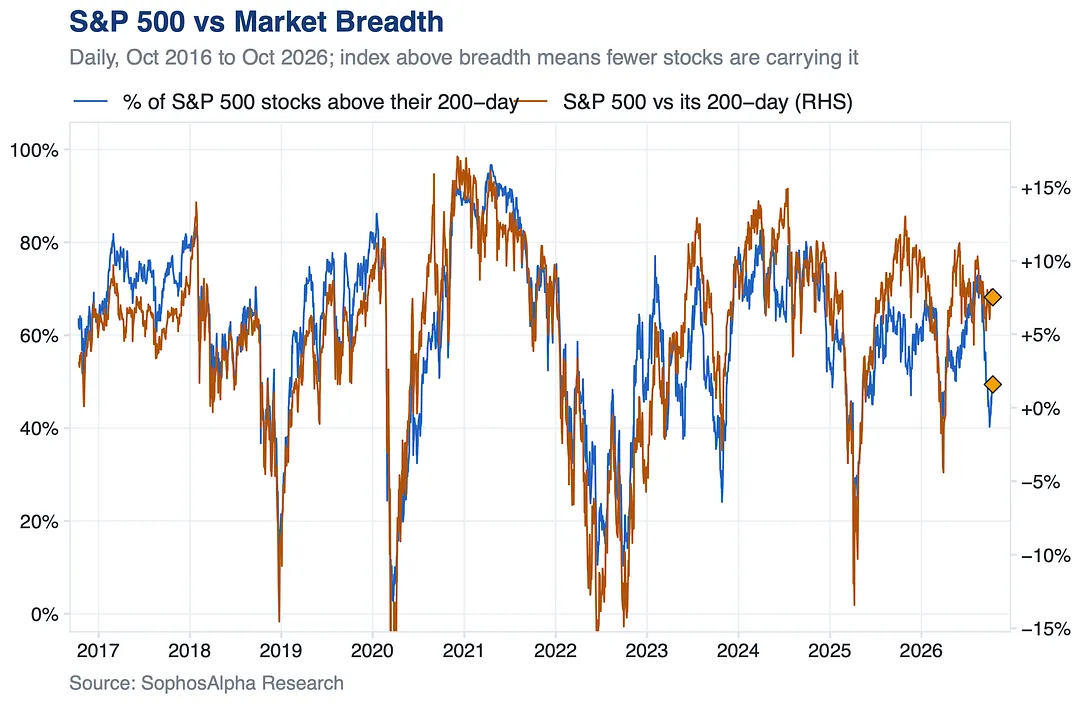
Breadth catches up or the index catches down. Financials, reporting this week, and bond volatility are the tells.
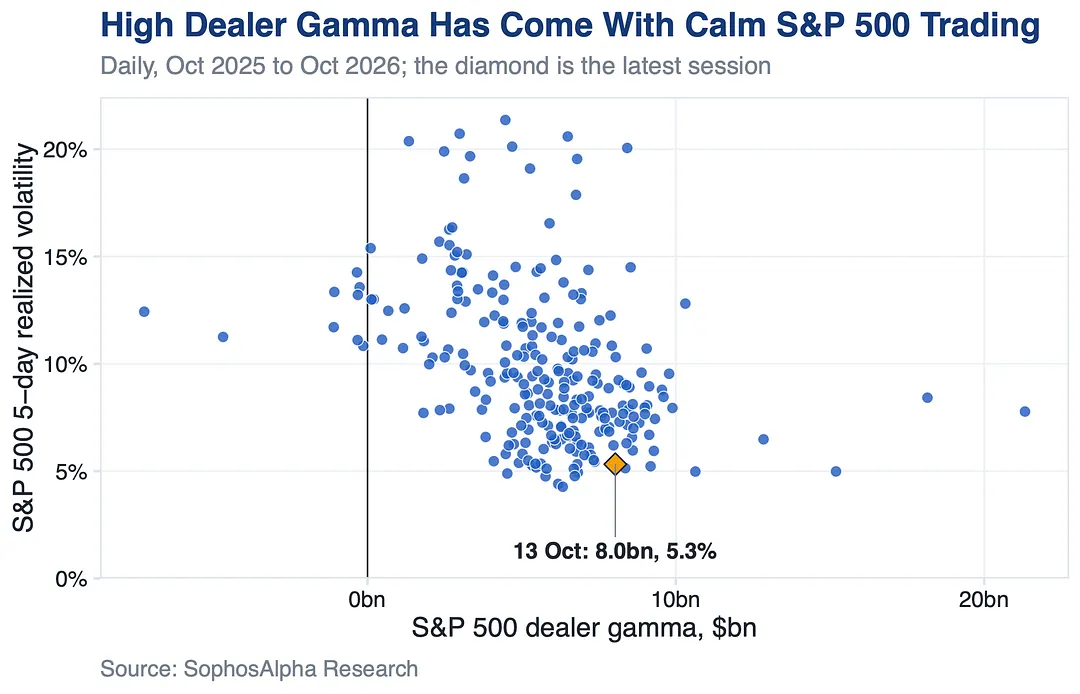
Demand for VIX calls keeps climbing.
Calm like this only lasts so long. One catalyst can thin that cushion fast.
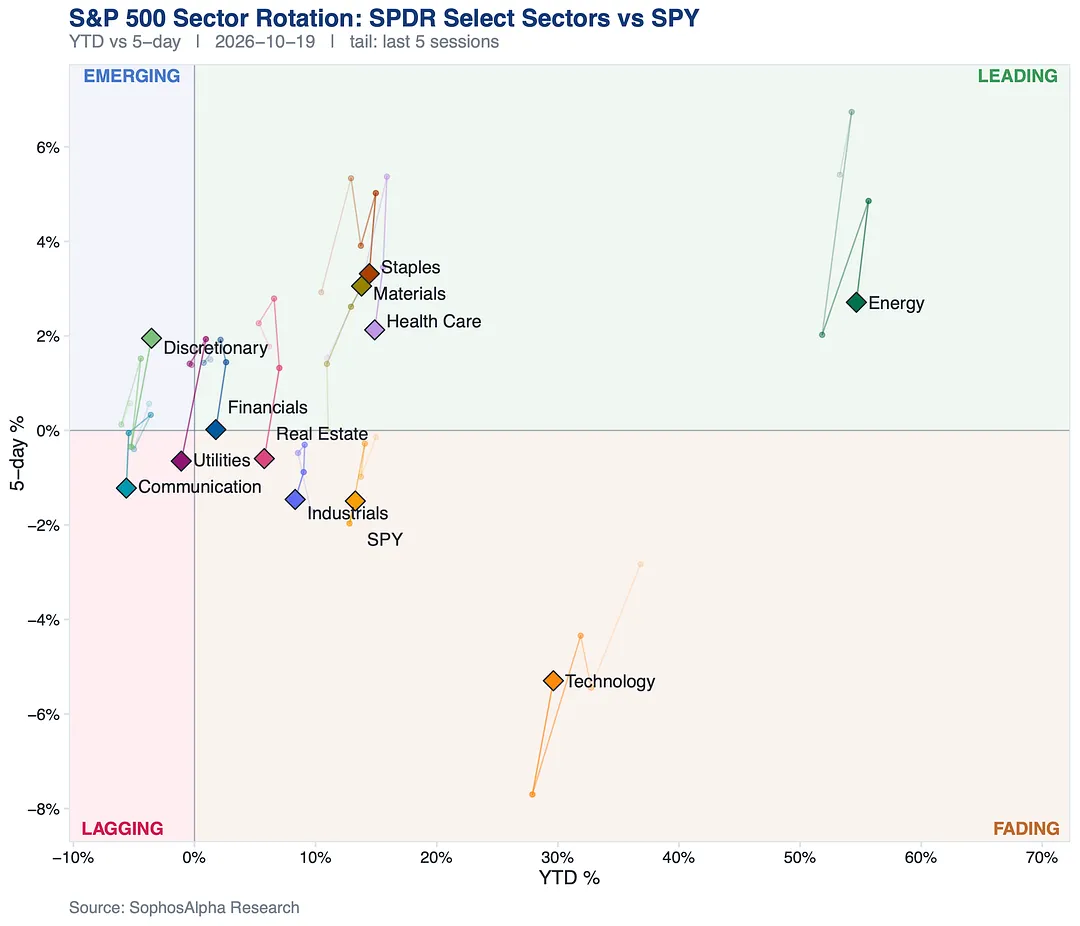
Tech is fading while Energy, Staples and the defensives pick up the slack. Tech positioning is starting to slip from overweight, and most other sectors are still light.
The rotation has room.
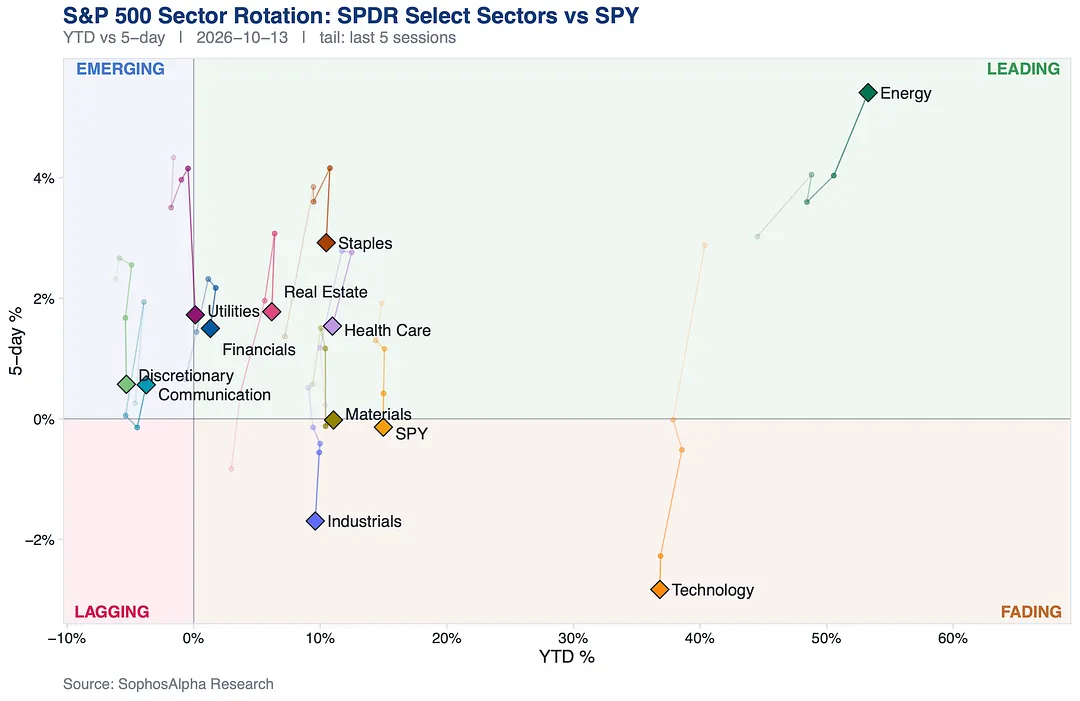
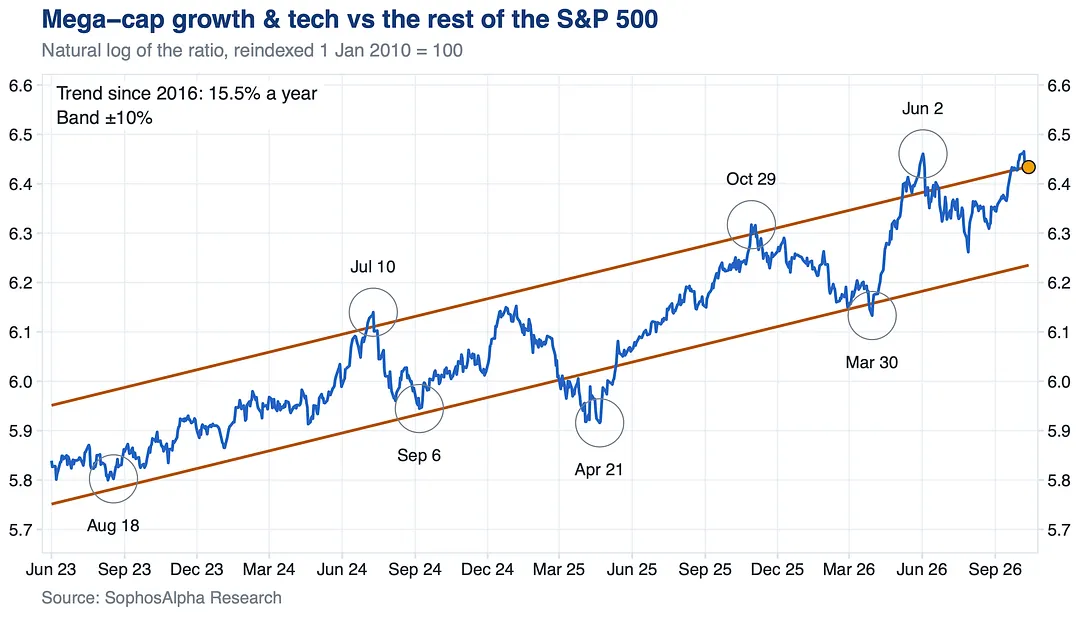
Against the rest of the S&P 500, it is back at the edge where every recent run has turned, and the turns came as fast as the climbs.
The rotation has run far. The risk reward now points down.
2 notes
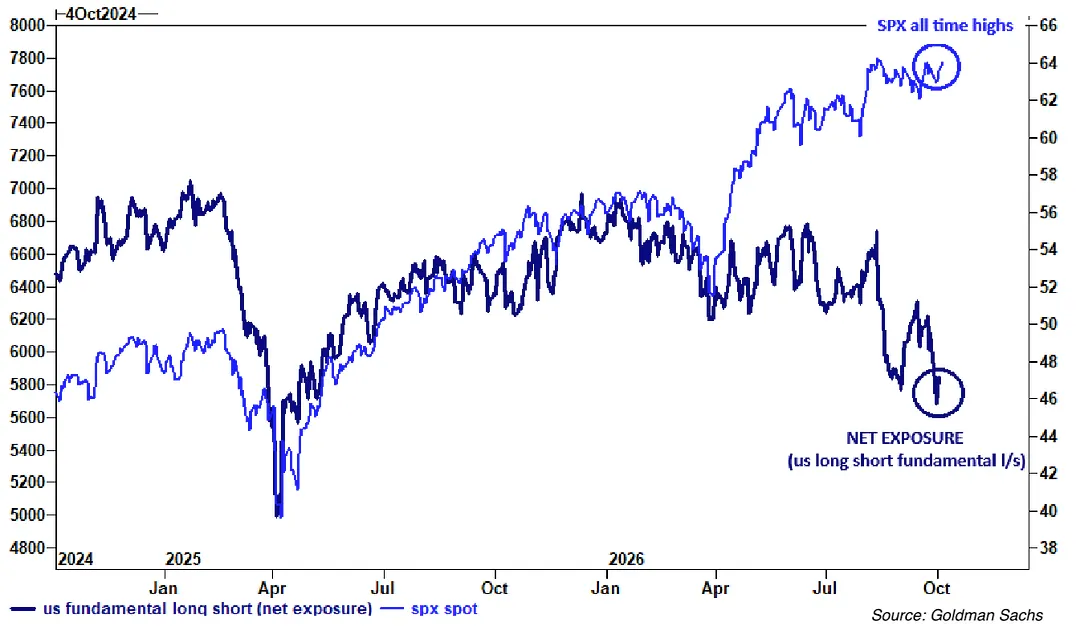
Their long/short ratio is in the 1st percentile of five years.
Funds are not chasing this rally. That is fuel if earnings deliver.
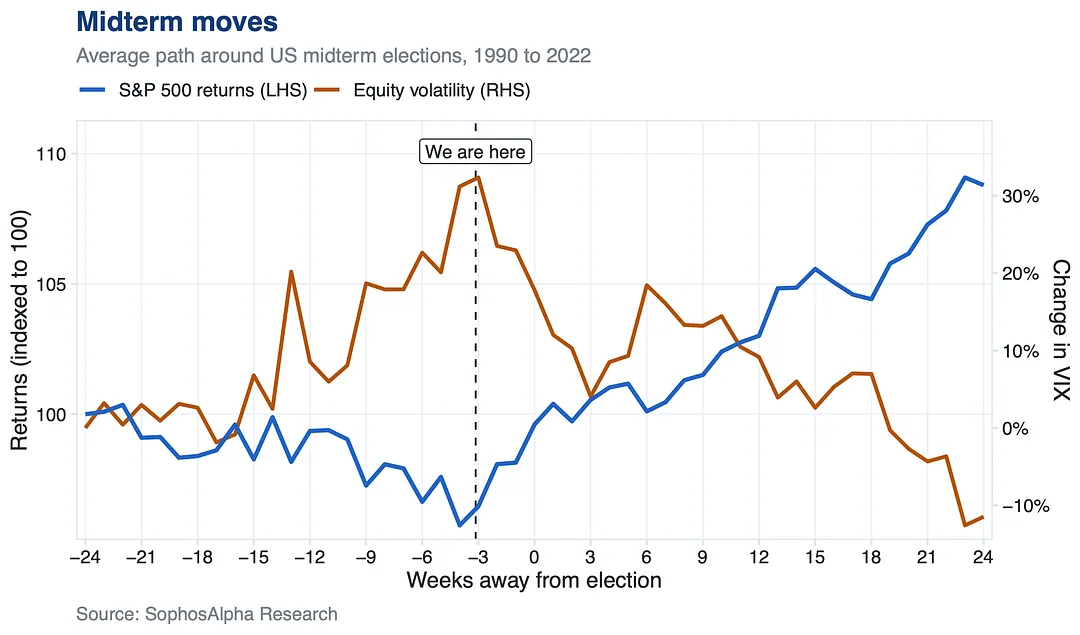
The vote is three weeks away. Markets are likely to digest any electoral outcome and anchor back to fundamentals.
7 notes
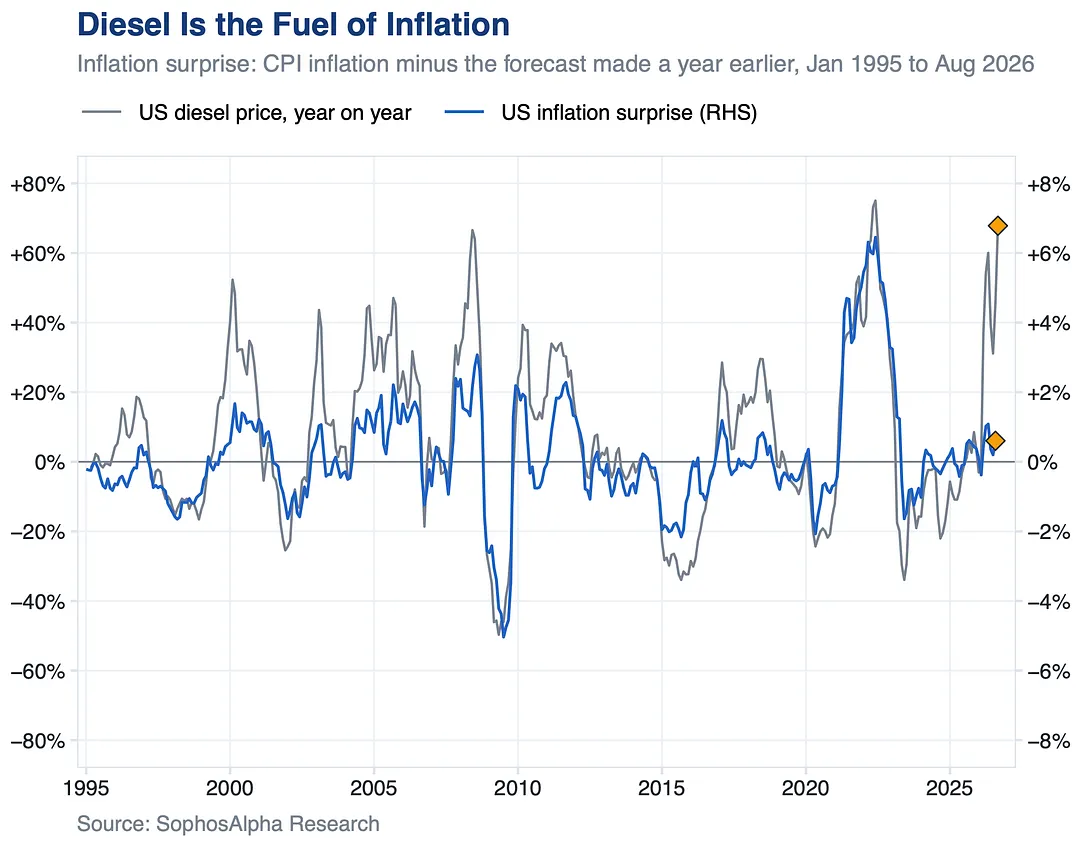
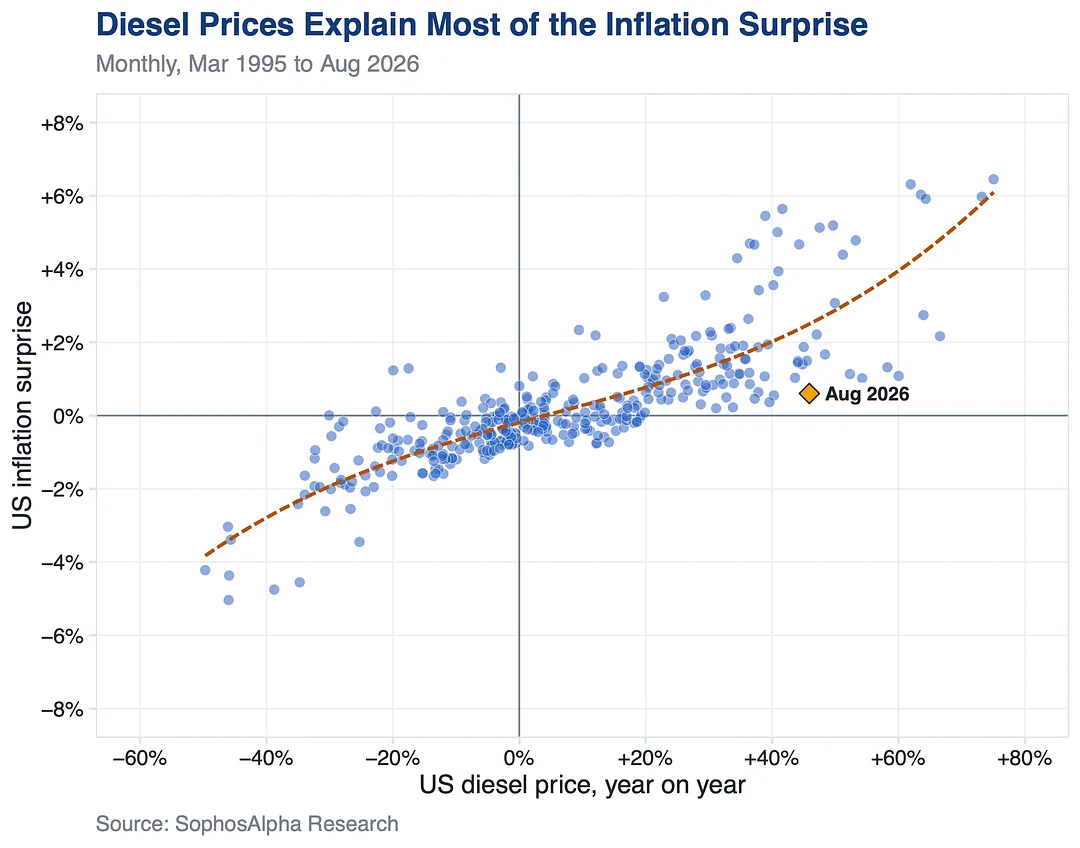
Since 1995, every month with US diesel up more than 30% on the year saw US inflation come in above forecast. Diesel is up 68% now. Yet August inflation beat forecast by only 0.6 points, the smallest beat with diesel up 40% since 2000.
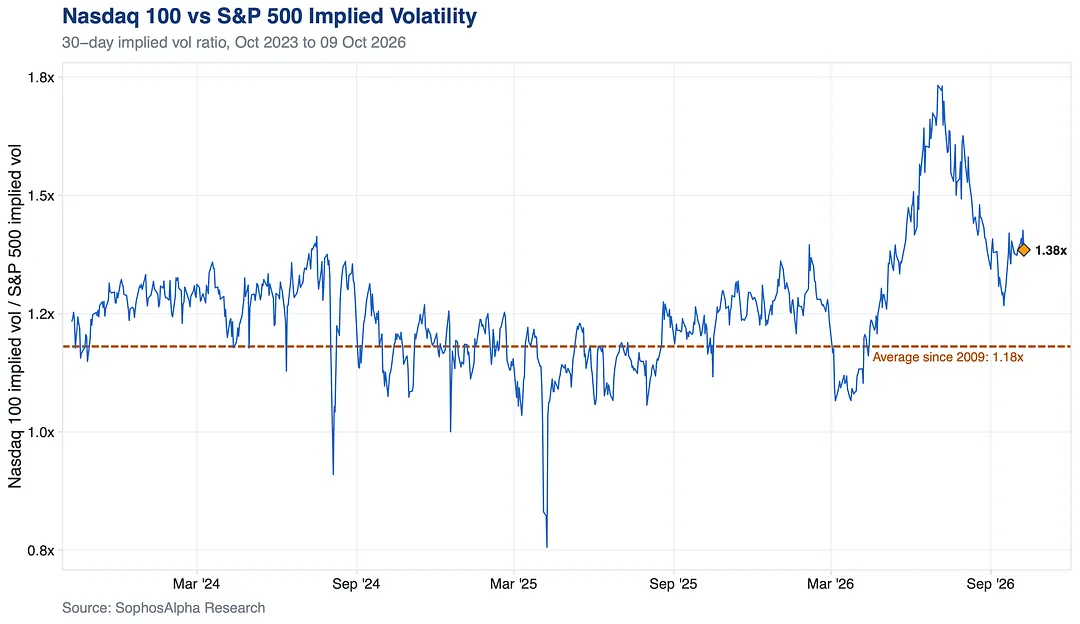
The ratio is down from 1.73 in July, but the average since 2009 is 1.18. Hedging the Nasdaq 100 still costs more than usual next to the S&P 500.
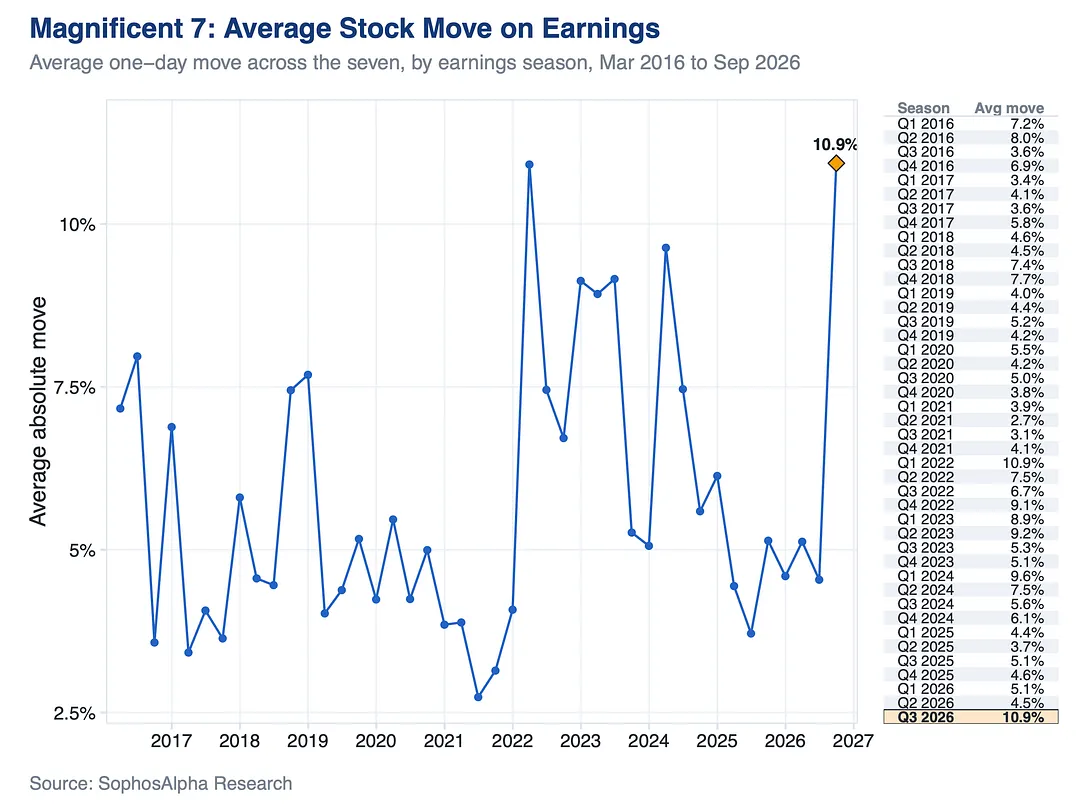
Microsoft and Amazon each jumped more than 15% in a day and Tesla fell 14.5%. That is the bar the next round of prints walks into.
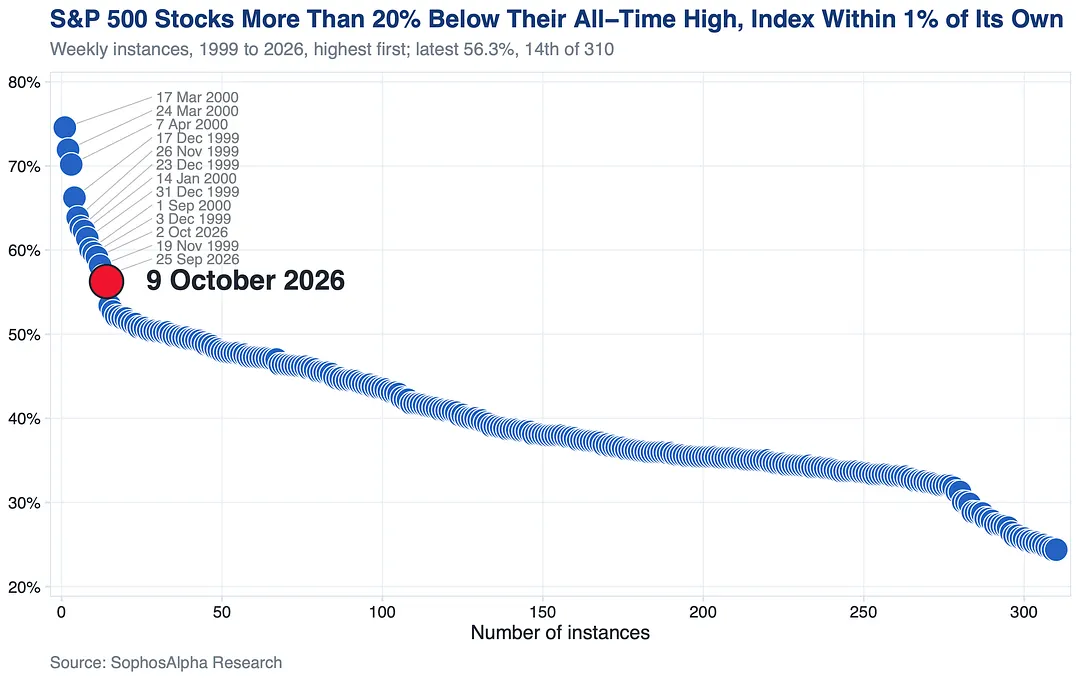
It closed Friday 0.1% from its all time high, yet 56% of its stocks sit more than 20% below their own.
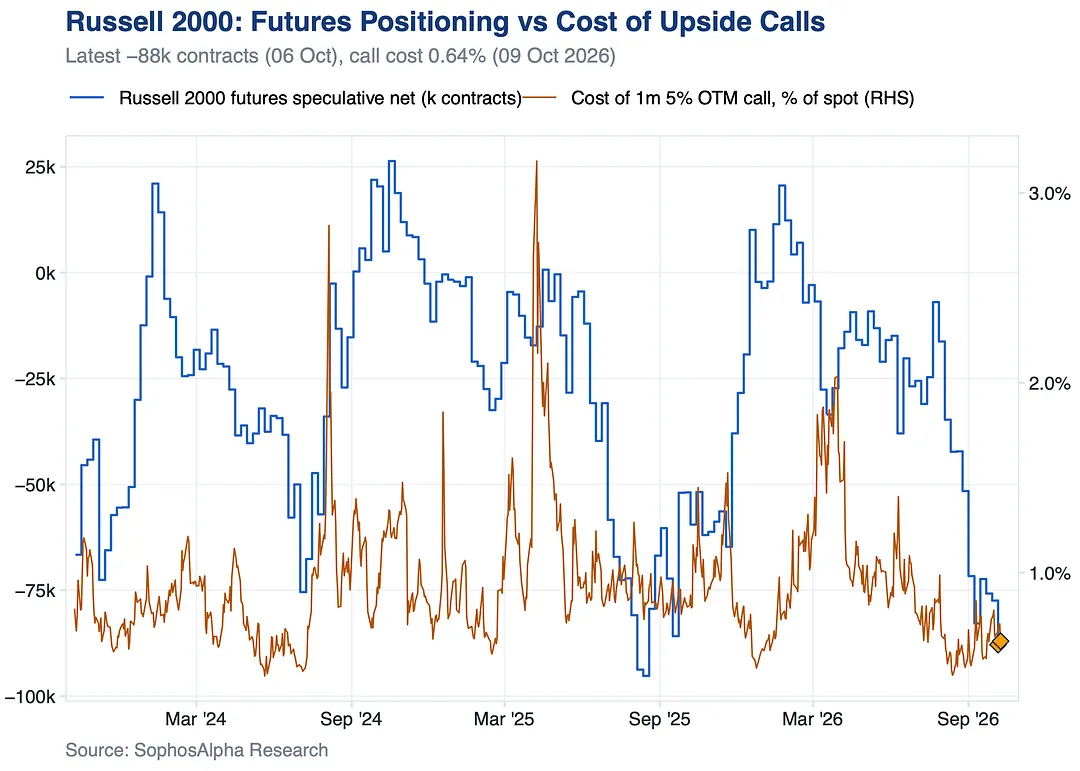
Upside is cheap against that: a 1 month 5% OTM call costs about 0.64% of spot, cheaper than 88% of days in the last 3 years.
If small caps rally, there is a lot of short to cover.
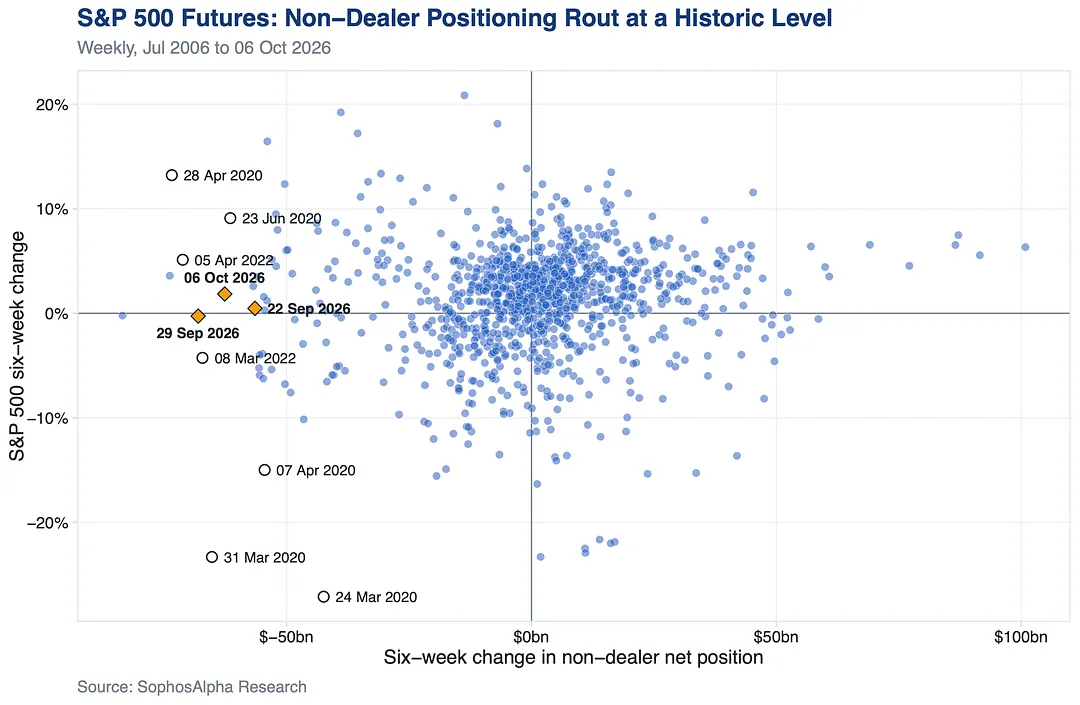
Asset managers and hedge funds did over 80% of the selling.
The difference this time: back then the index was below its highs, now it barely moved and set a new record on 6 Oct.
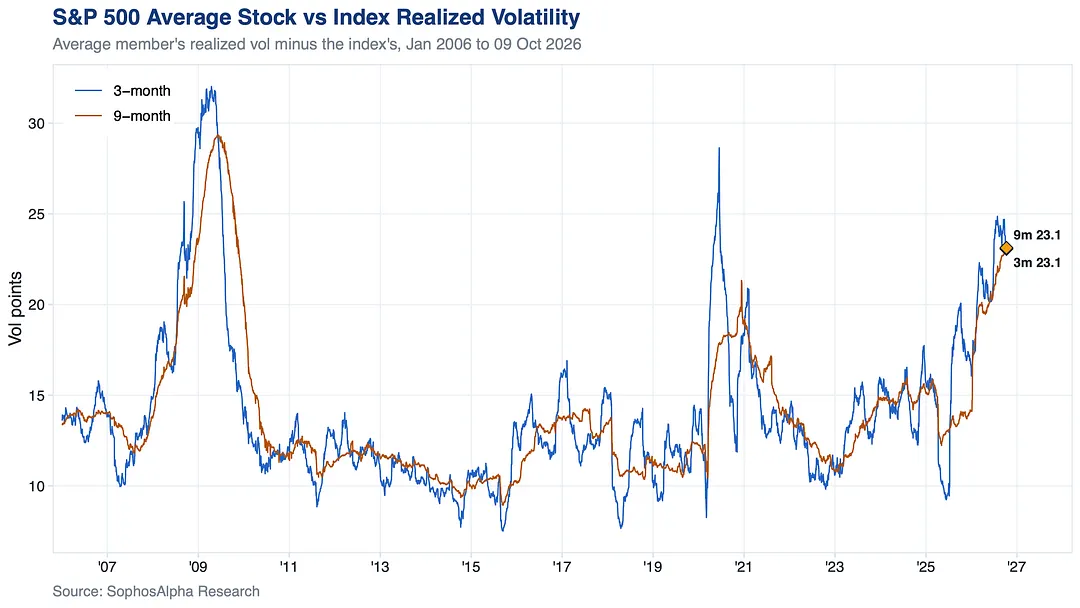
The average member's realized vol is running 23.1 points above the index's, on both a 3 and 9 month view.
On 9 months that is the widest gap since 2009, and 2026 is on track as the most dispersive year since 2009.
2 notes
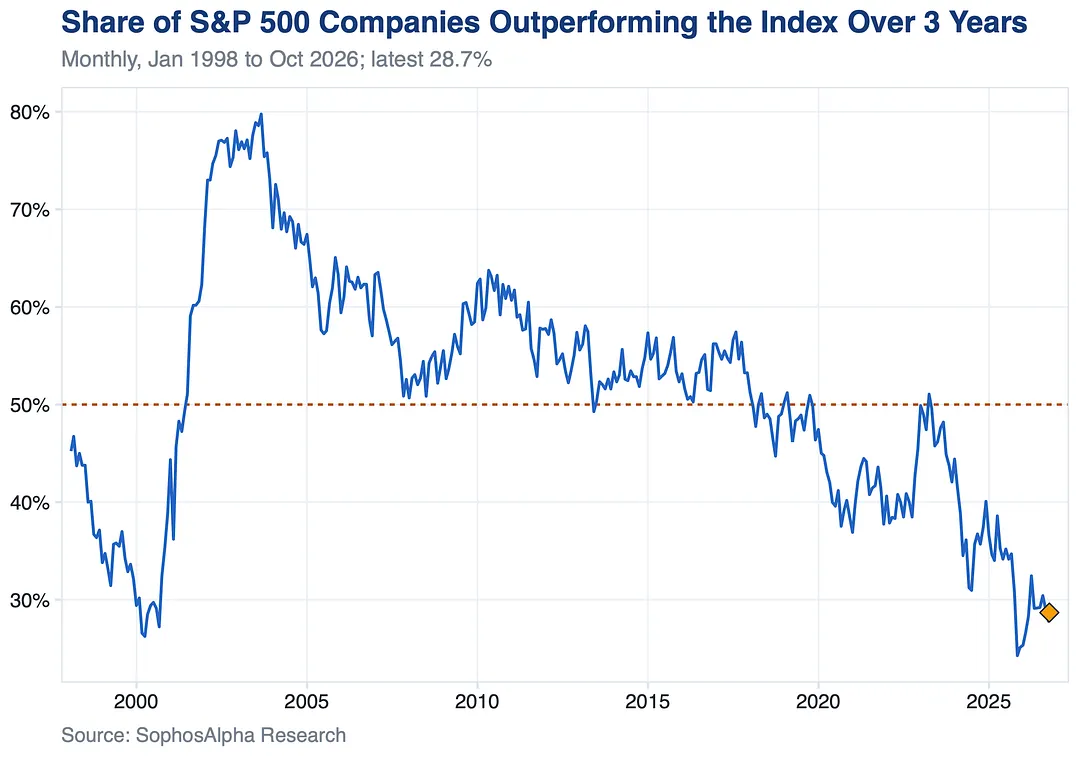
Since 1998, readings this low came only at the 2000 dot com peak and in the past year.
This rally is being carried by a few names. If they stumble, there is little underneath to catch the index.
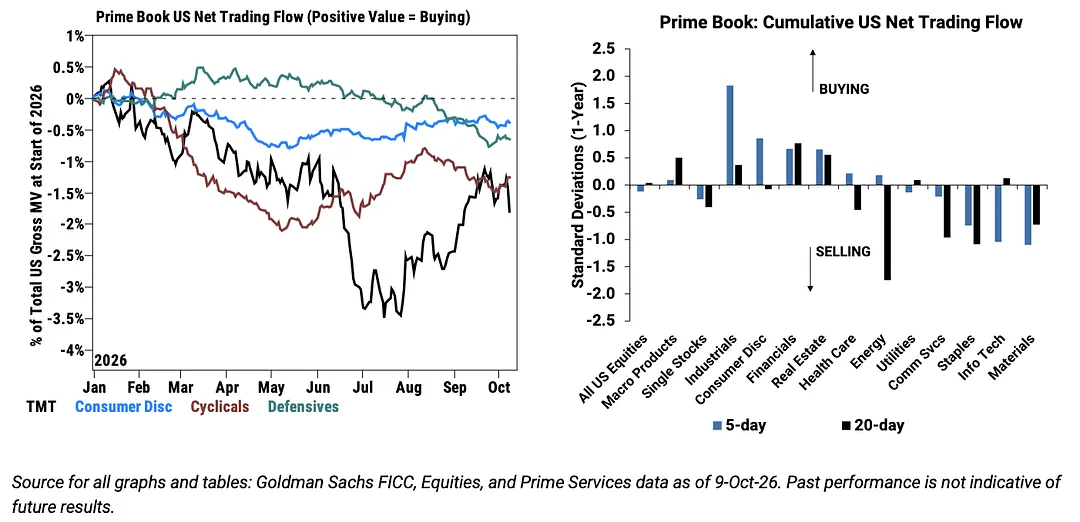
Info Tech selling was heaviest Thursday.
Health Care was degrossed for a 4th straight week. Single stock shorts modestly outpaced long buys.
5 notes
Not this time.
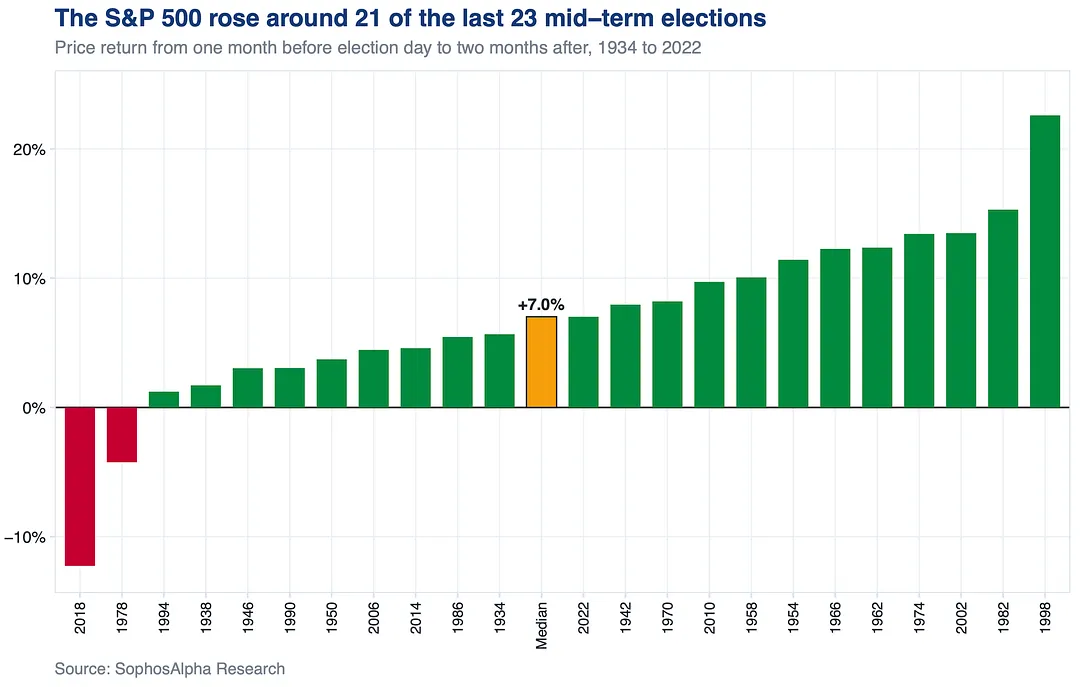
The average midterm year since 1934 is flat into October. The S&P 500 is up double digits, even after the Iran war selloff in March.
The strong part of a midterm year hasn't started yet.
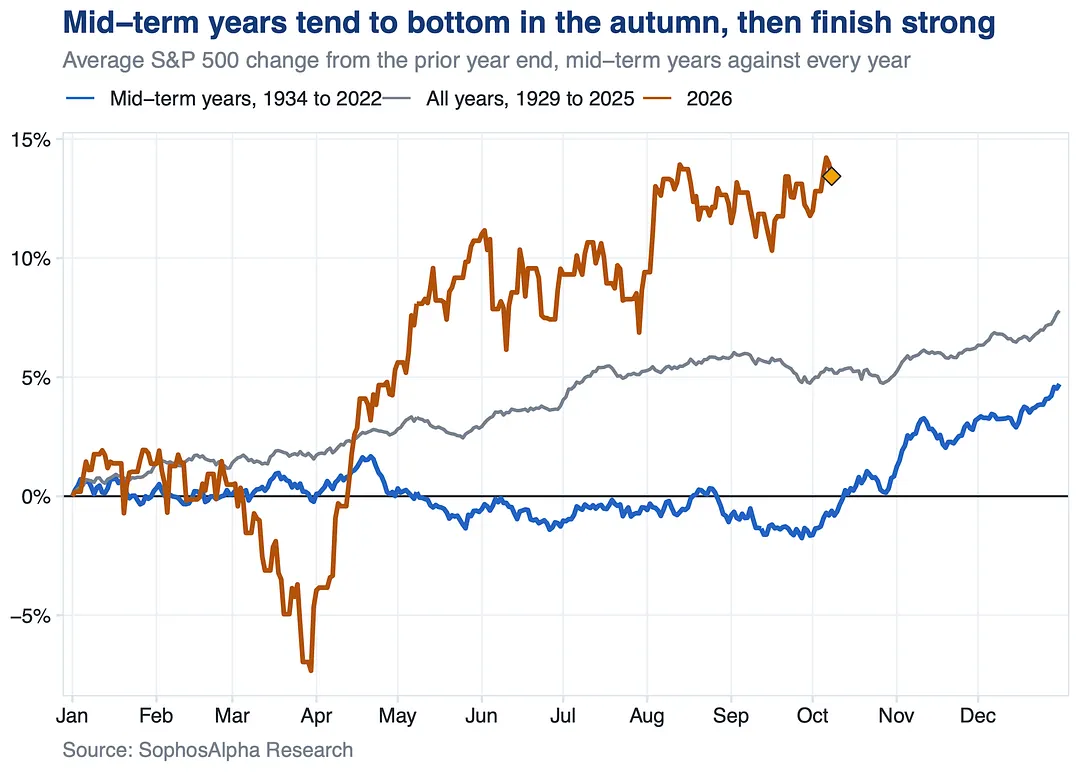
It dipped into September right on schedule, the same weeks the average of the last 23 midterms bottomed, and has already turned higher.
The best part of the script comes after the vote. That's November 3.
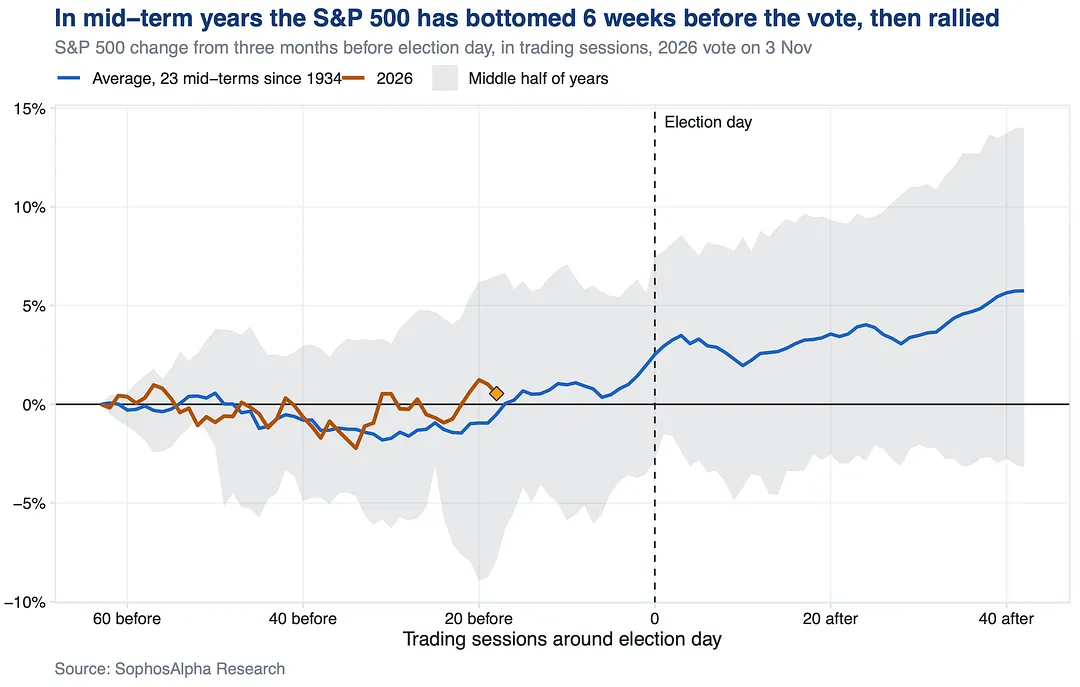
It rose around 21 of the last 23 votes. The only losers: 1978 and 2018.
Markets read the midterms as a check on the White House, not a threat. This one is November 3.
This time the rally window has company. The Fed meets and America votes inside it.
Markets hedge into events like that, then rally once they pass.
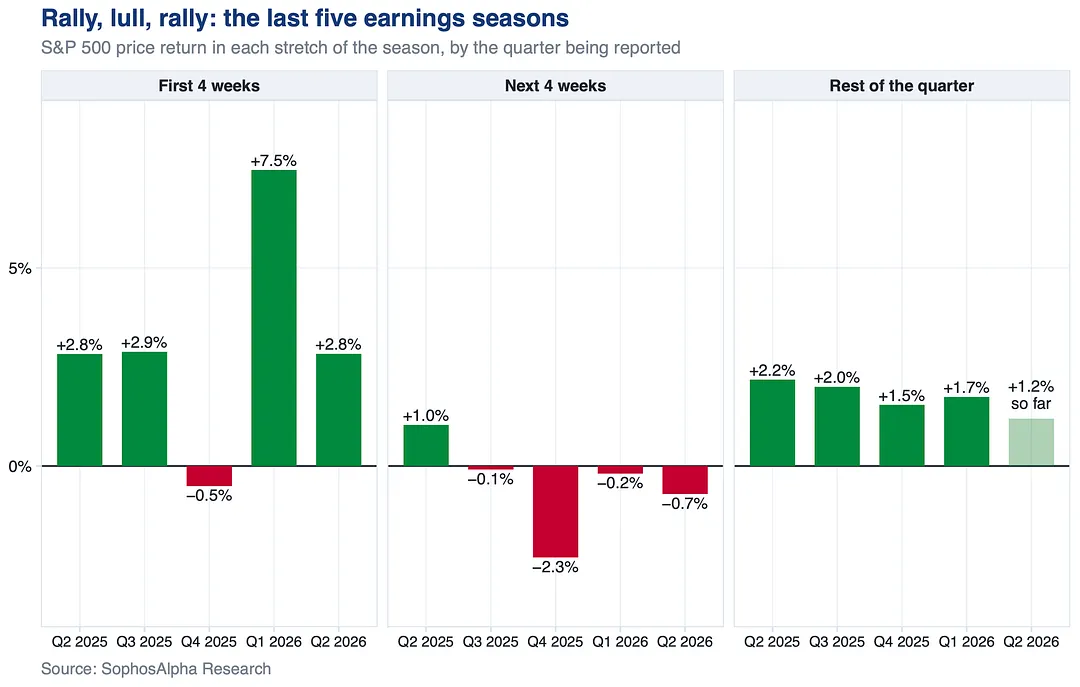
Tuesday is when it usually breaks out.
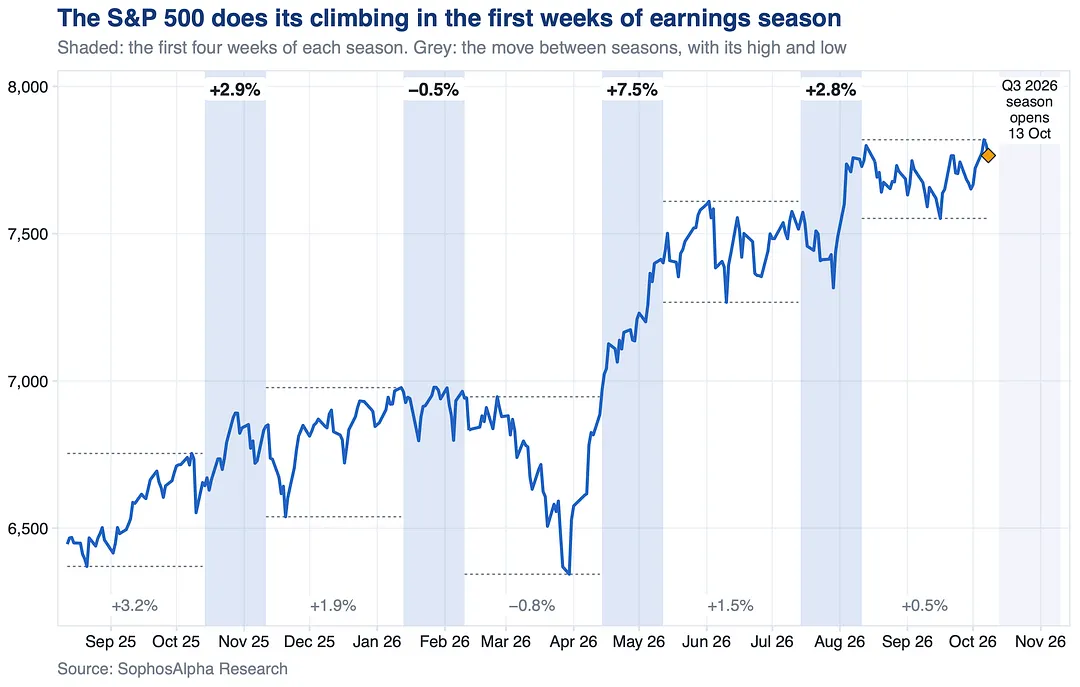
For a year now it has rallied when companies report, then gone nowhere until the next season.
The street expects earnings growth to slow this quarter. The economy isn't showing it.
6 notes
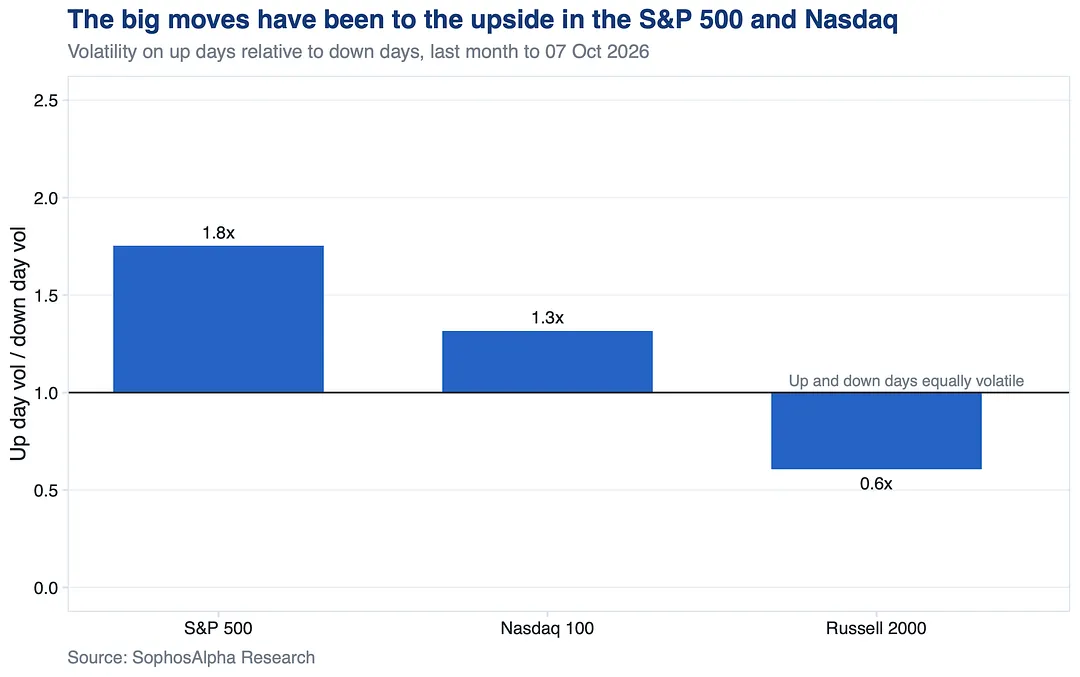
Up days have swung nearly twice as hard as down days in the S&P 500, and harder in the Nasdaq too. Small caps show the opposite.
The risk that matters in this tape is a tech rally running away from you.
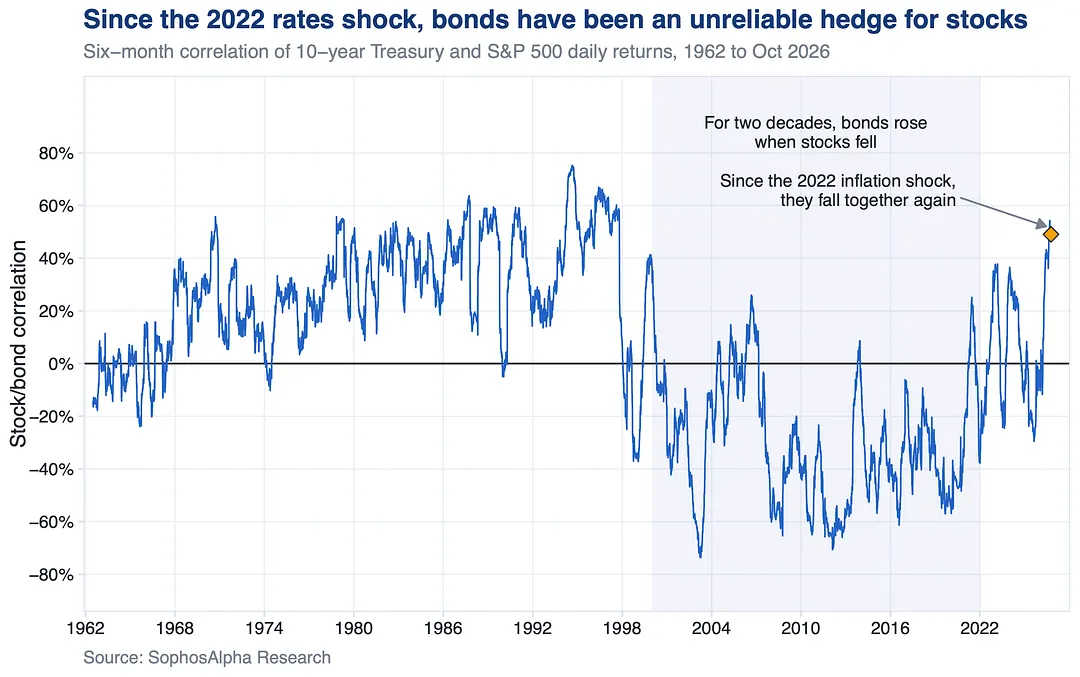
For two decades they rose when stocks fell. Since the inflation shock, stocks and Treasuries move together again, and the link is now the tightest since the late 1990s.
That is why income money went looking beyond bonds.
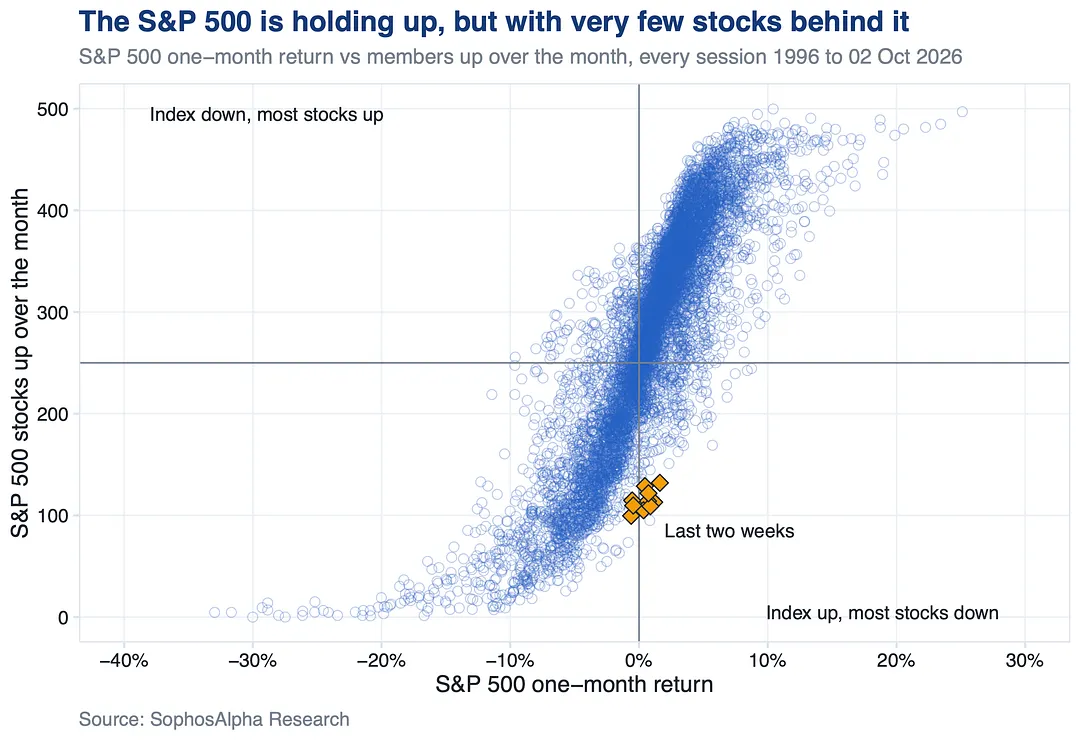
The index is flat on the month, but fewer than 1 in 4 of its stocks are actually up. Normally it is about half.
Going back to the 90s, the market has almost never been this thin underneath.
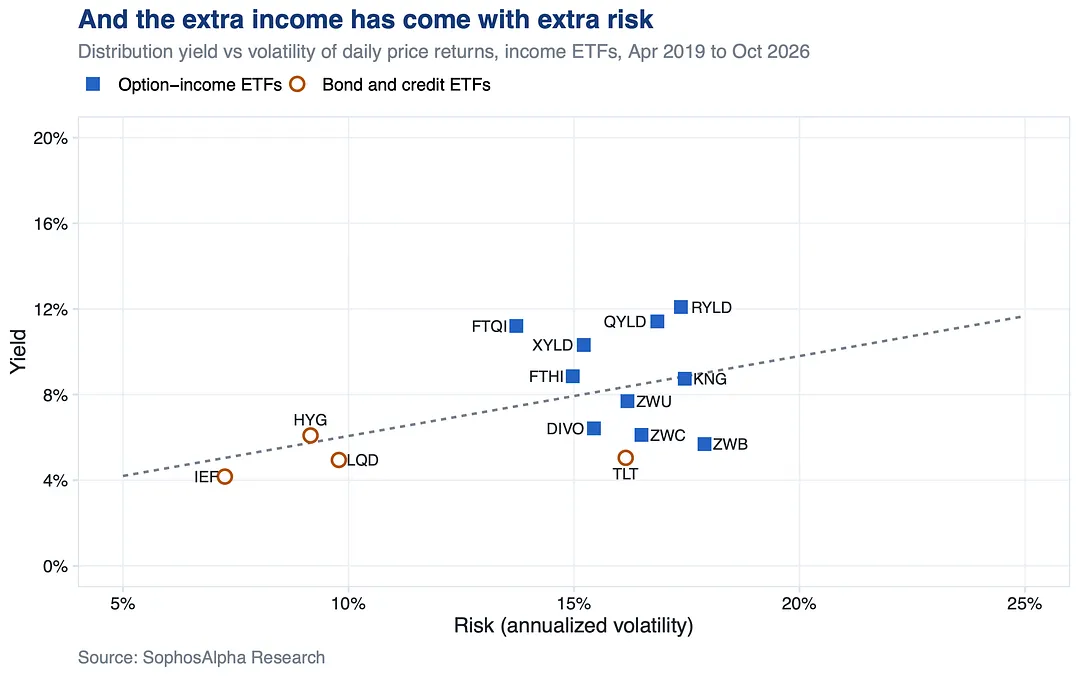
The income ETFs paying the most swing about twice as hard as core bond funds. The extra income is payment for taking on stock market risk.
More yield has meant a bumpier ride.
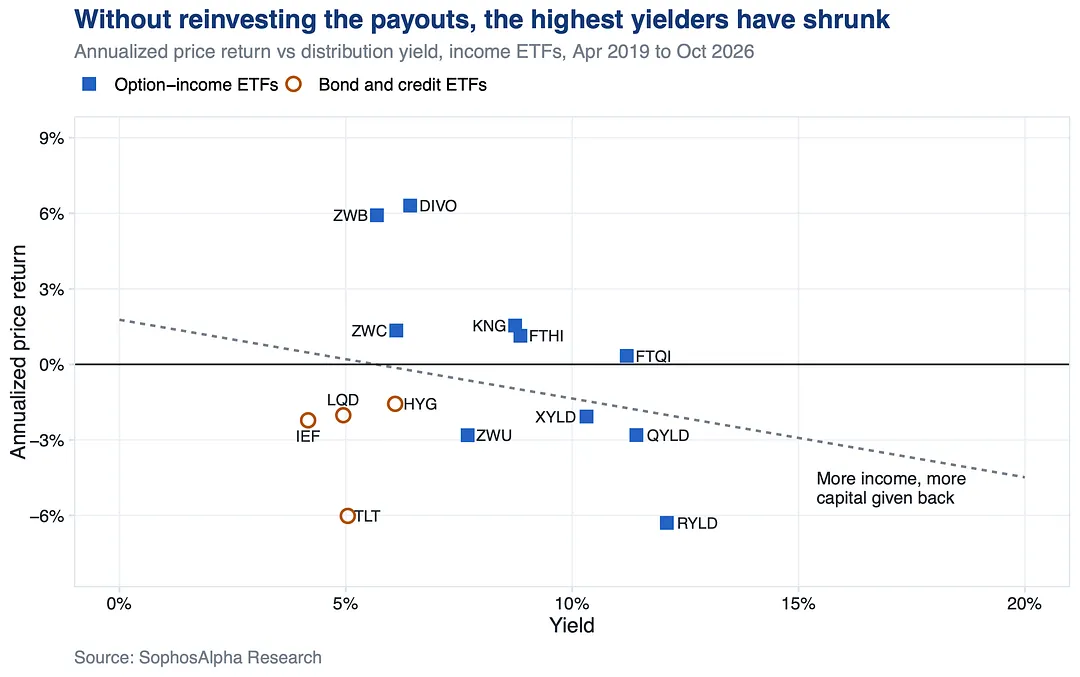
The income ETFs paying double digit yields have been shrinking since 2019. Spend the payout instead of reinvesting it and the price you hold keeps falling. The funds paying less grew.
Part of that check is your own capital coming back.
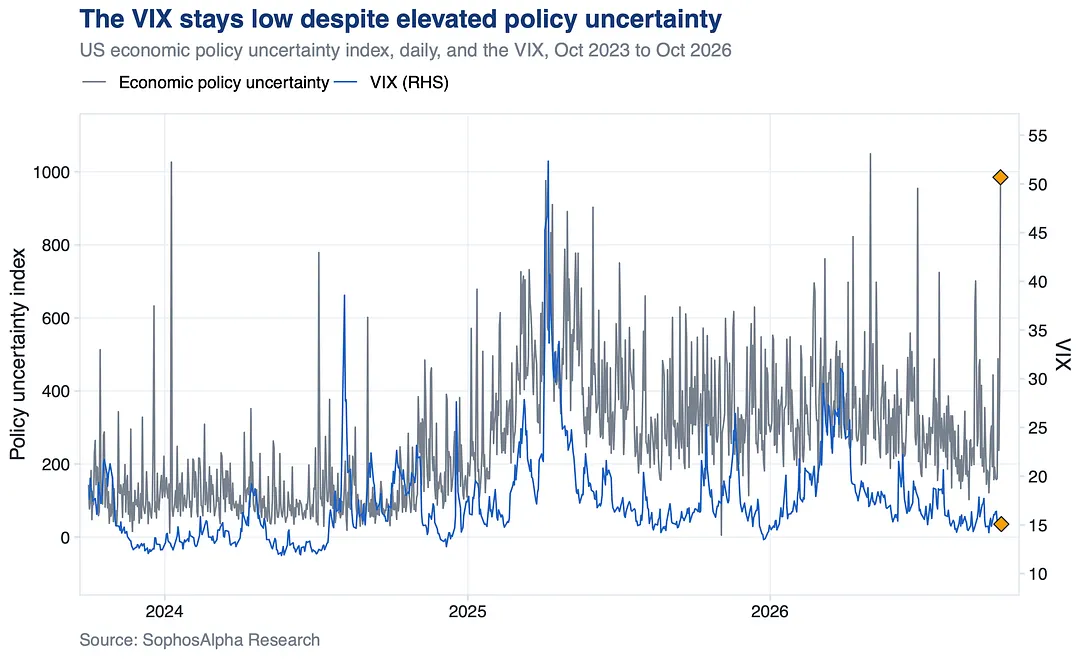
The VIX is sitting at calm levels while trade and fiscal risks just pushed the policy uncertainty index to one of its highest readings in three years.
Protection against the headlines is cheap right now.
2 notes
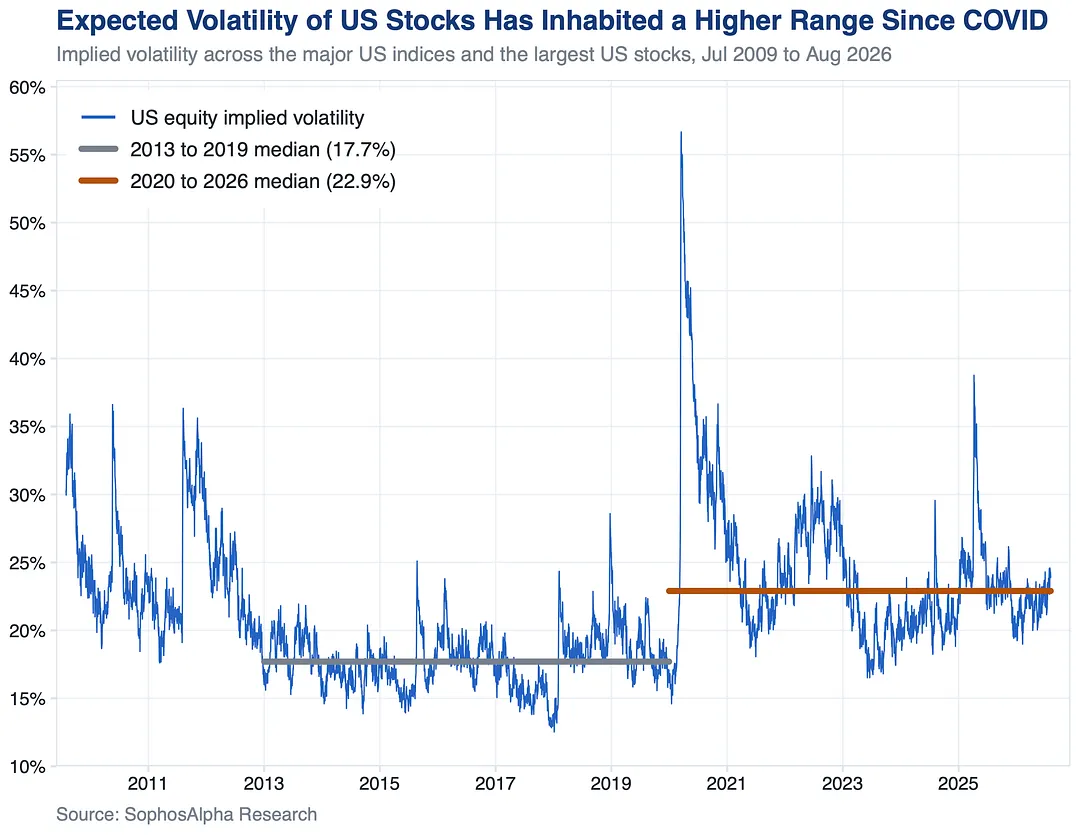
Single stocks lead, with AI driving a record number of outlier moves. FOMO and boom bust dynamics should keep it there, and keep option premiums rich.
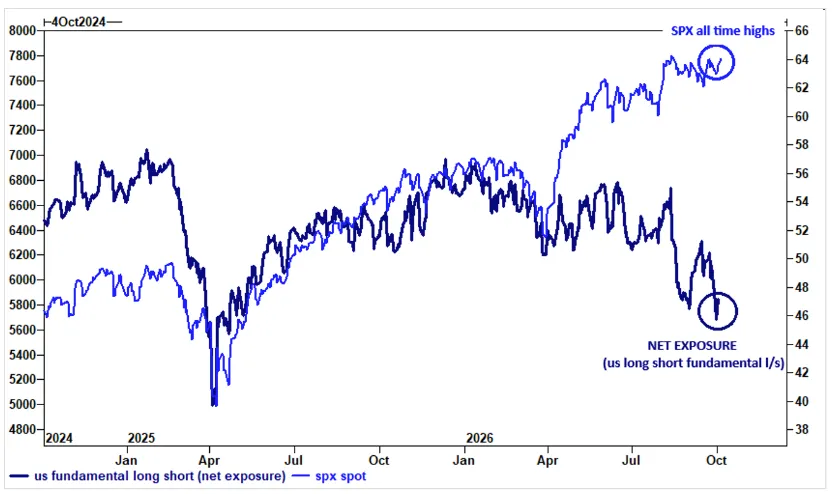
Managers are underexposed into a rally that keeps grinding higher. Plenty of fuel if they have to chase.
7 notes
Stocks moved with their sector and sectors went their own way. Dispersion works as long as that holds.
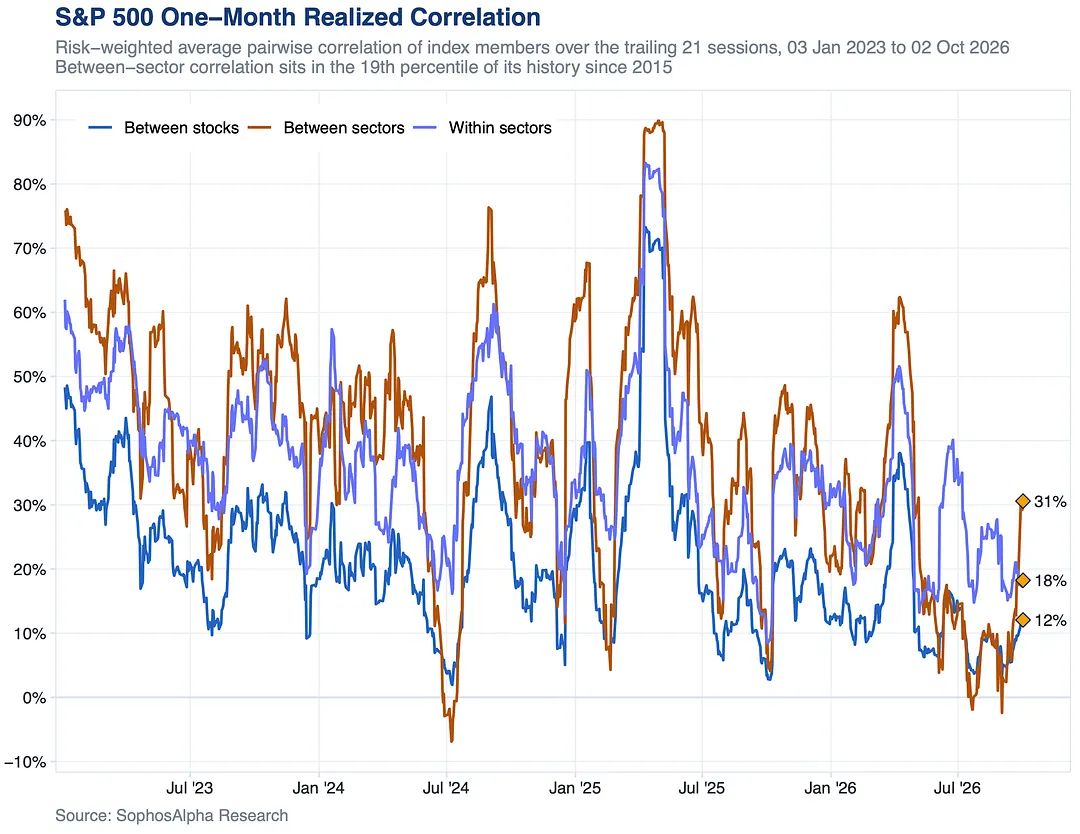
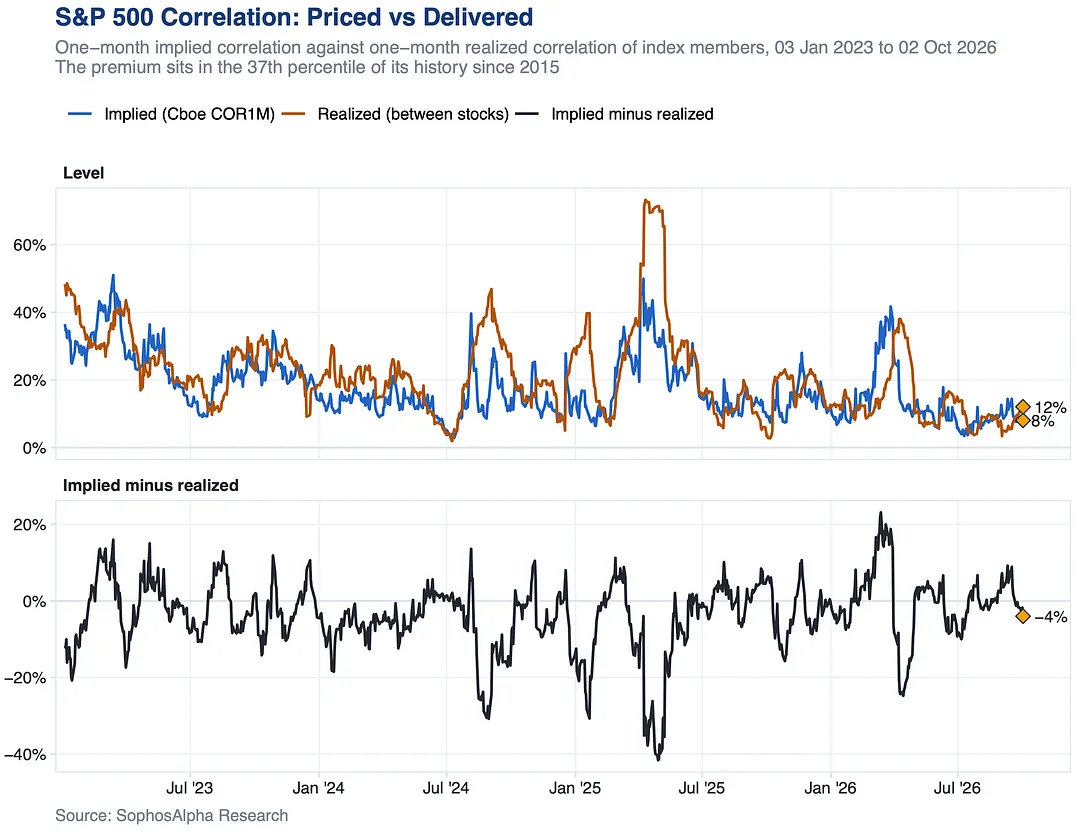
S&P 500 implied correlation is 8%, lower on 2% of days since 2006, and realized fell to 3% in early September, under it.
Consensus wants 27% EPS growth, led by Tech at 64% and Energy at 109%. With no help expected from multiples, earnings have to carry the tape.
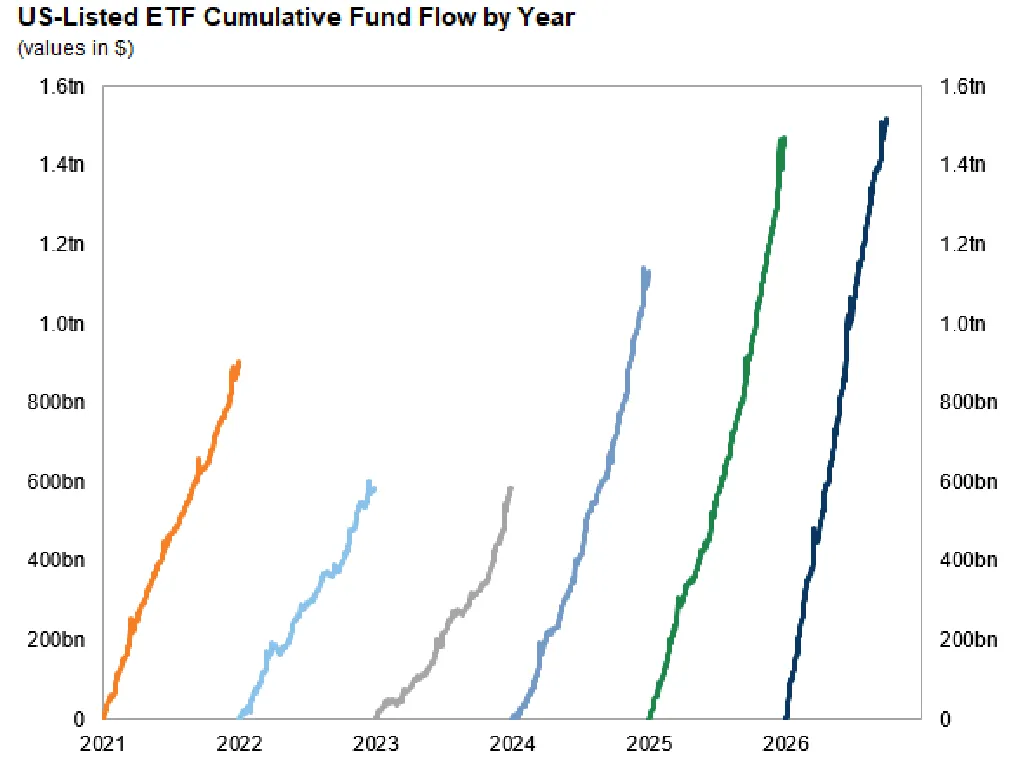
That is about $167 billion a month, $8 billion every session. Hold that pace through a seasonally strong Q4 and 2026 ends above $2 trillion.
The market's biggest steady buyer is mostly sidelined until Q3 earnings start in mid October. Authorizations run 11% ahead of last year, so the bid returns once windows reopen.
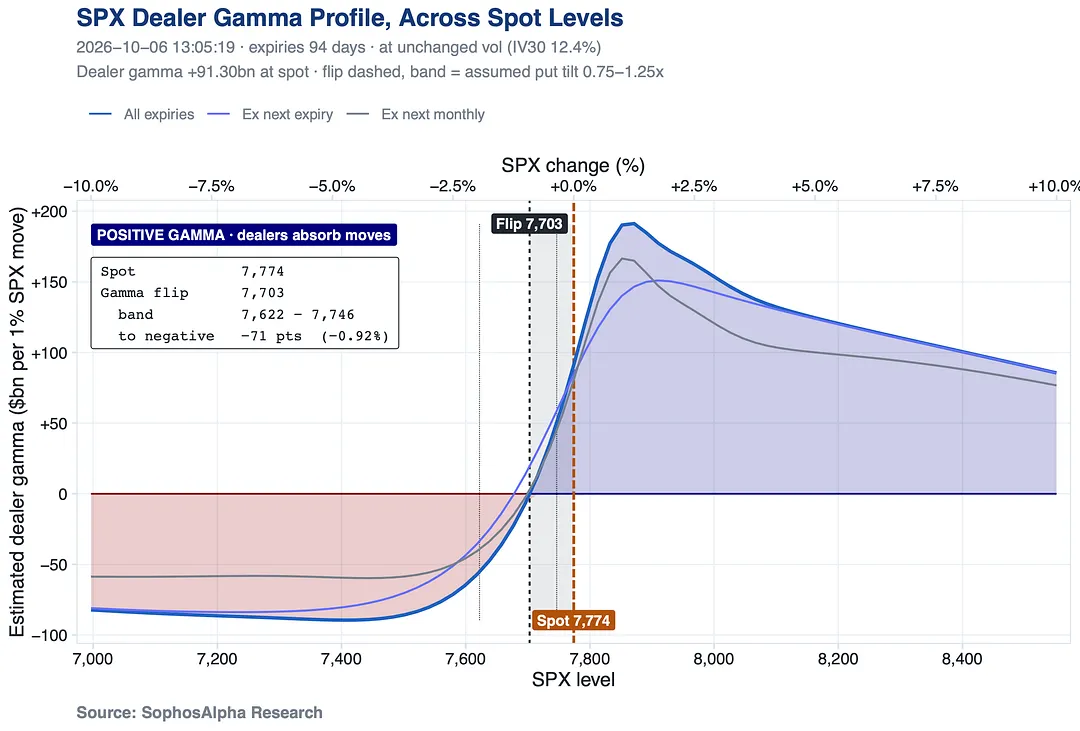
The catch: the flip sits just below spot. A modest dip turns dealers from buying weakness to selling it, right where CTAs start trimming.
More in this week's Institutional Monitor: https://sophosalpha.substack.com/p/institutional-monitor-d84
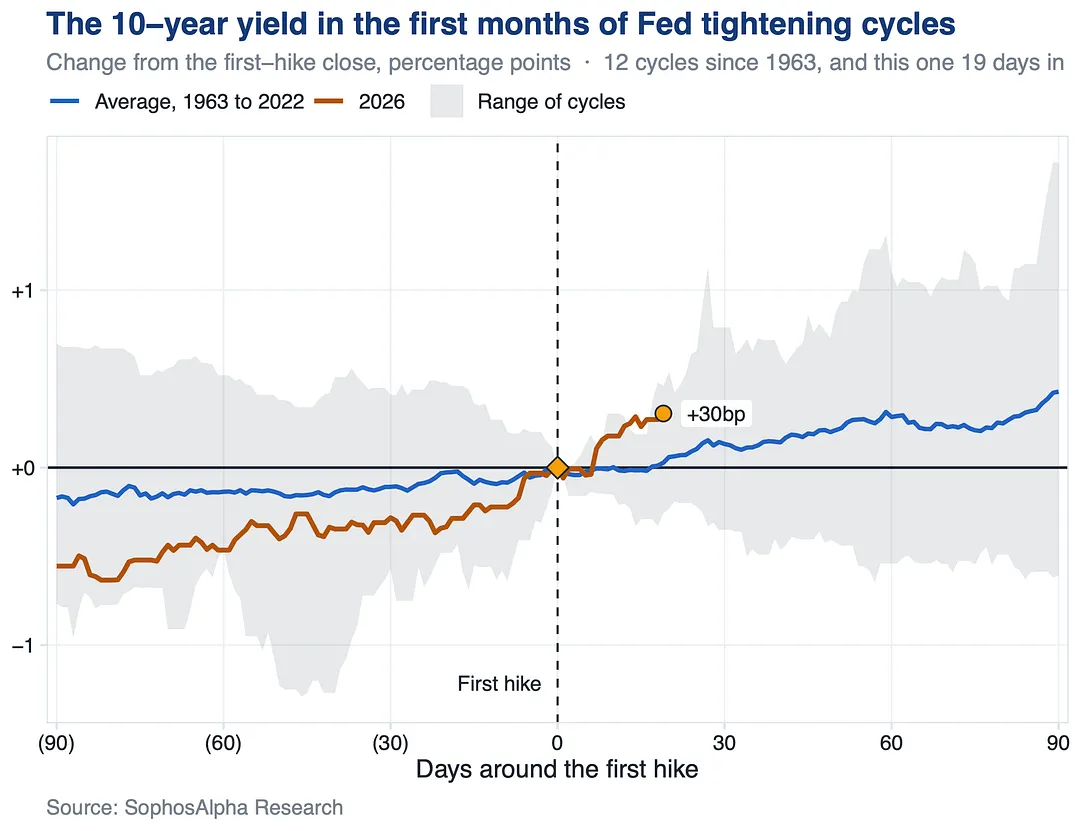
19 days in, it is up 30bp from the first hike close, already running above the average cycle.
7 notes
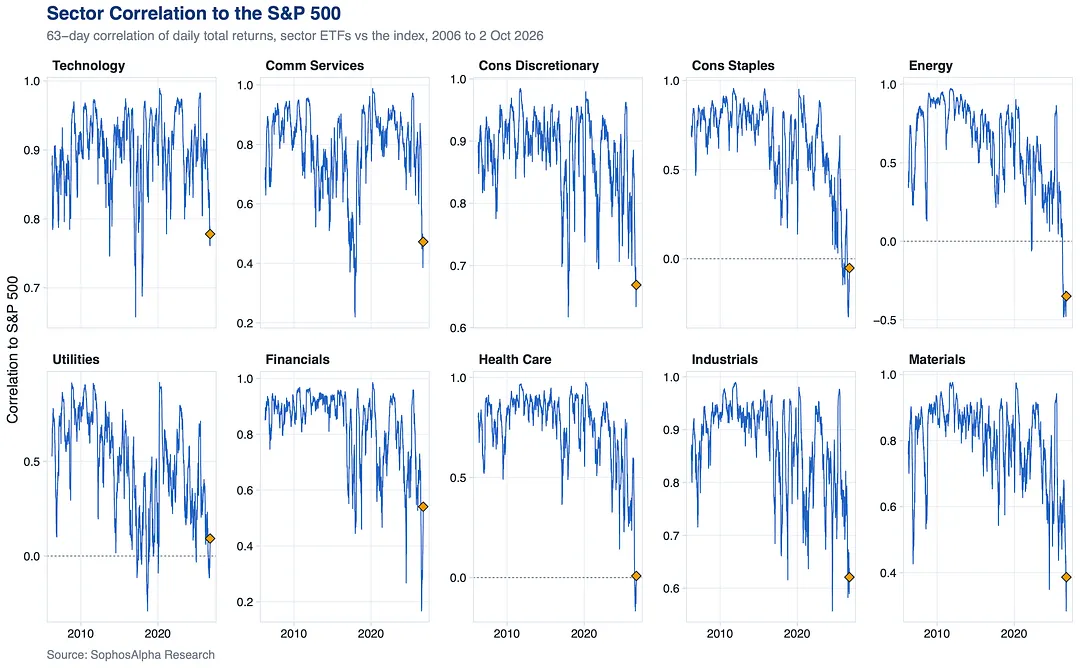
9 of 10 sectors are tracking it less than in 95% of their history.
Hedge funds rotated into tech, media and telecom in September and sold nearly every other sector. When nothing else works, the AI trade adds passengers.
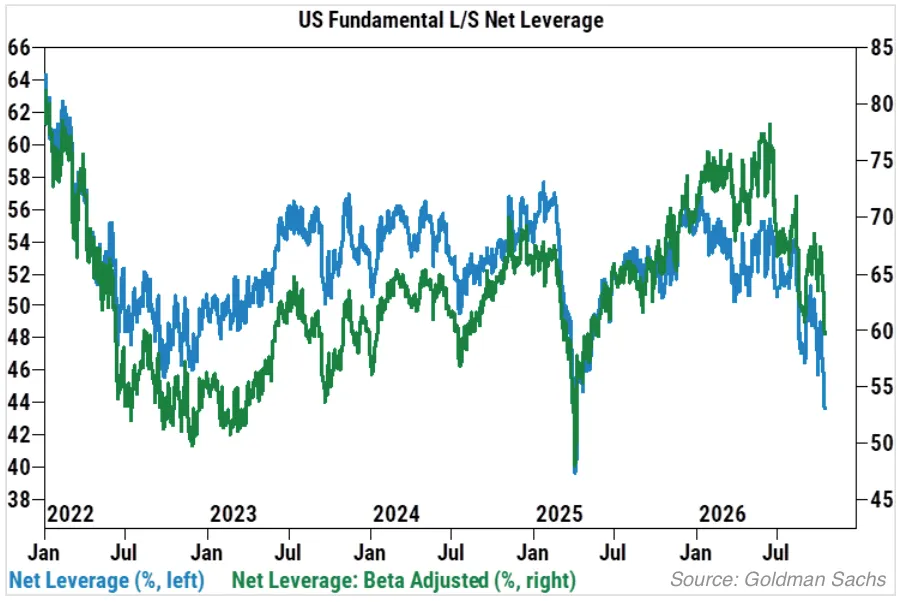
Fundamental long/short net leverage is at its lowest since April 2025 too. A divided market with little net length.
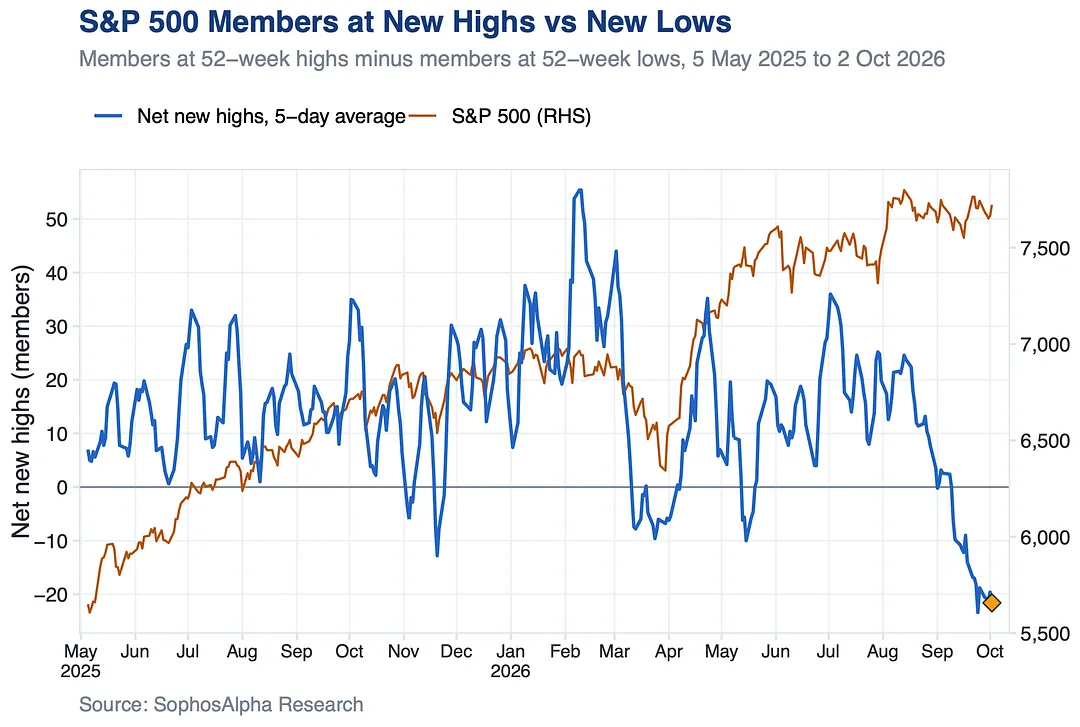
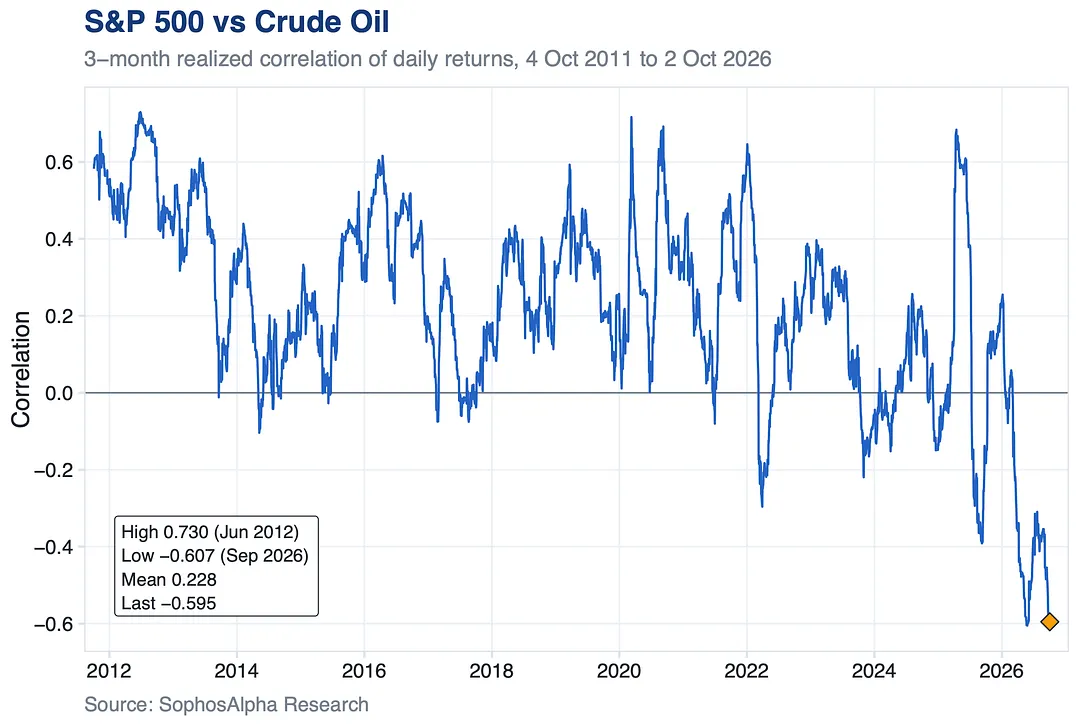
In April 2025 it was positive 0.68. Oil is telling a different story than stocks, and the S&P 500 is trading like an asset class of its own.
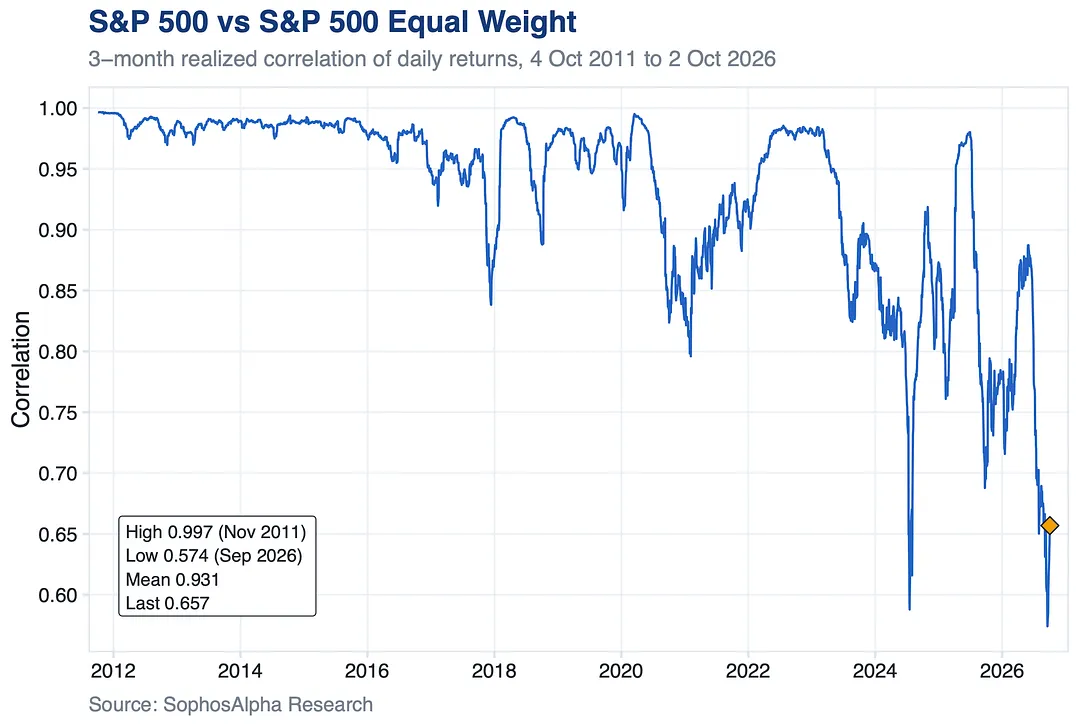
Their 3 month correlation fell to 0.57 in September. Before 2024 it never dropped below 0.79, back to 2007.
The top 10 contributors are expected to deliver over two thirds of S&P 500 earnings growth this season.
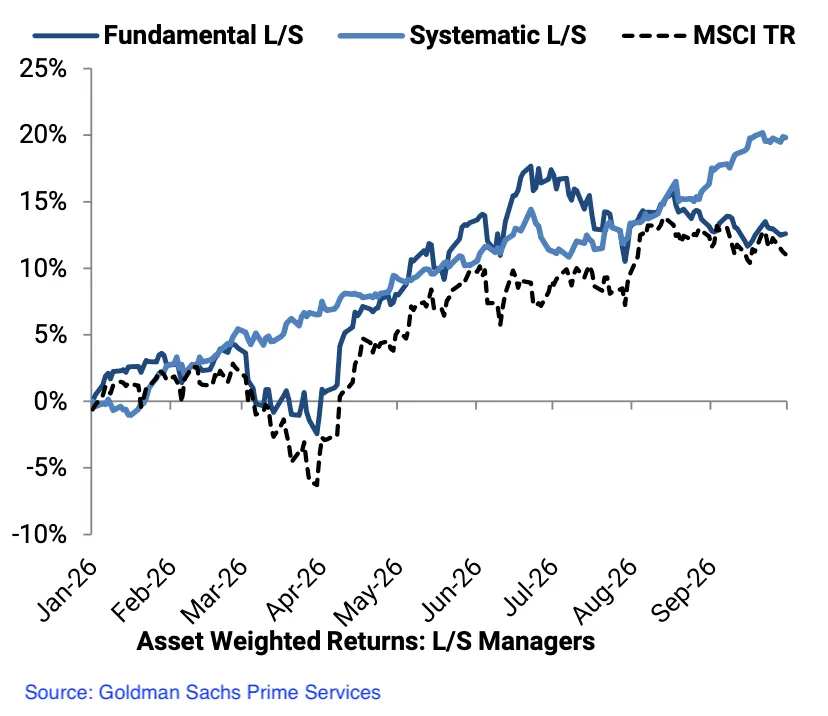
That is its best month of the year, and it came entirely from short side alpha.
It is now close to 20% YTD, well ahead of fundamental L/S and MSCI TR. It also stayed positive through the March and April drawdown that pushed both lower.
This is why we track quant flows so closely. Our latest Institutional Monitor is out later covering systematic funds and what’s their position like right now.
Subscribe to get it, free:
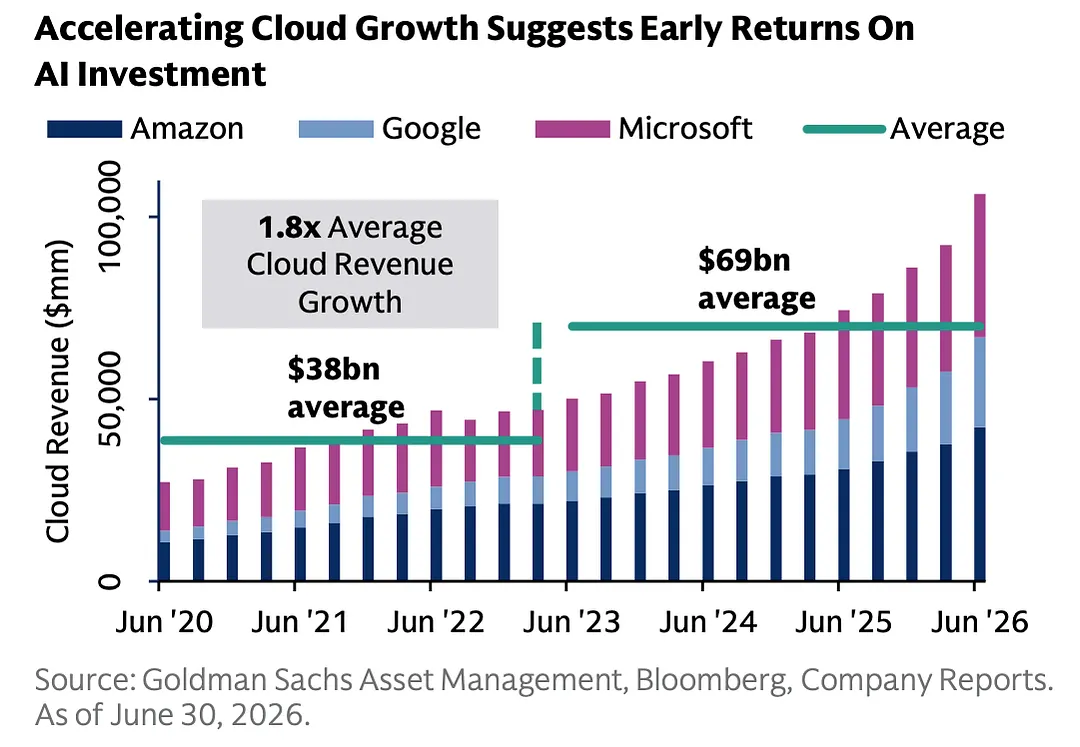
Cloud revenue at Amazon, Google and Microsoft is running at nearly double its pre boom average.
That backs the Nasdaq's lead over the S&P 500 this year, and the case that cash flow risk behind the capex is low.
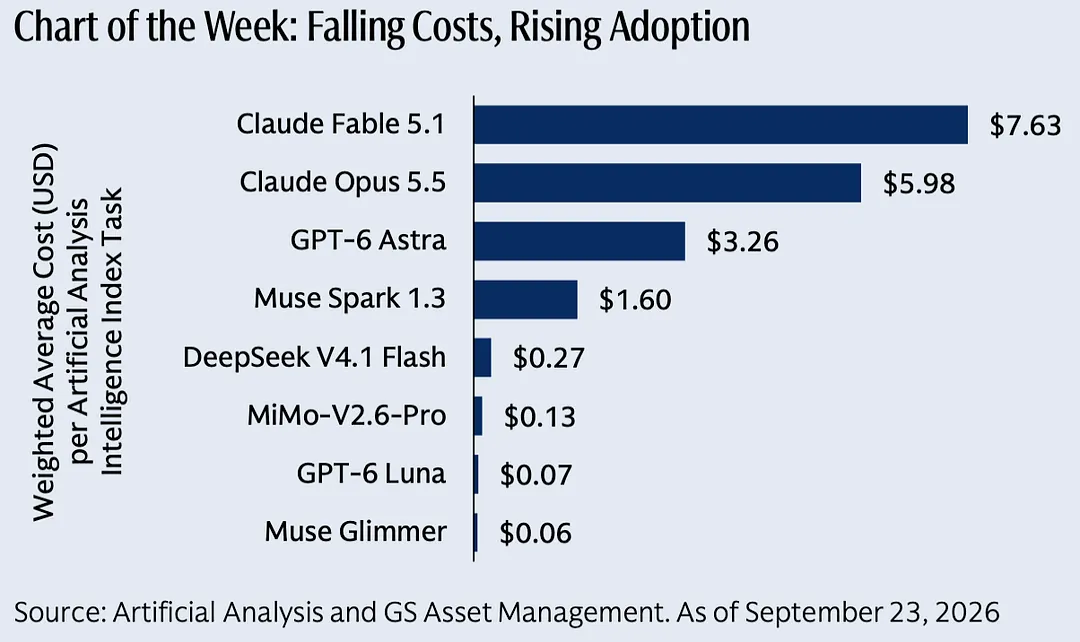
Meta's and OpenAI's new cheap models even undercut some of the Chinese ones.
Early sign: falling costs are driving more AI spending. AI earnings can keep growing even if margins come under pressure.
3 notes
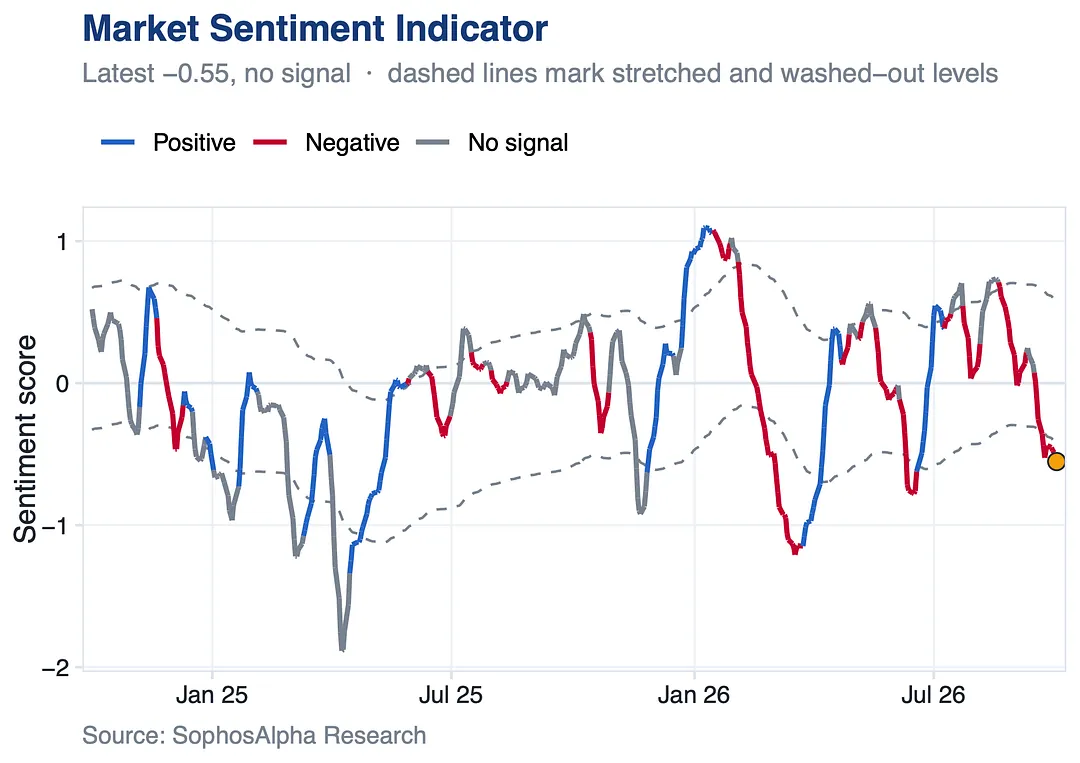
Our Market Sentiment Indicator has been washed out since late September, its gloomiest since June, while the S&P 500 sits barely off its highs.
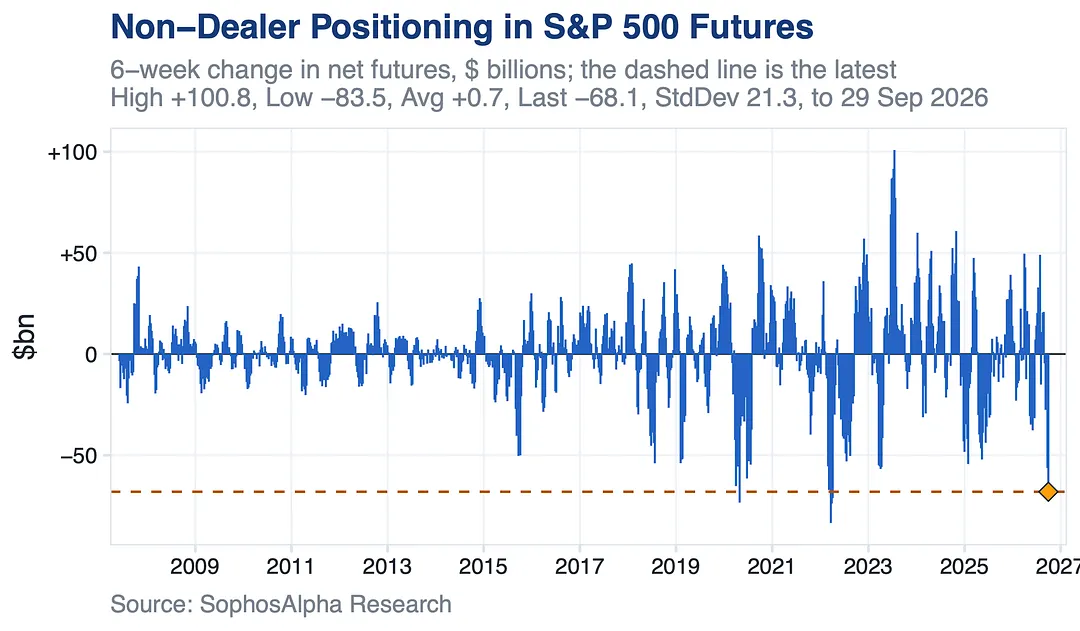
They sold almost every week since late August, yet the index is barely off its highs. That leaves plenty of room to buy back if earnings deliver.
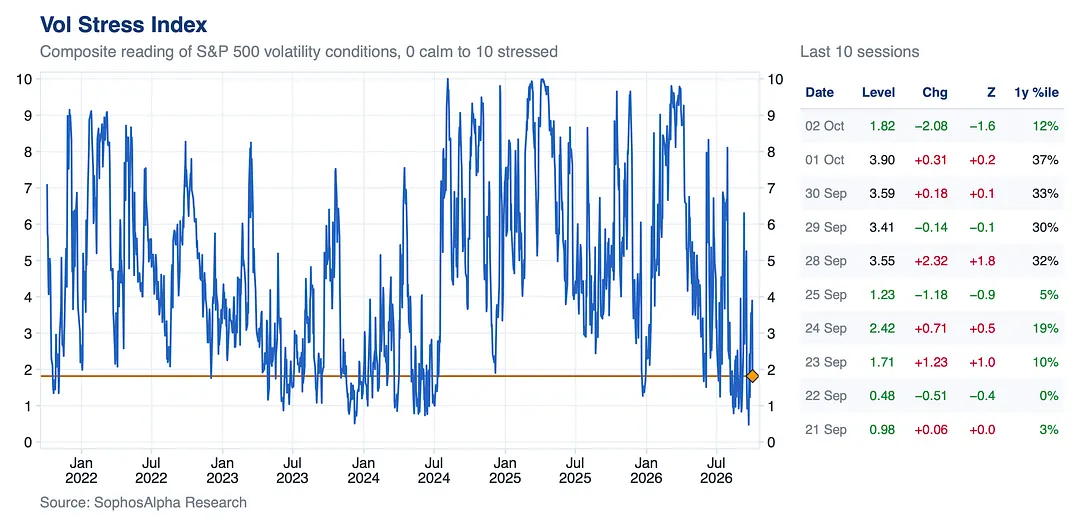
The stock market isn't.
Credit volatility just jumped and confidence in Fed policy is near record lows, yet the Vol Stress Index sits near the calm end of its range. If the stress spills into stocks, hedges are still cheap.
4 notes
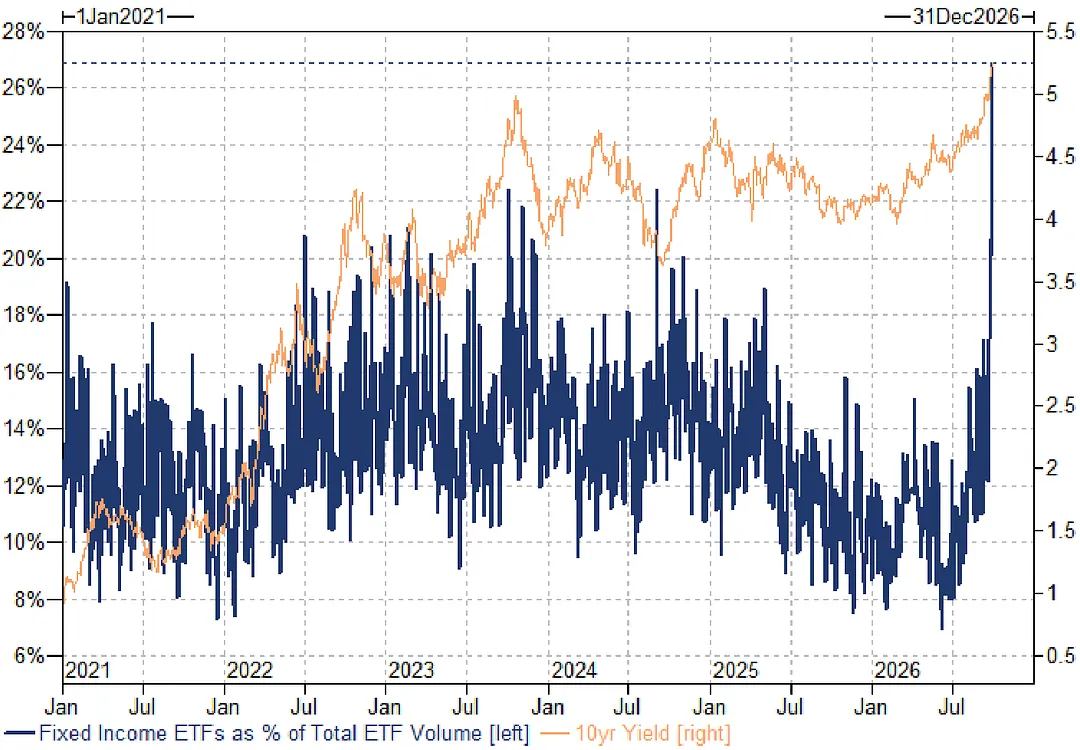
TLT hit a record low this week.
Bond ETFs now take about 27% of all ETF trading volume, their highest share since at least 2021.
When rates move this fast, the bond trade runs through ETFs.
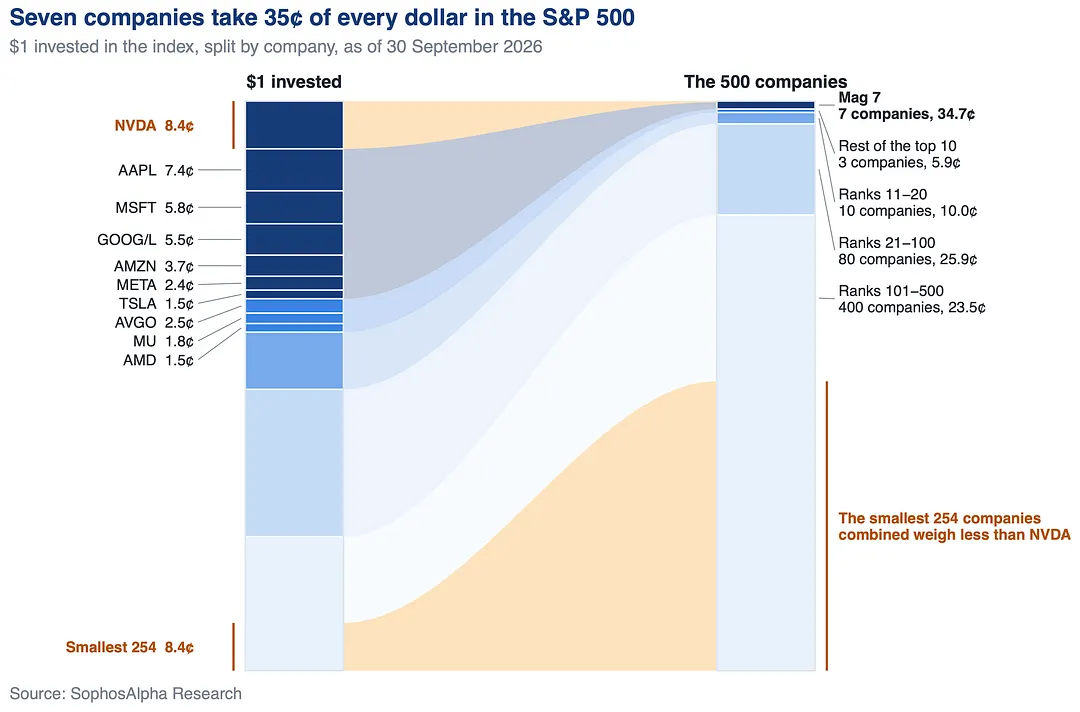
Of every $1 in the index, 35¢ goes to the Mag 7 and 41¢ to the top 10. The 400 smallest companies share 23.5¢.
Diversified by name, concentrated by dollar.
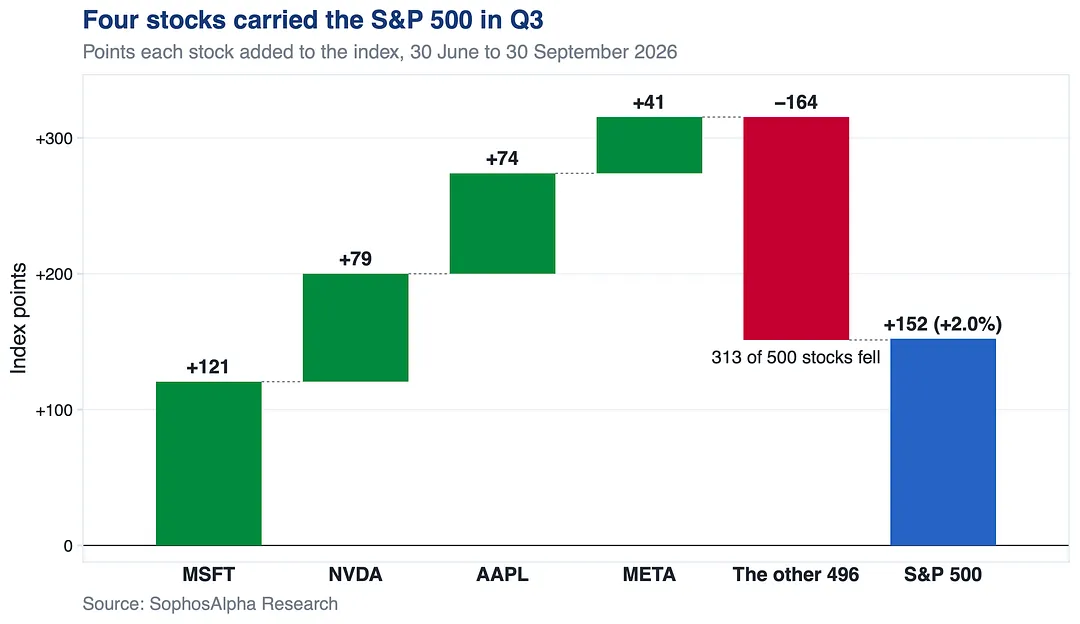
MSFT, NVDA, AAPL and META added 315 points, more than twice the index's entire gain. The other 496 took away 164, and 313 of the 500 fell.
The index rose 2%. The typical stock fell more than 4%.
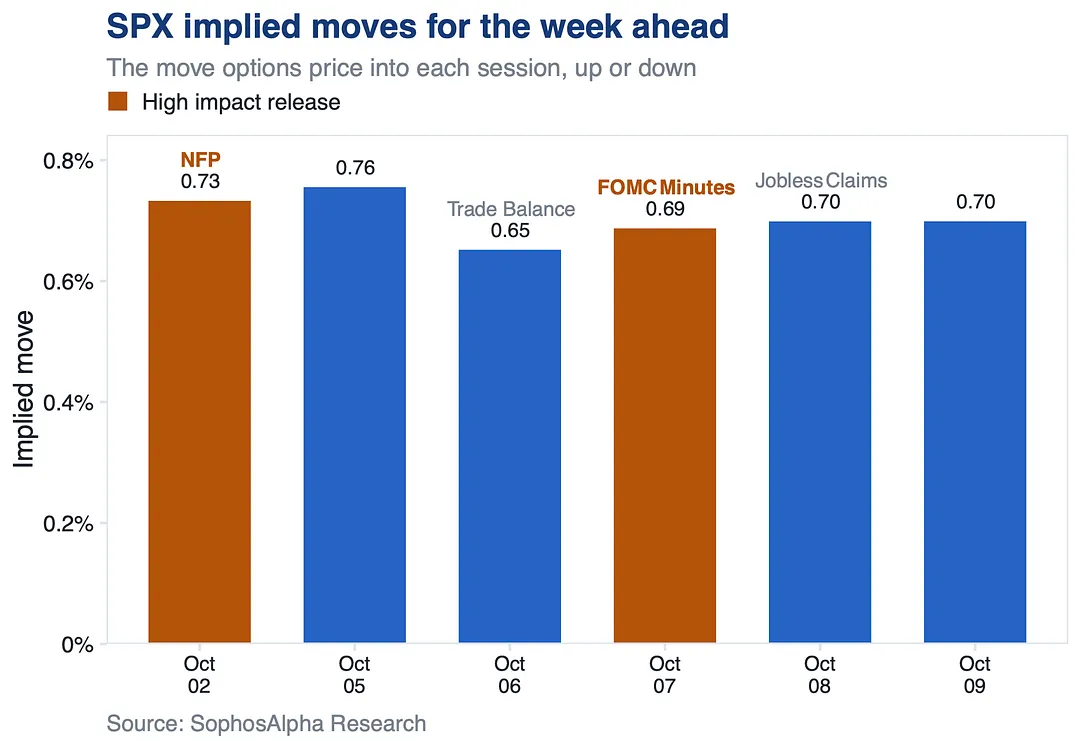
Options price a 0.73% SPX move on the day, about 56 points either way.
Next week: Trade Balance Tuesday (0.65%), FOMC Minutes Wednesday (0.69%) and Jobless Claims Thursday (0.70%).
11 notes
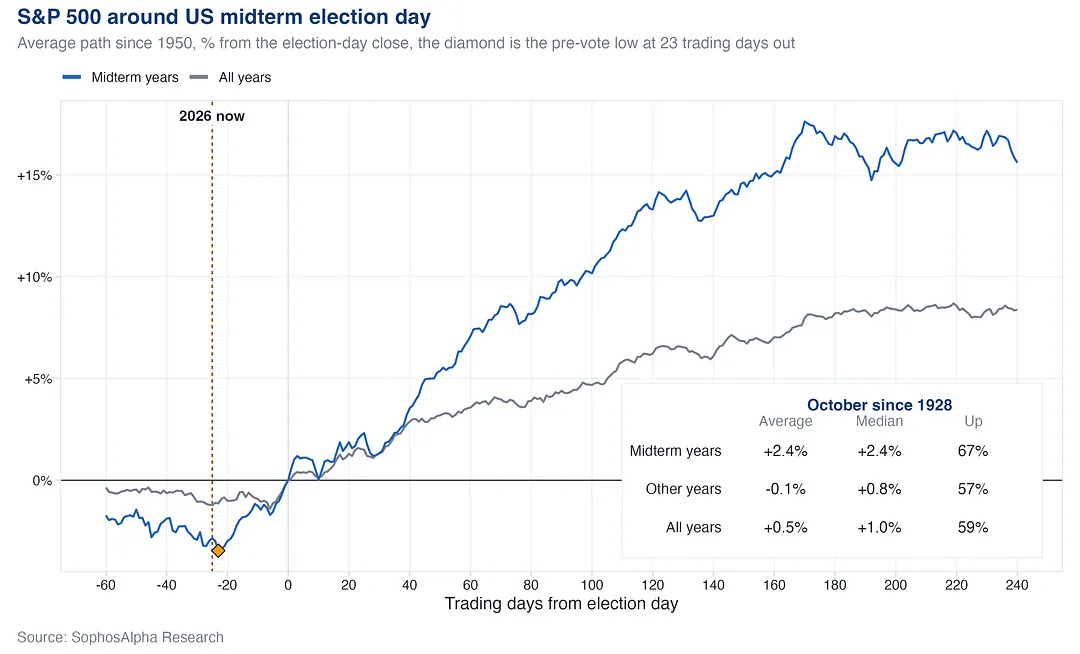
Since 1950 the S&P 500 has weakened into the vote, bottoming on average about 23 trading days before it, roughly mid October. 240 trading days after election day it stood 15.6% higher, almost double the 8.4% for all years.
2026 sits right where that pattern has typically started to improve.
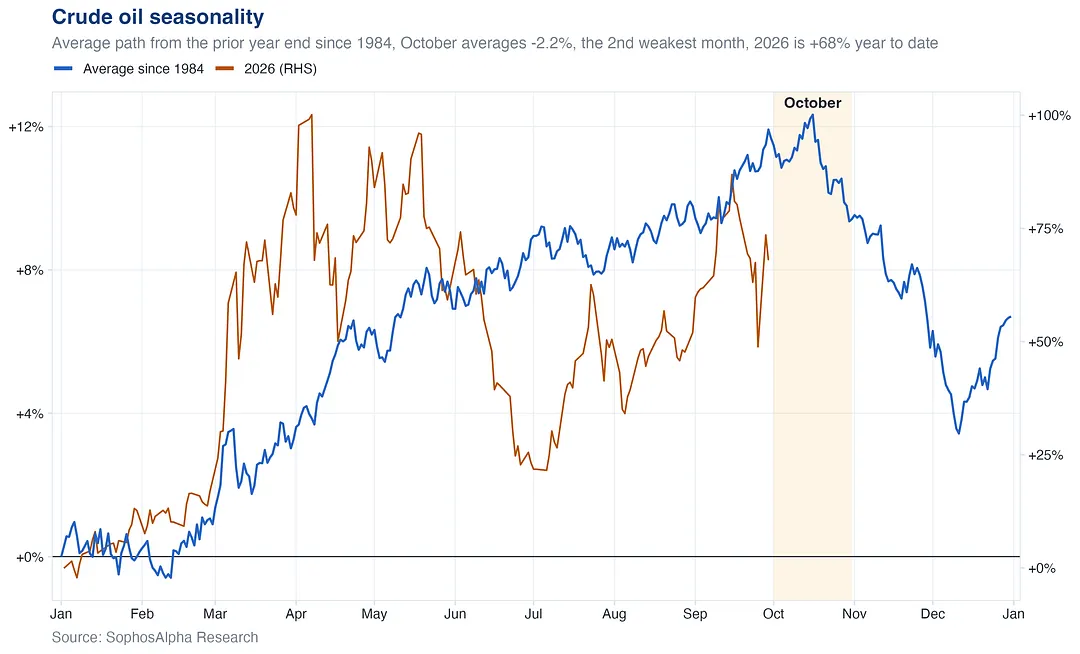
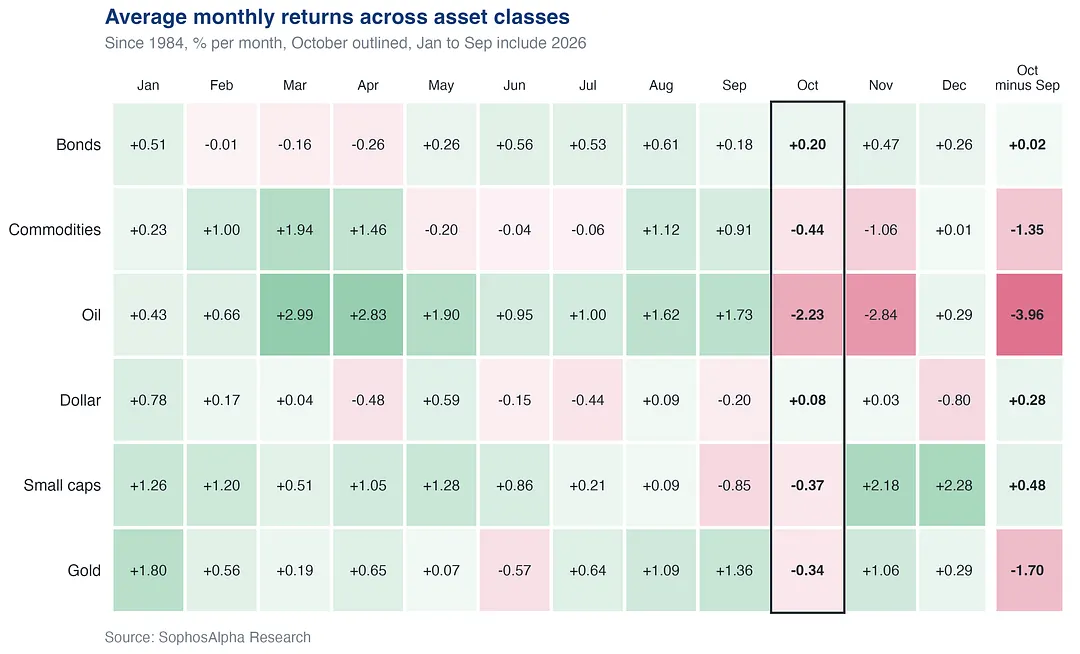
Since 1984, October has been a difficult month for commodities, down 0.44% on average, and especially crude oil, down 2.23%. Gold has also struggled, down 0.34%.
Treasury futures have posted a modest +0.20%, while the dollar has been broadly flat at +0.08%.
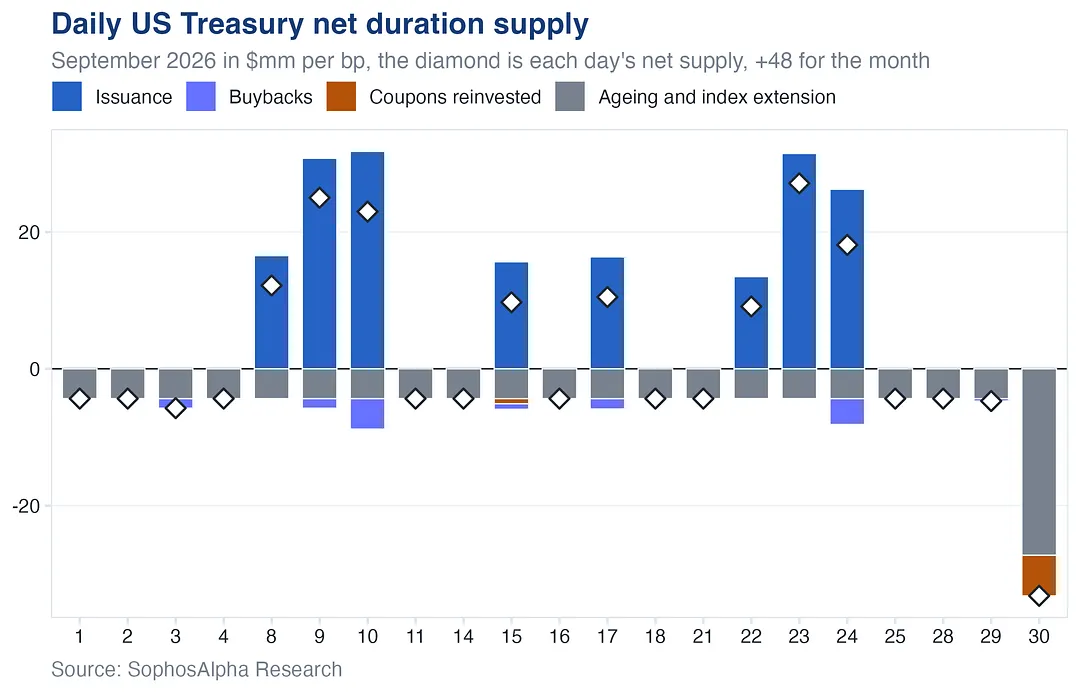
After coupons, ageing and index extension, net supply was +$48mn.
The 30 year auction on 10 September was the biggest supply day, alongside the first enlarged long end buyback: $5.2bn vs $2bn in August.
The supply impact is small. The signal is that Treasury is watching long end yields.
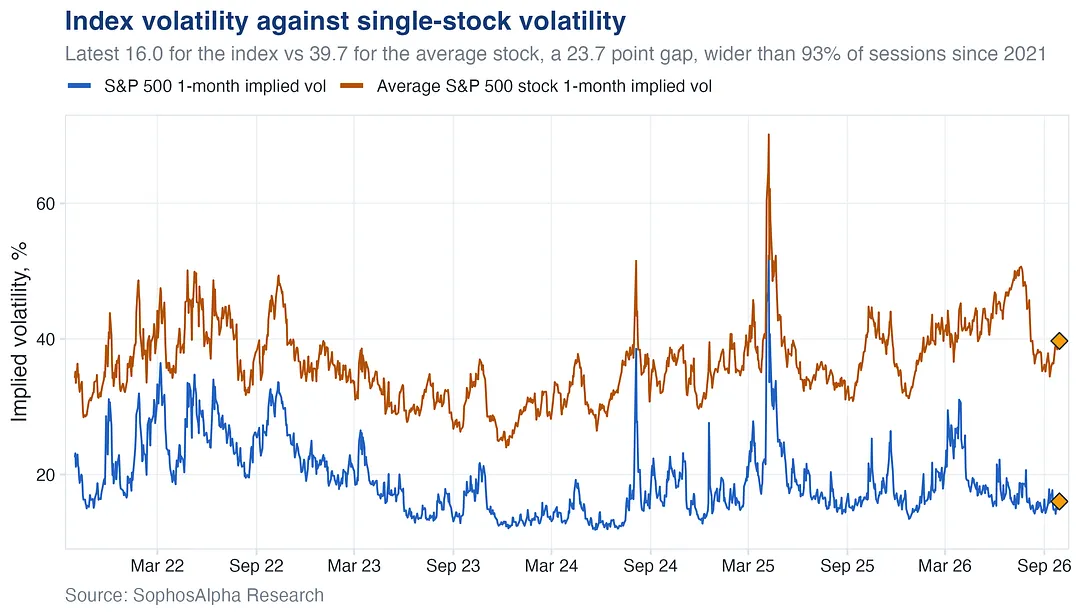
Its stocks are not.
Index implied vol sits at 16.0 while the average S&P 500 stock carries 39.7, a 23.7 point gap wider than 93% of sessions since 2021.
Big single stock moves are cancelling each other out at the index level. That calm only holds while stocks keep moving in different directions.
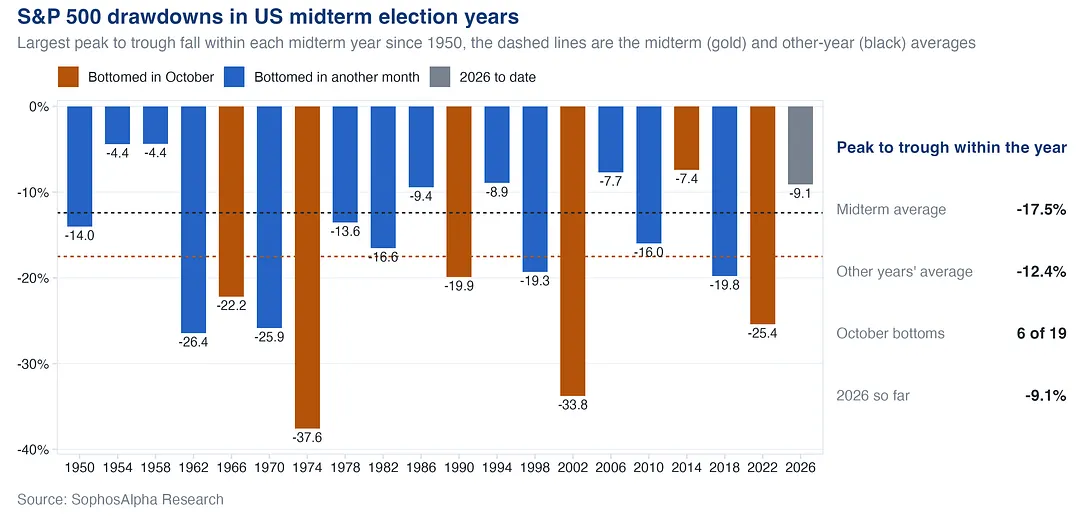
Since 1950 the S&P 500's peak to trough drawdown in midterm years has averaged 17.5%, against 12.4% in other years. 12 of the 19 midterm lows came in the third quarter or in October.
In midterm years, October has frequently coincided with the latter stages of significant corrections. 2026's drawdown so far: 9.1%.
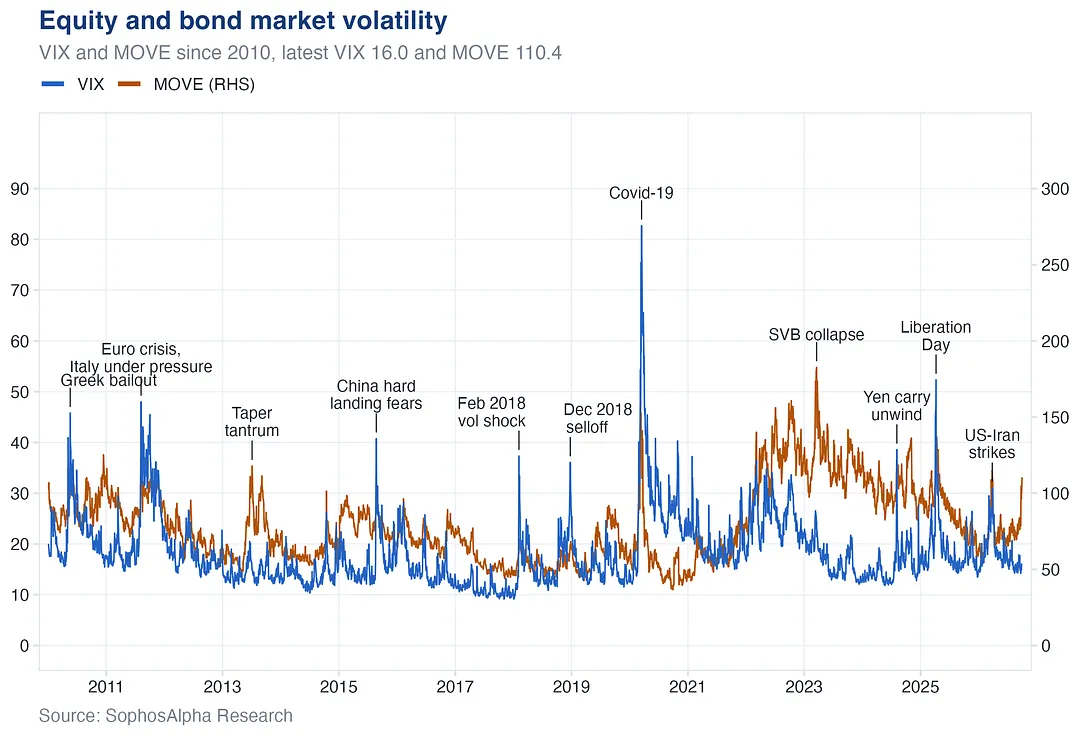
Right now they don't.
The MOVE is up 47% in September to 110, while the VIX sits at 16 with the S&P 500 within 2% of its record. MOVE only spikes come when the price of money itself is in question. When both spike, as with Covid and Liberation Day, trouble is more serious.
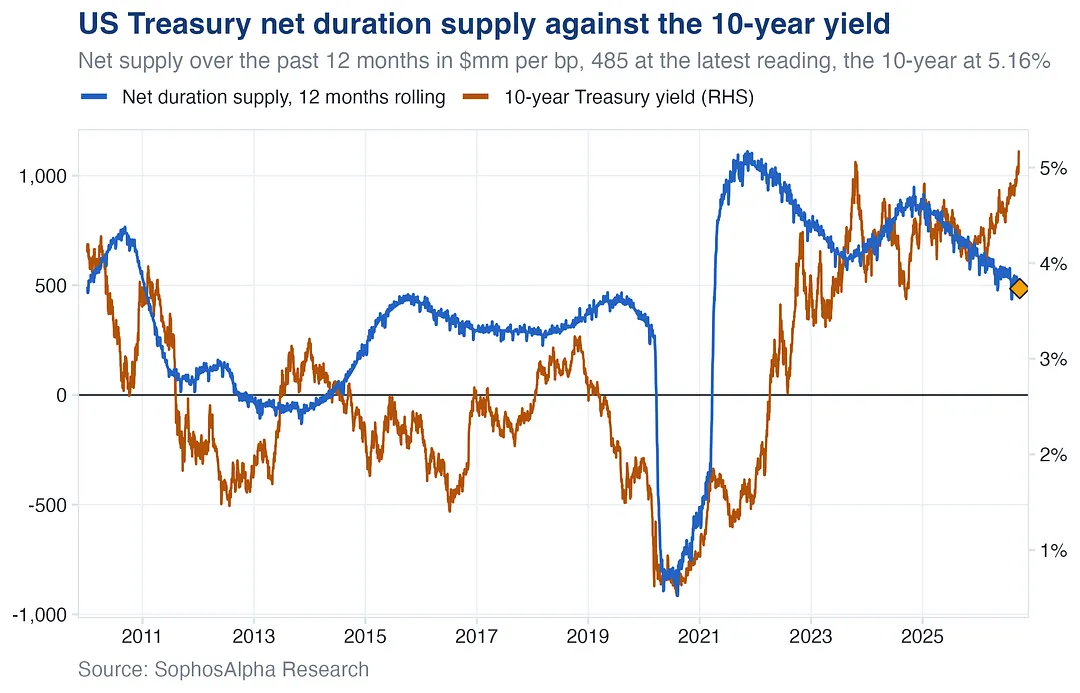
Net supply over the past 12 months is down to $485mn per bp from $949mn in November 2024, while the 10 year has gone from 4.45% to 5.16%.
Supply is set to keep falling as reinvestment demand from ageing, index extension and coupons rises, but it is still above anything seen from 2015 to 2019.
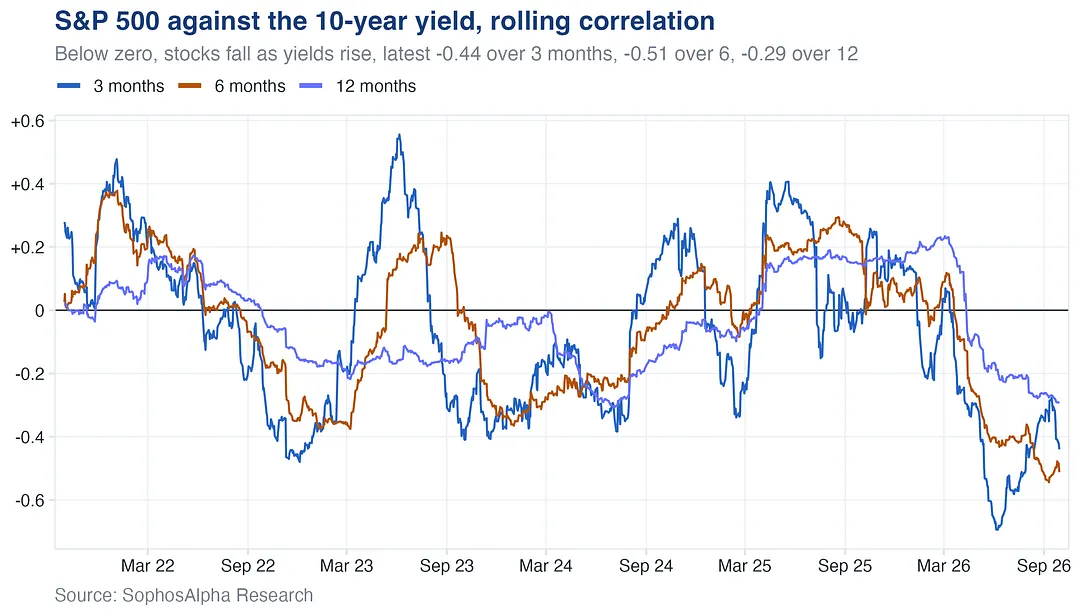
The 6 month correlation between the S&P 500 and the 10 year yield hit negative 0.54 this month, the lowest in at least five years. The 3 month sits at negative 0.44.
Yet 6 month implied equity/rates correlation is still priced near zero, leaving the stocks down, yields up outcome cheap as a hedge for sticky inflation, an energy shock or fiscal concerns.
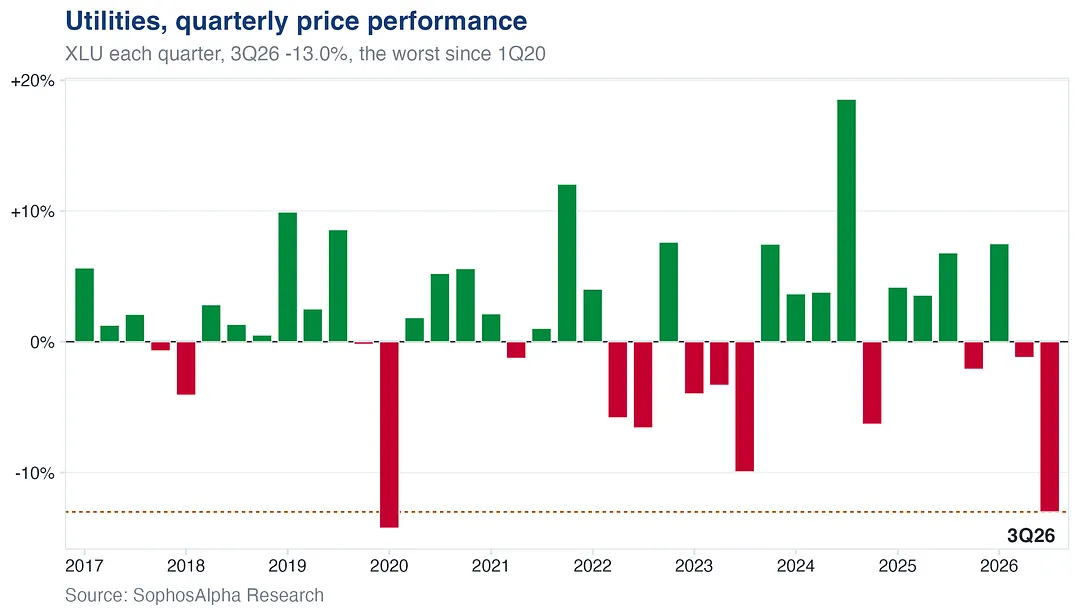
XLU fell 13.0% in Q3, the biggest quarterly drop since Q1 2020, after falling in each of the last three months, with September the worst at 6.6%.
Unfavorable legislation and the backup in rates weighed heavily. The 14 day RSI hit 22 last week, the most oversold since October 2023.
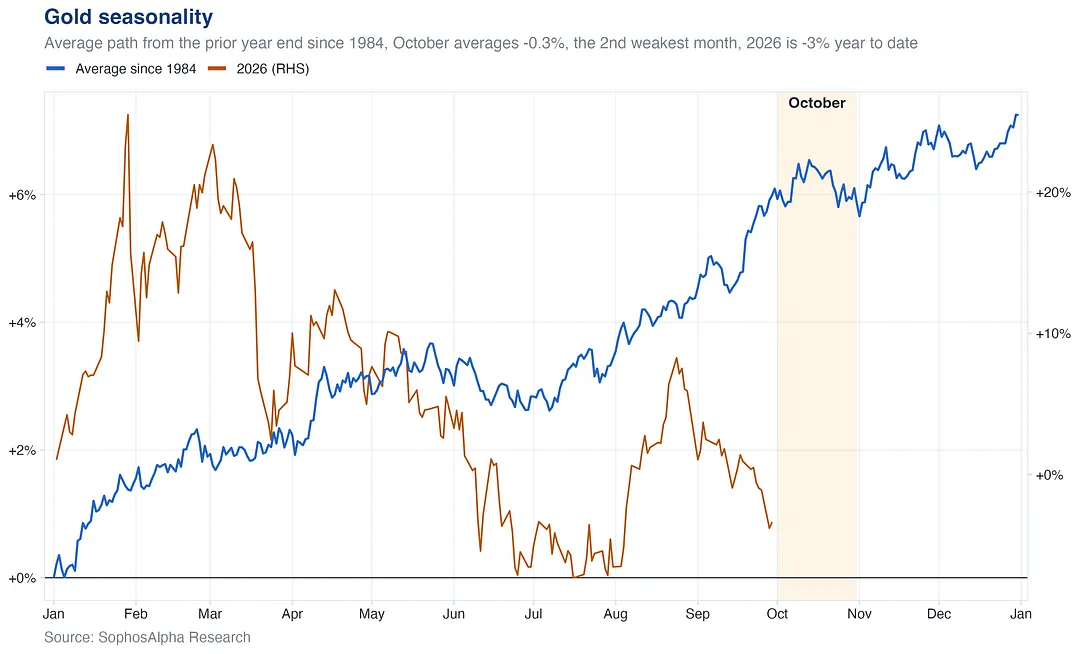
Since 1984, gold has averaged a 0.3% decline in October. 2026 has been anything but typical: up 25.5% at the end of January, down 7.3% by mid July, down 3.4% now.
With the 10 year yield closing above 5% for the first time since 2007 and the dollar firming, gold faces an unusually challenging rates backdrop.
Since 1984, oil has averaged a 2.2% decline in October, followed by an even weaker November at 2.8%.
In 2026 the seasonal signal has been overshadowed by the conflict between the US and Iran. Oil is up 68% this year, driven by the geopolitical risk premium rather than the calendar.