Sophos Alpha

Desk notes, September 2026

The desk notes of Sophos Alpha, an independent quantitative research desk. Daily market notes across many topics, including CTAs, risk parity, vol control and other systematic funds, hedge fund activity and investor sentiment, dealer gamma and liquidity, volatility and tail risk, in equities, rates, currencies and commodities.

September 2026

150 notes

6 notes

Each bank sees only its own clients, which can skew how anyone reads hedge fund flows from a single post.

Don't put too much weight on any one report.

Last week, Goldman's prime book had hedge funds selling US equities. Morgan Stanley's had them net buyers, led by Tech, with US L/S net leverage back up to 54% from 50%.

Health Care is the clearest gap: sold 6 weeks running at Goldman, large buying at Morgan Stanley, driven by short covering in high short interest biotech.
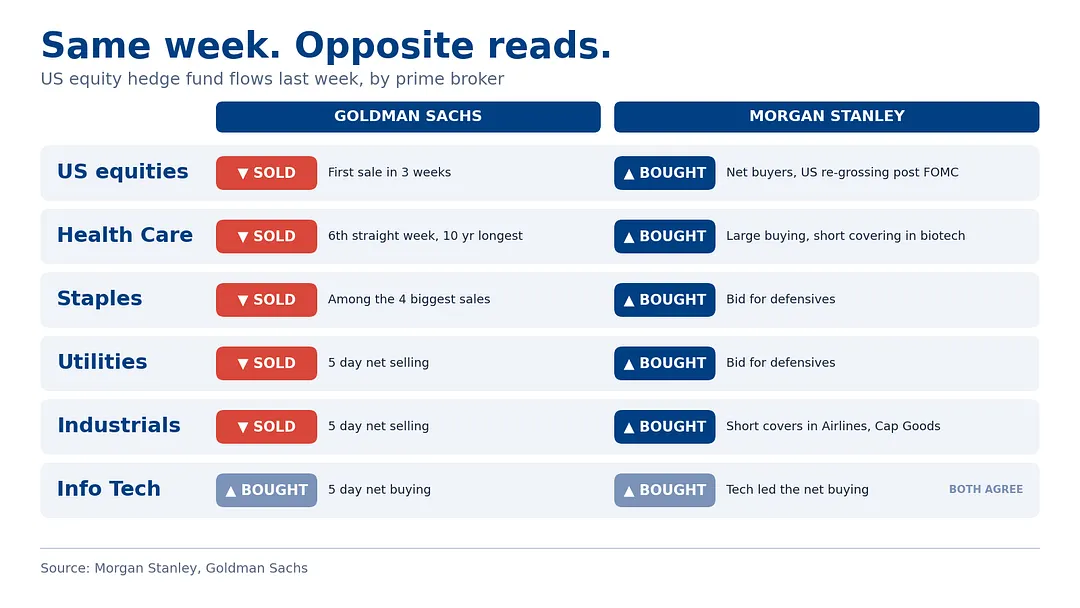
Each bank sees only its own clients, which can skew how anyone reads hedge fund flows from a single post.

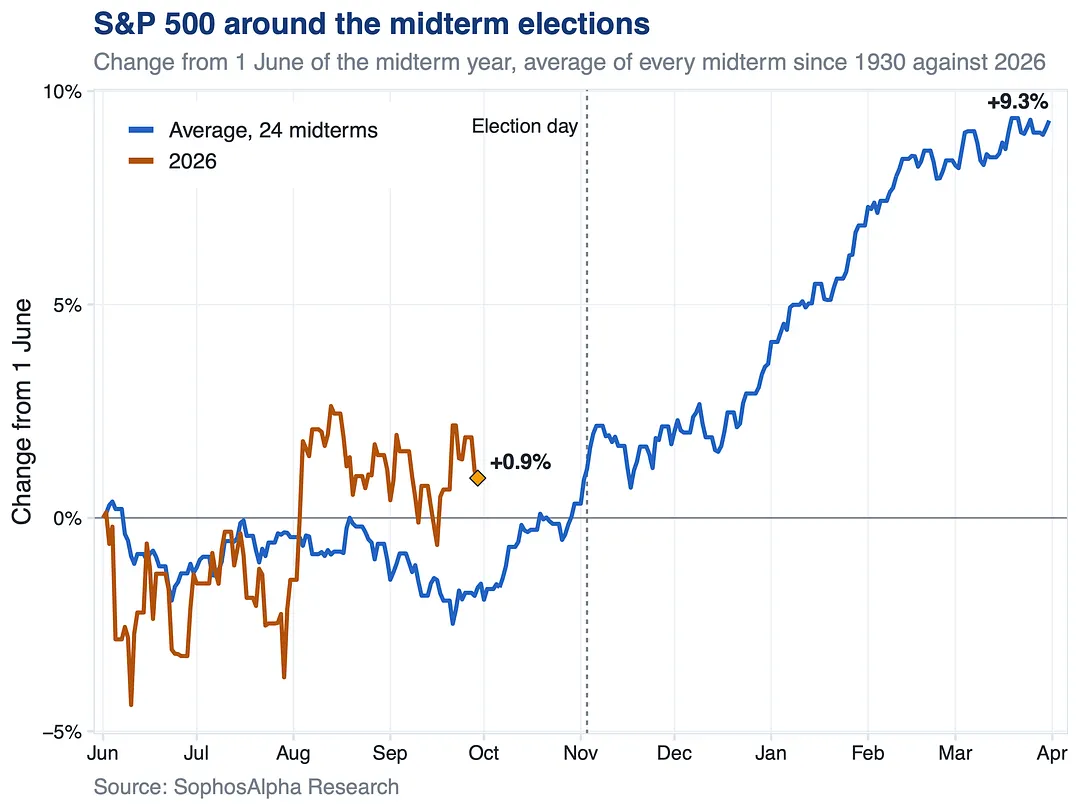
The S&P 500 rose from election day to the end of March in 19 of 24 midterms since 1930, by 8.2% on average.

2026 is already ahead of the pattern: up 0.9% since June 1, while the average midterm year is down 1.6% here.

The strongest stretch of the cycle starts in 5 weeks.

The S&P 500 rose from election day to the end of March in 19 of 24 midterms since 1930, by 8.2% on average.

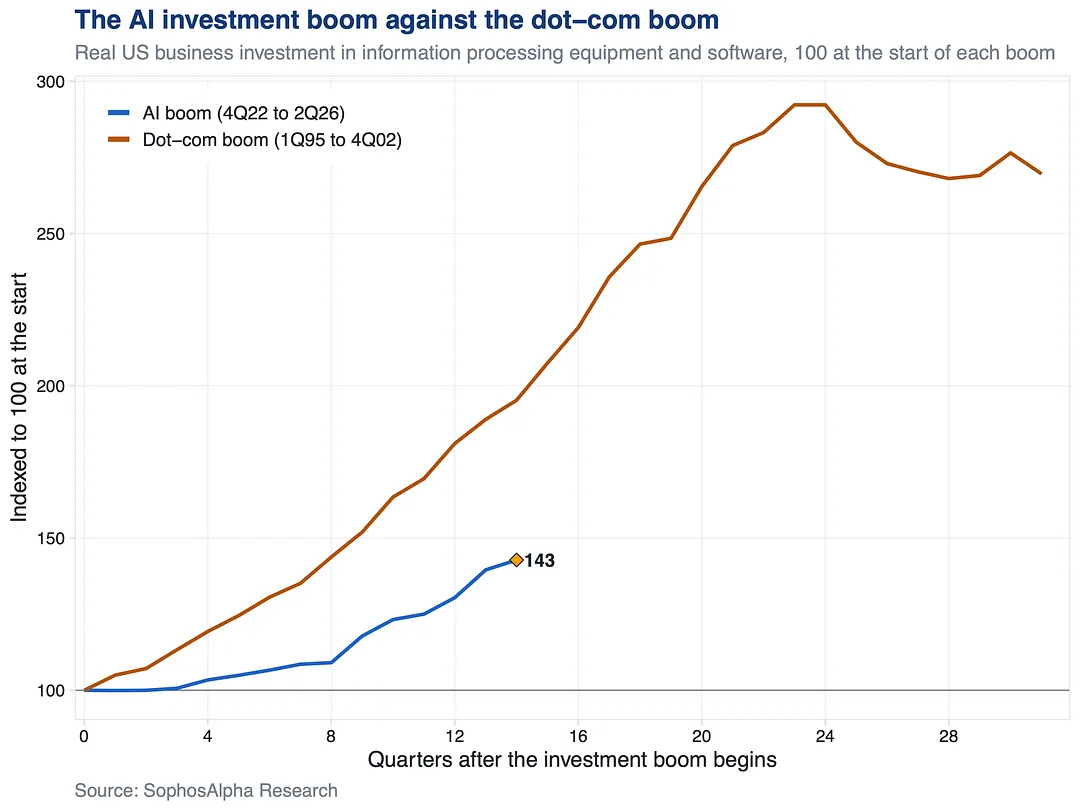
Three and a half years in, the AI investment boom is running at half the pace of the dotcom boom.

Real US investment in tech equipment and software is up 43% since late 2022. At the same point in the 1990s it was up 95%, and it nearly tripled by the peak.

Room left to grow.

Three and a half years in, the AI investment boom is running at half the pace of the dotcom boom.

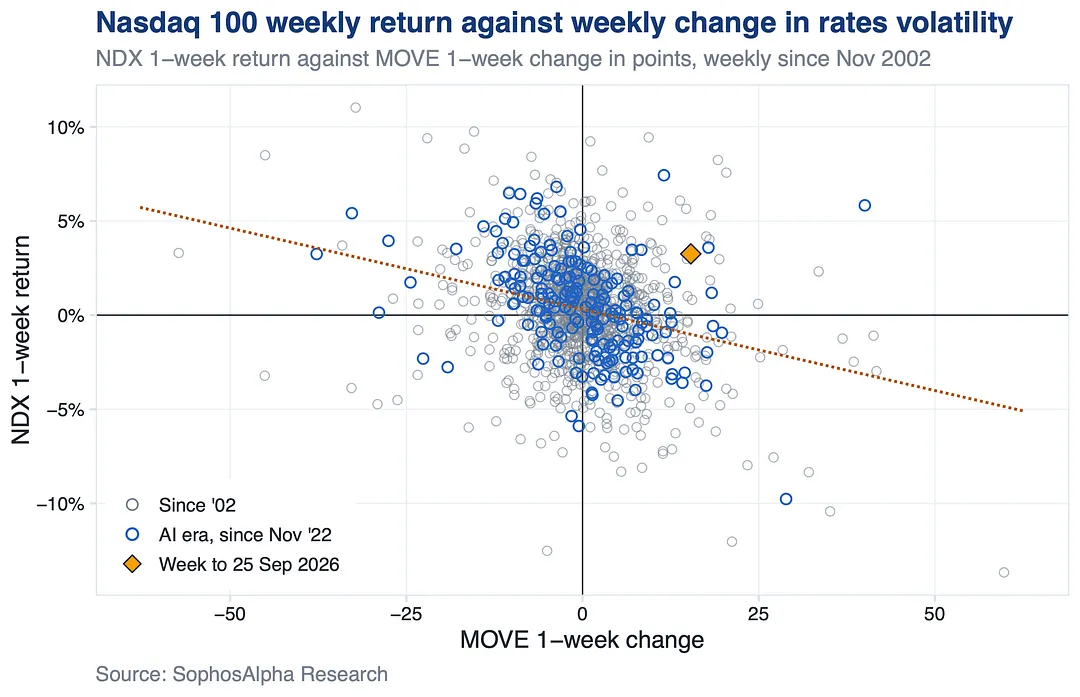
Yields jumped. Rates vol spiked.

The Nasdaq rallied over 3% anyway.

Agentic AI optimism carried it through last week, one more sign that macro faces a high bar to disrupt the AI trade.

Yields jumped. Rates vol spiked.

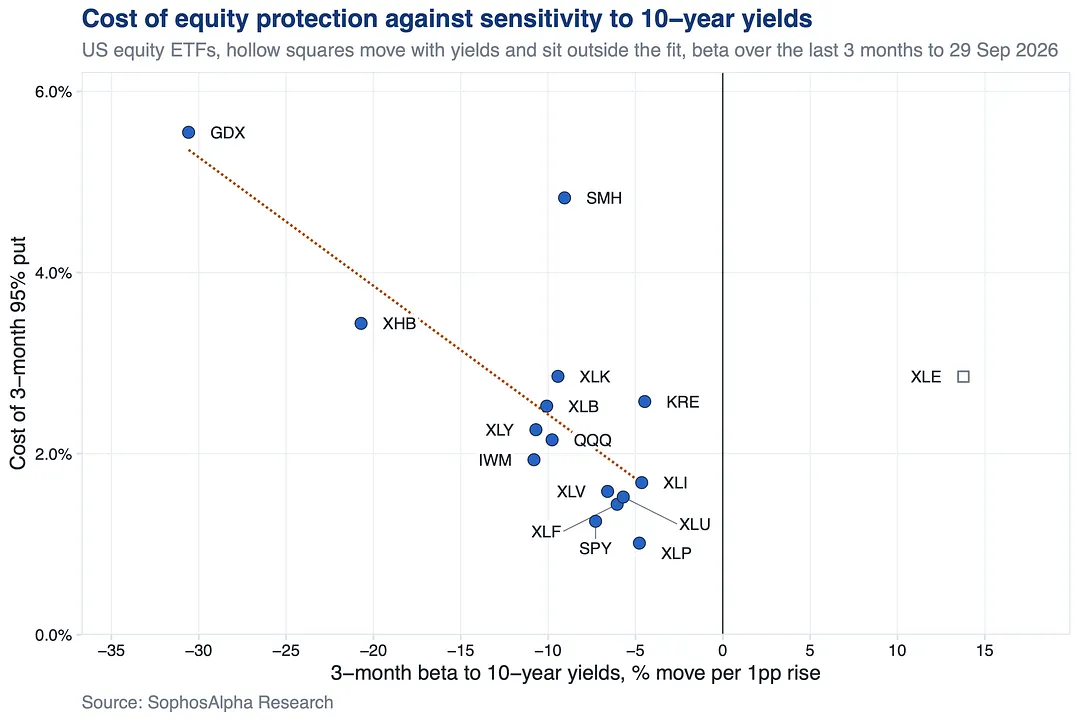
Small caps and consumer stocks are among the best value hedges if yields keep rising.

IWM and XLY are two of the most rate sensitive ETFs on the board, yet their puts cost less than that sensitivity implies.

Small caps and consumer stocks are among the best value hedges if yields keep rising.

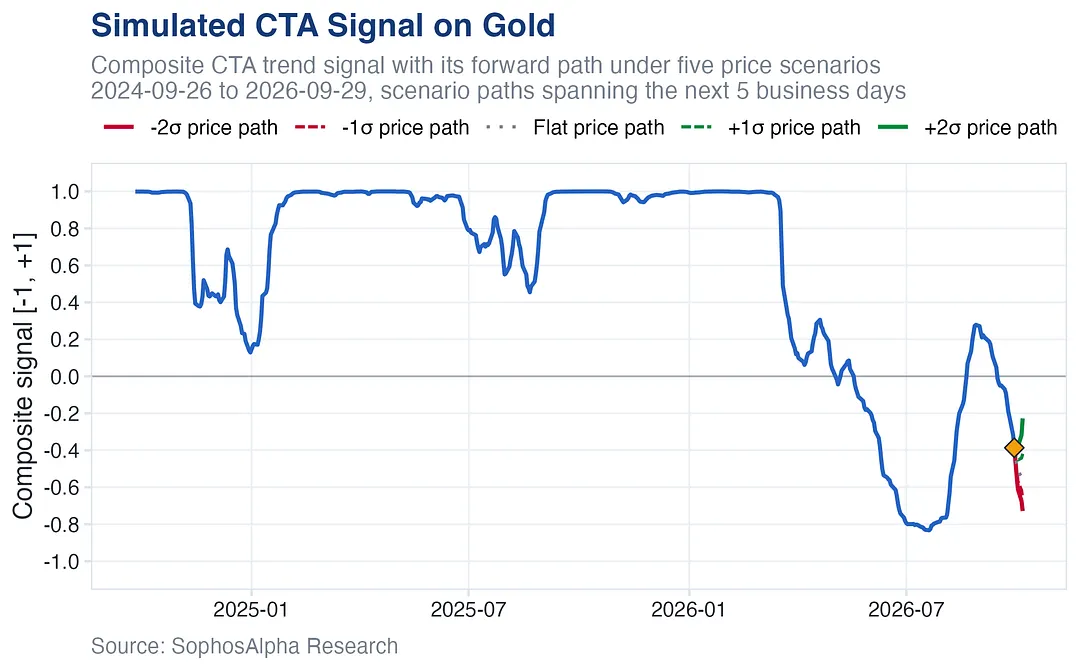
Managed money kept selling gold through September 22nd.

Other speculators provided the offset, helping stabilize price in the face of resilient real rates and a stronger dollar.

Then macro forces became too formidable. Longs liquidated. Option market dynamics point to hedging and/or outright shorting as well.

The presence of new downside positions and existing CTA shorts makes the tactical positioning debate less one sided. CTA net length already sits in negative territory, which limits how much selling more negative momentum can bring.

Managed money kept selling gold through September 22nd.

5 notes

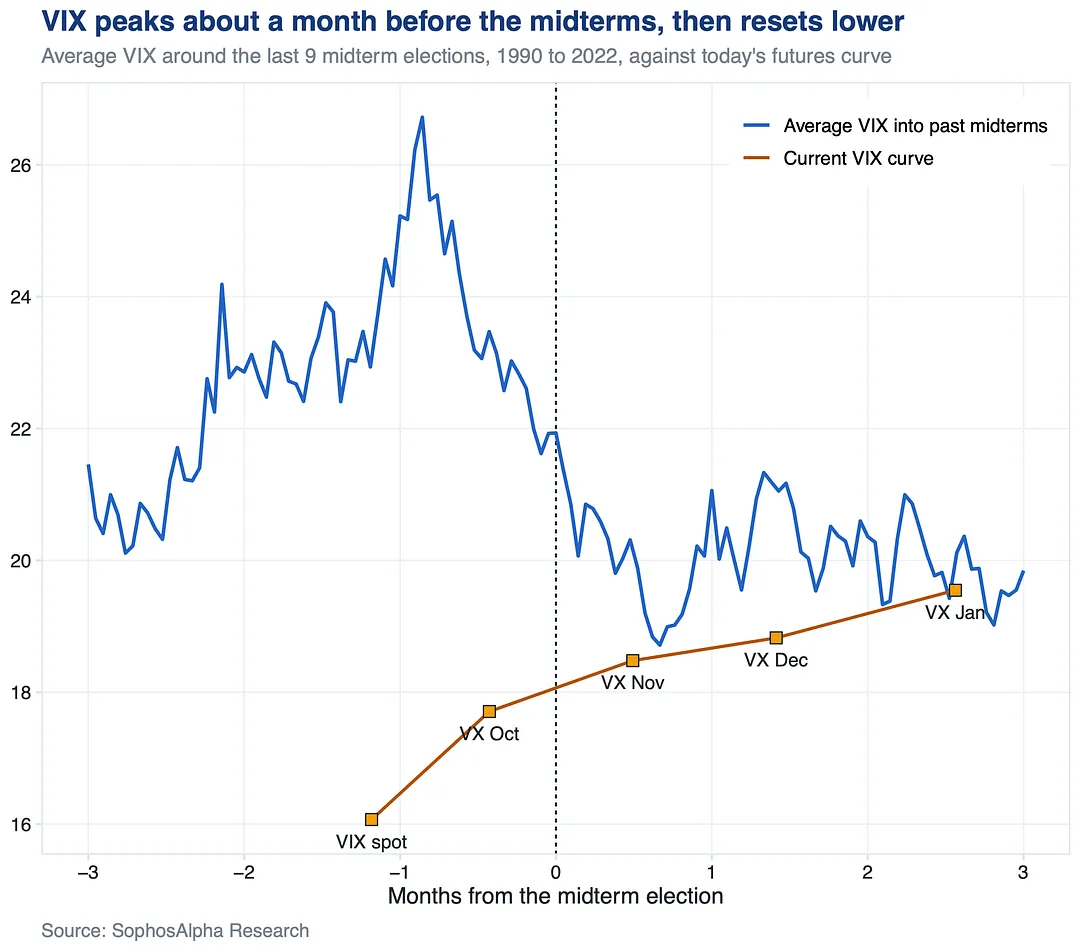
The midterms are 5 weeks away.

The VIX has typically peaked roughly one month before election day, then reset lower after the vote.

The midterms are 5 weeks away.

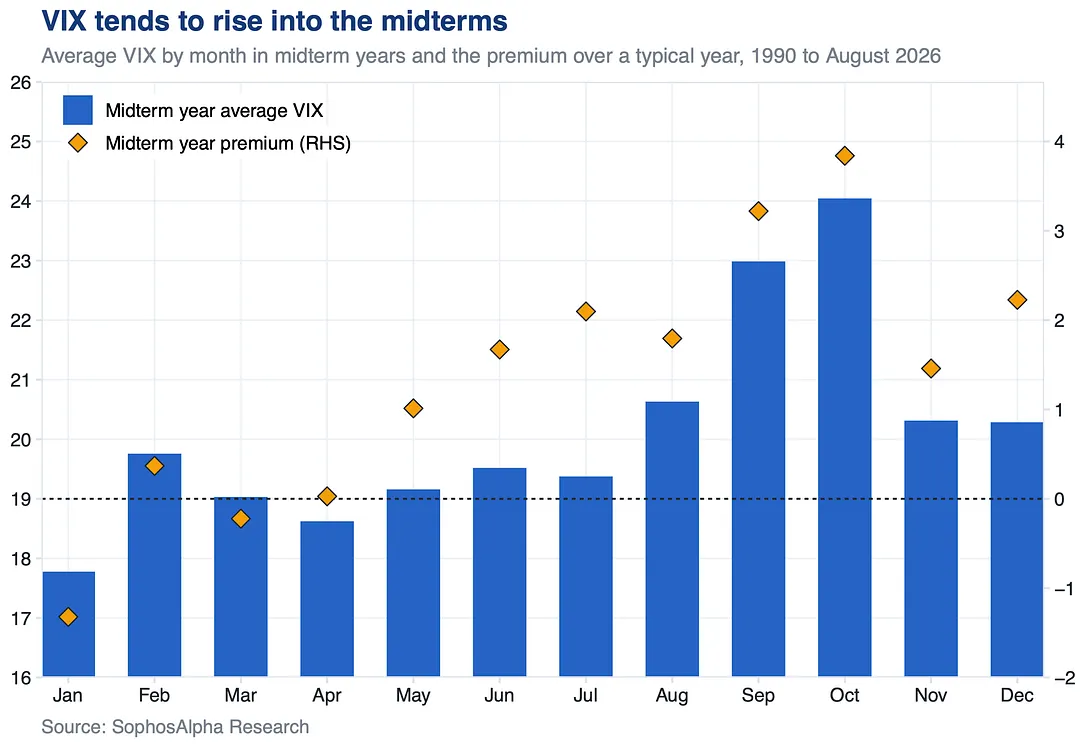
October is the most volatile month of a midterm year.

US equity volatility has tended to rise into the midterms, often trading above typical seasonality.

October is the most volatile month of a midterm year.

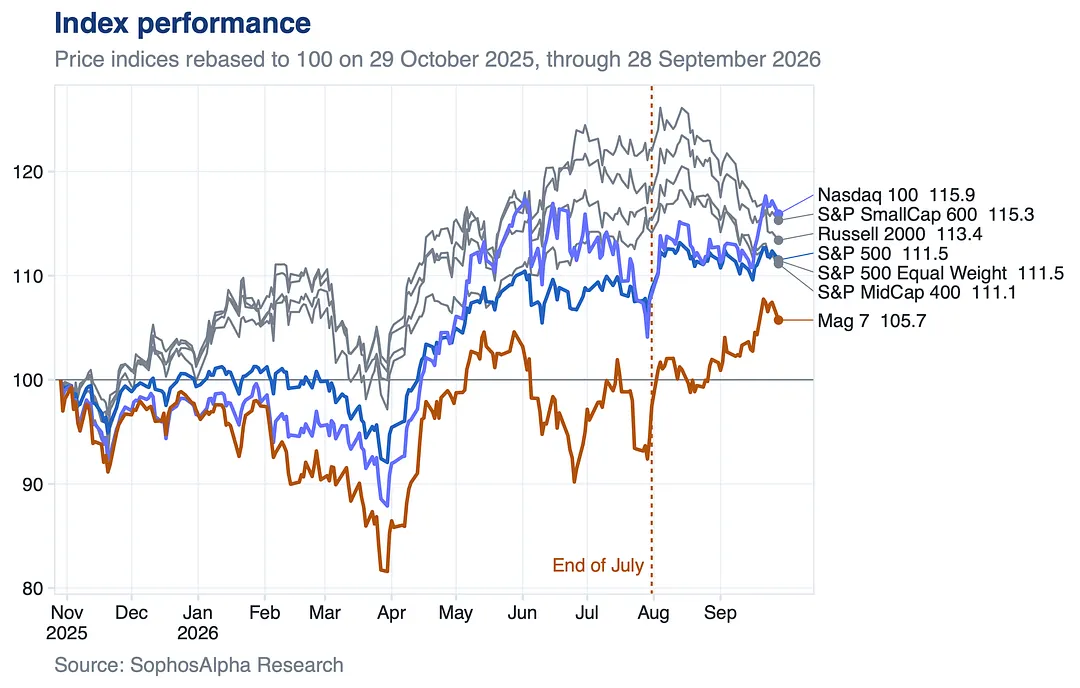
Tech is carrying the market while the rest sells off.

Since the end of July the Mag 7 is up 8.5% and the Nasdaq 100 7.1%. The average S&P 500 stock is down 2.3%, small caps 5.5%.

Yet the Mag 7 is still the weakest here since last October. Room to catch up if the rotation holds.

Tech is carrying the market while the rest sells off.

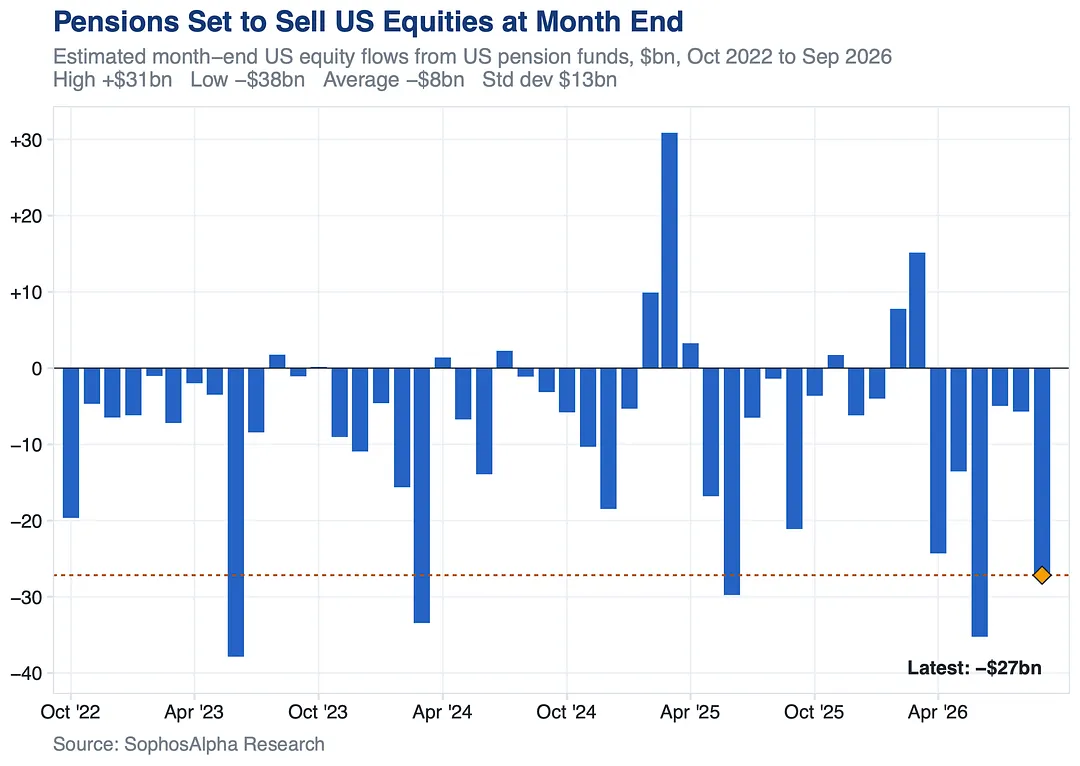
US pensions are set to sell $27bn of US stocks into month end.

This selling is forced. After a strong quarter for stocks, they have to trim back to their target mix, whatever their market view.

US pensions are set to sell $27bn of US stocks into month end.

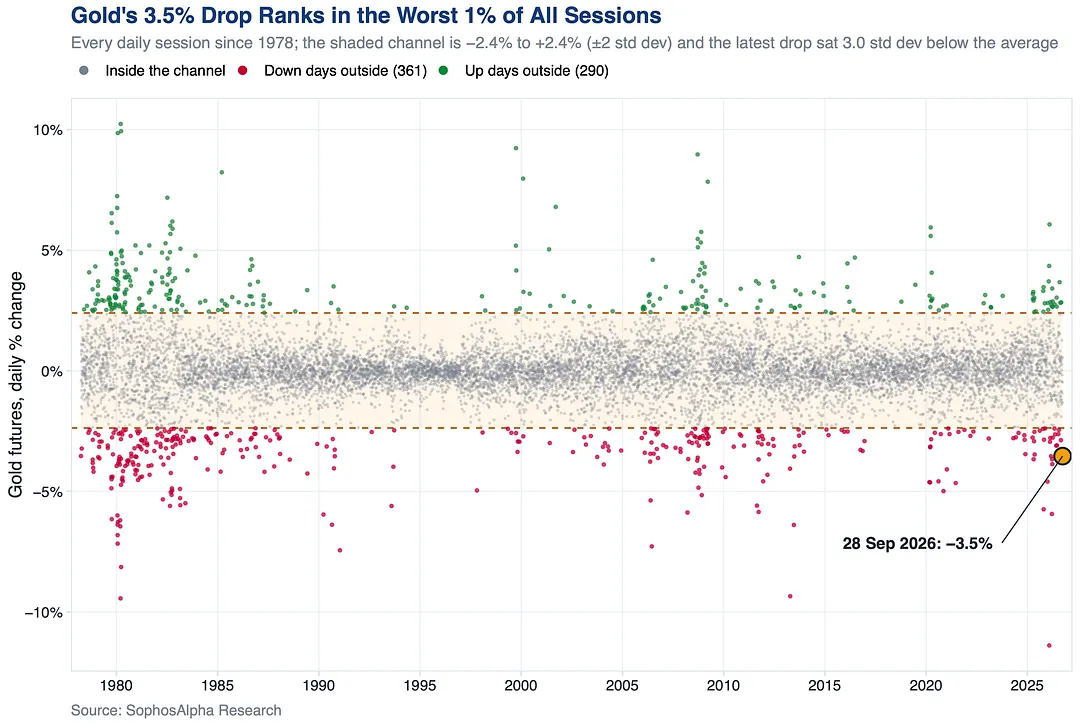
Gold fell 3.5% on Monday.

Only 125 sessions since 1978 were worse.

That was the 7th drop this big in 2026, the most in any year since 2008. And 44 sessions landed outside the channel over the last 12 months.

Gold hasn't traded this wild since 2009.

Gold fell 3.5% on Monday.

9 notes

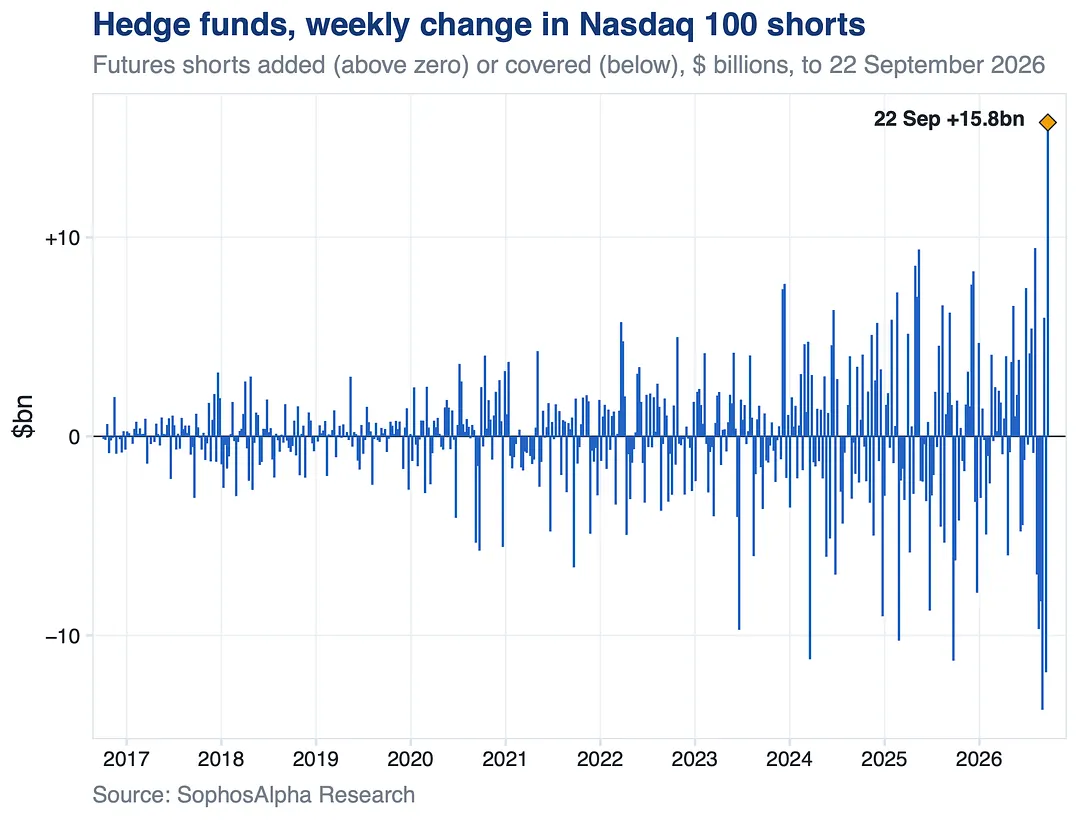
⚠️ Hedge funds met the Nasdaq's record high with the most new shorts in over a decade.

They added $15.8bn of Nasdaq futures shorts in the week to September 22, the day the index closed at a record, right after weeks of covering.

If the rally keeps going, those shorts become fuel.

⚠️ Hedge funds met the Nasdaq's record high with the most new shorts in over a decade.

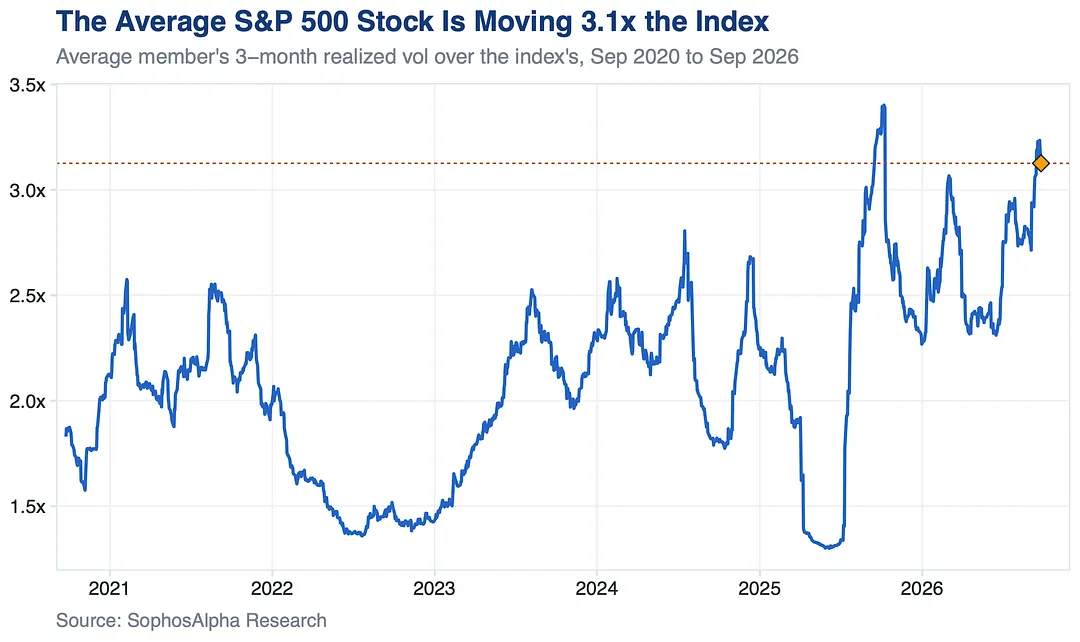
The average S&P 500 stock is swinging about three times harder than the index, near the widest gap in years.

Big moves in single names cancel each other out, so the index looks calm while stocks whip around below. It's why so many stock pickers trail the benchmark this year.

The average S&P 500 stock is swinging about three times harder than the index, near the widest gap in years.

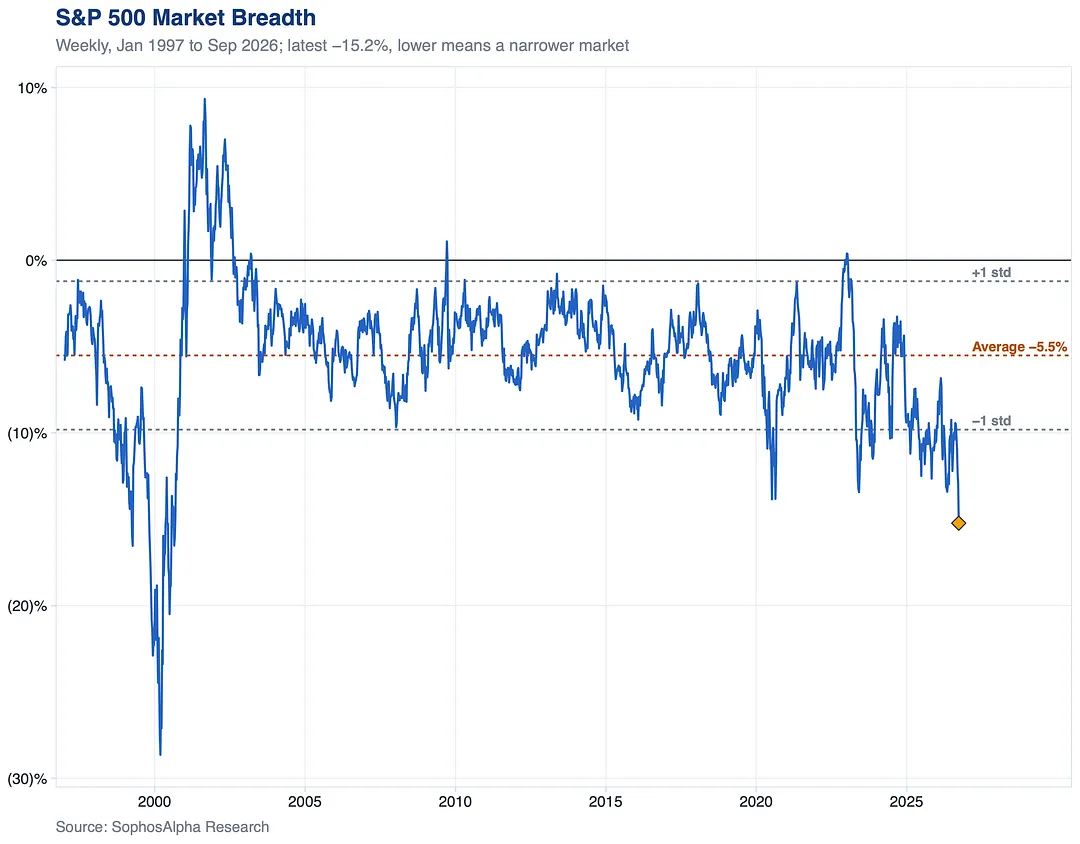
S&P 500 breadth just hit its worst level since the dot com bubble.

AI strength has kept the index near its highs, but the typical stock inside it now trades about 16% below its own 52 week high. The index hasn't run this far ahead of the median stock since 2000.

That gap is also the setup. With so many stocks left behind, there is room for broad market upside and a catch up in the laggards, as long as macro uncertainty doesn't accelerate from here.

S&P 500 breadth just hit its worst level since the dot com bubble.

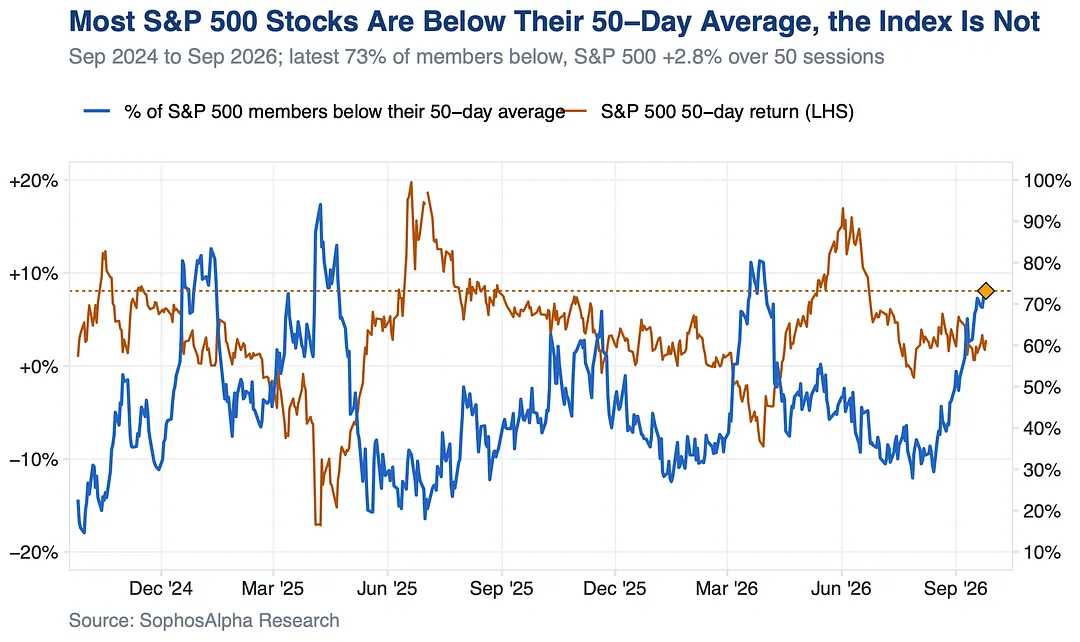
Most S&P 500 stocks are in a downtrend while the index sits near record highs.

Over 70% of members trade below their 50 day average, yet the S&P 500 is still up over that stretch. A handful of giants carry everything. Under the surface this market is weaker than the headline.

Most S&P 500 stocks are in a downtrend while the index sits near record highs.

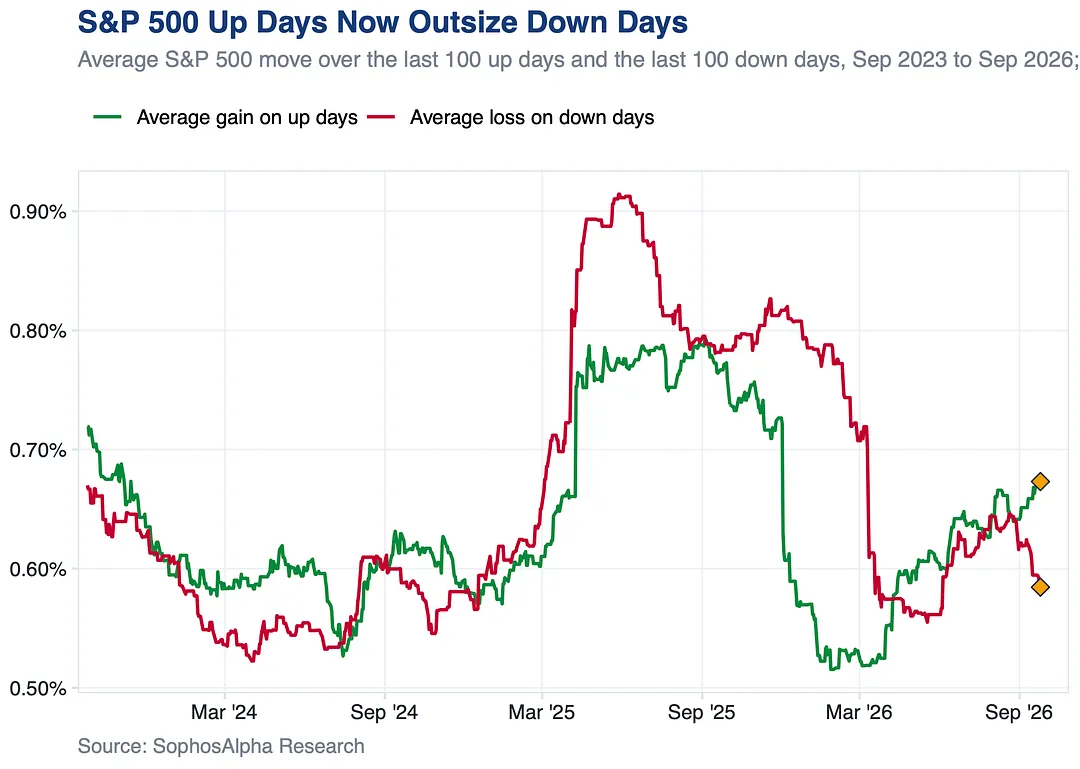
The S&P 500 is rising harder than it falls again.

Its average up day is now bigger than its average down day, a full flip from last spring when selloffs did the damage. Investors are still underweight, so when the market rallies, they chase.

The S&P 500 is rising harder than it falls again.

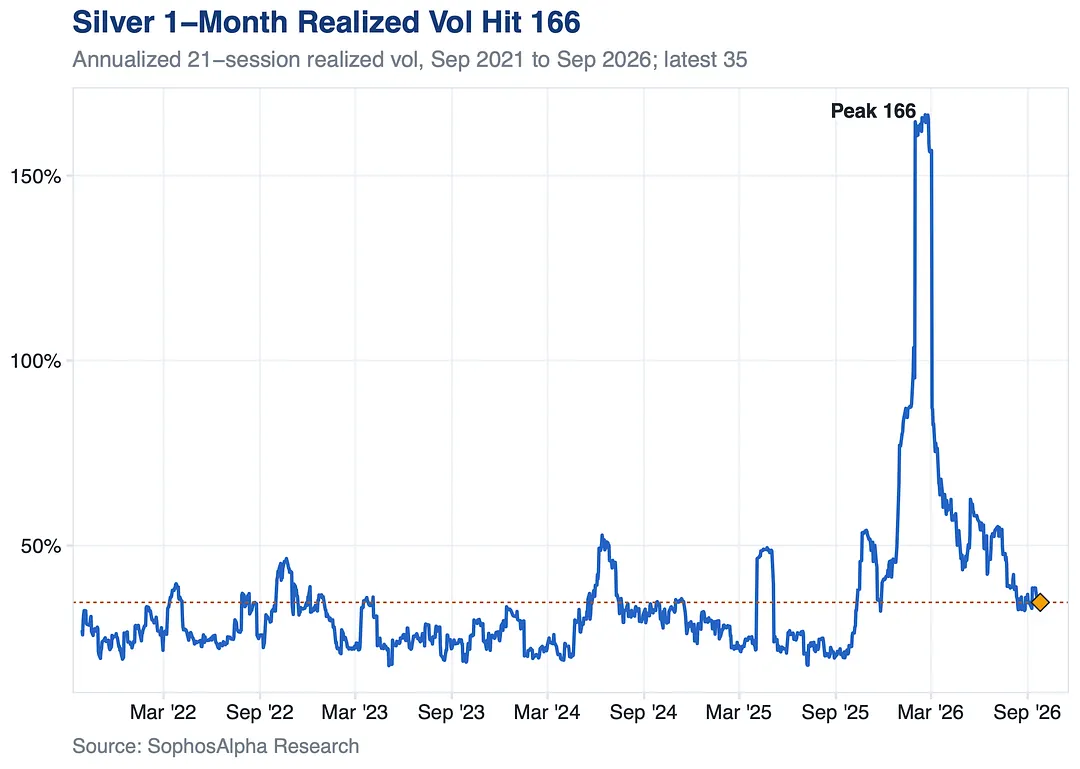
Silver's wild ride is over, for now.

Earlier this year its swings hit the most extreme level in at least five years, moving more like a meme stock than a metal. It has since cooled all the way back to its normal range.

Silver's wild ride is over, for now.

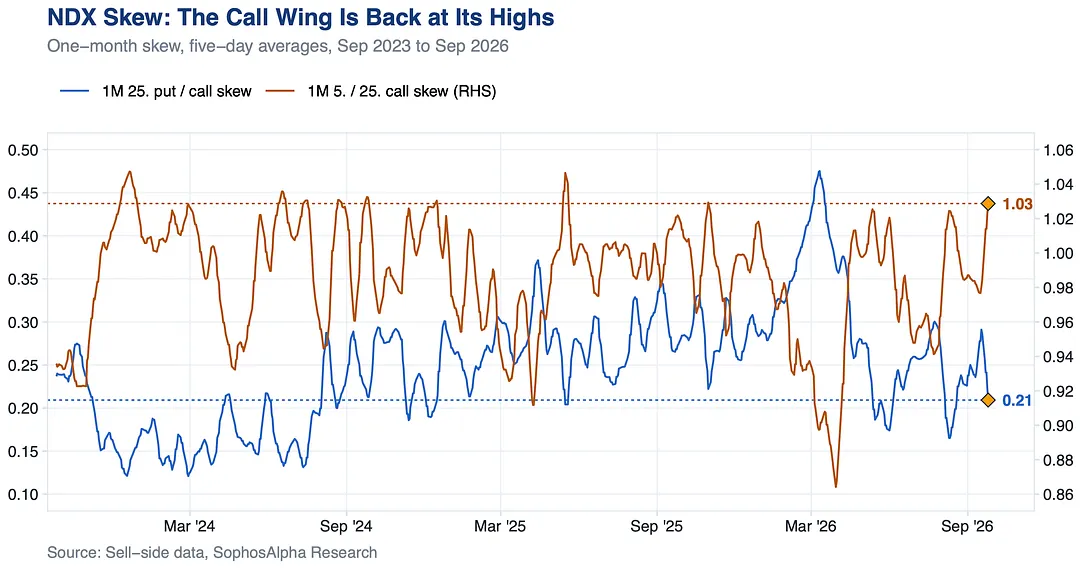
Traders are chasing Nasdaq upside on agentic AI, and positioning is still light.

Far out of the money NDX calls are priced near their richest in 3 years. Last week also brought the 3rd largest 1 month put call skew drop on record and the first record close since June.

Traders are chasing Nasdaq upside on agentic AI, and positioning is still light.

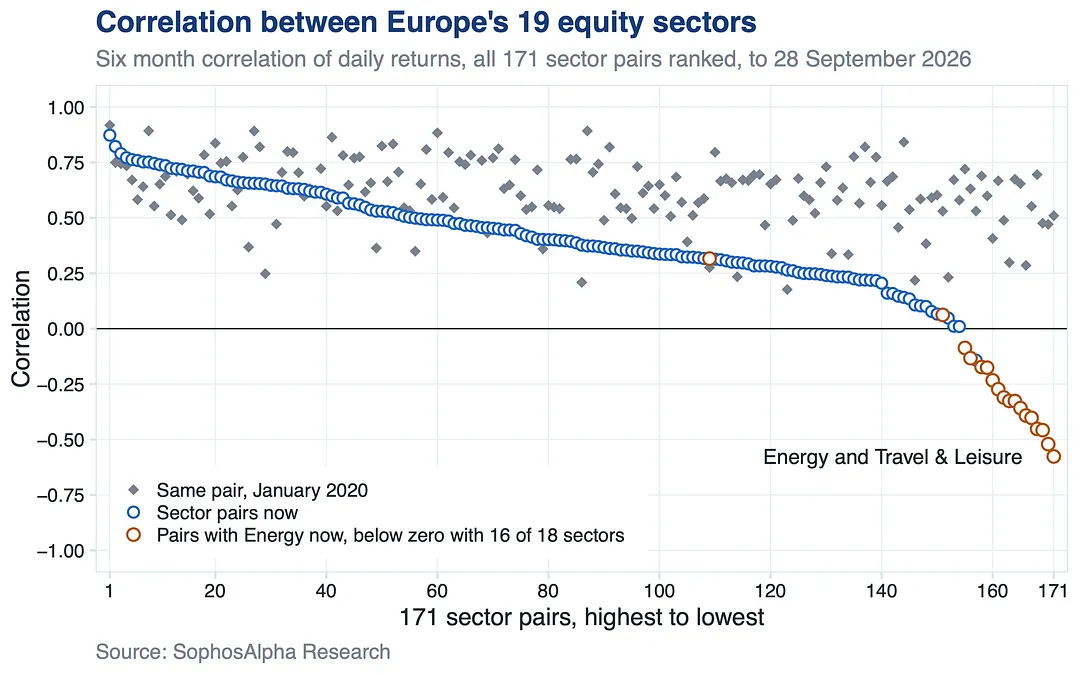
Energy is the only real hedge left inside European stocks.

Over the last six months it moved against 16 of the other 18 sectors and against the STOXX 600 itself. Since 2008 it had never moved against more than 5.

As long as oil drives this market, Energy offsets the rest.

Energy is the only real hedge left inside European stocks.

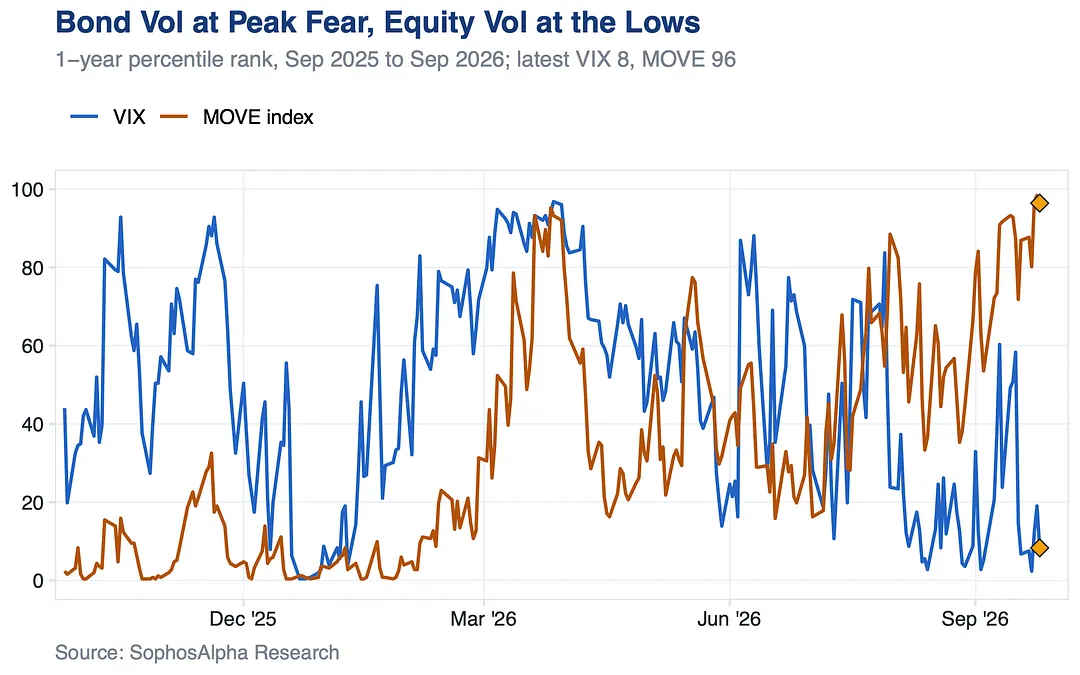
The bond market is flashing fear.

The stock market isn't.

Treasury volatility sits near its highest reading of the past year while the VIX sits near its lowest. Bonds are pricing trouble that stocks are shrugging off. That gap is the one to watch into year end.

The bond market is flashing fear.

one note

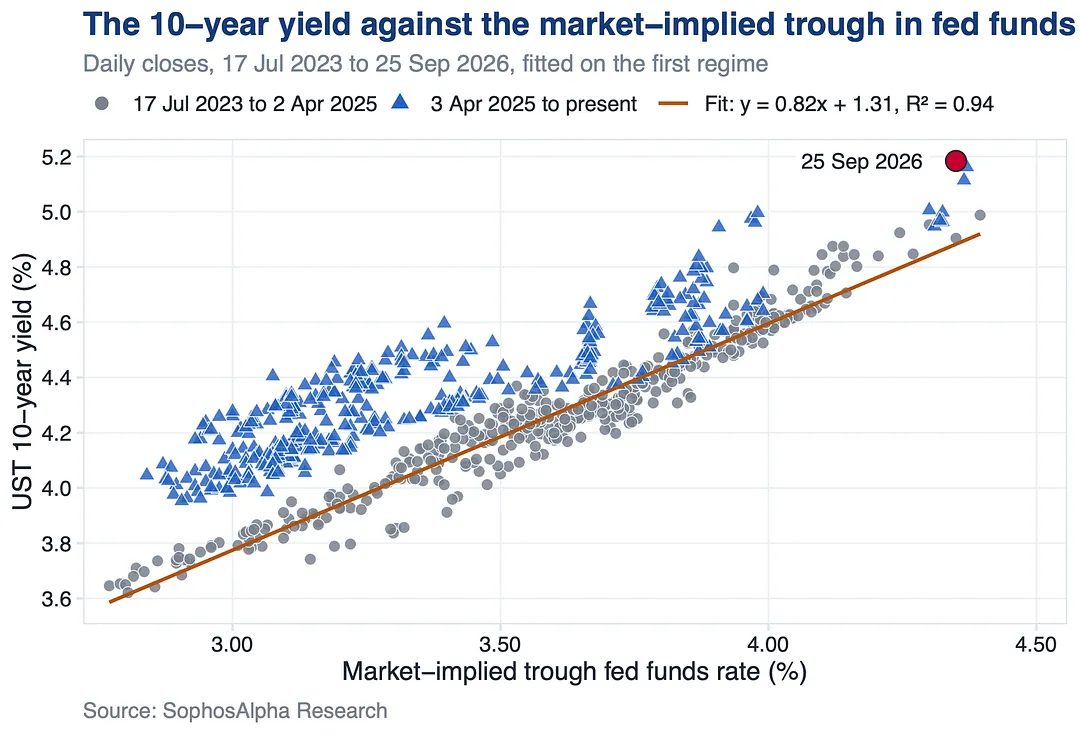
The 10 year yield closed at 5.18%, the highest since July 2007, and it is trading on where the market sees the Fed.

It still sits 30bp above the line it held against the lowest rate futures price for the Fed from 2023 until April 2025.

The 10 year yield closed at 5.18%, the highest since July 2007, and it is trading on where the market sees the Fed.

one note

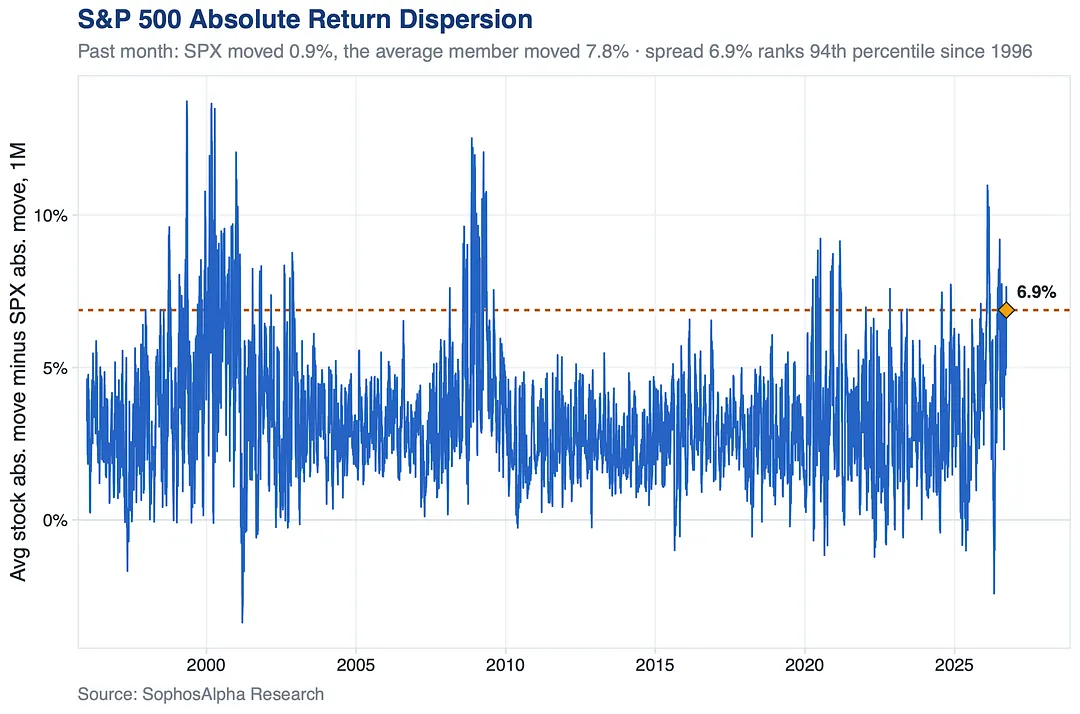
The average S&P 500 stock moved 7.8% over the past month.

The index moved 0.9%.

That gap ranks 94th percentile since 1996. It has held above 5 points on 58% of sessions this year, versus 14% over the prior 30 years.

Stocks are cancelling each other out. The index looks calm.

The average S&P 500 stock moved 7.8% over the past month.

9 notes

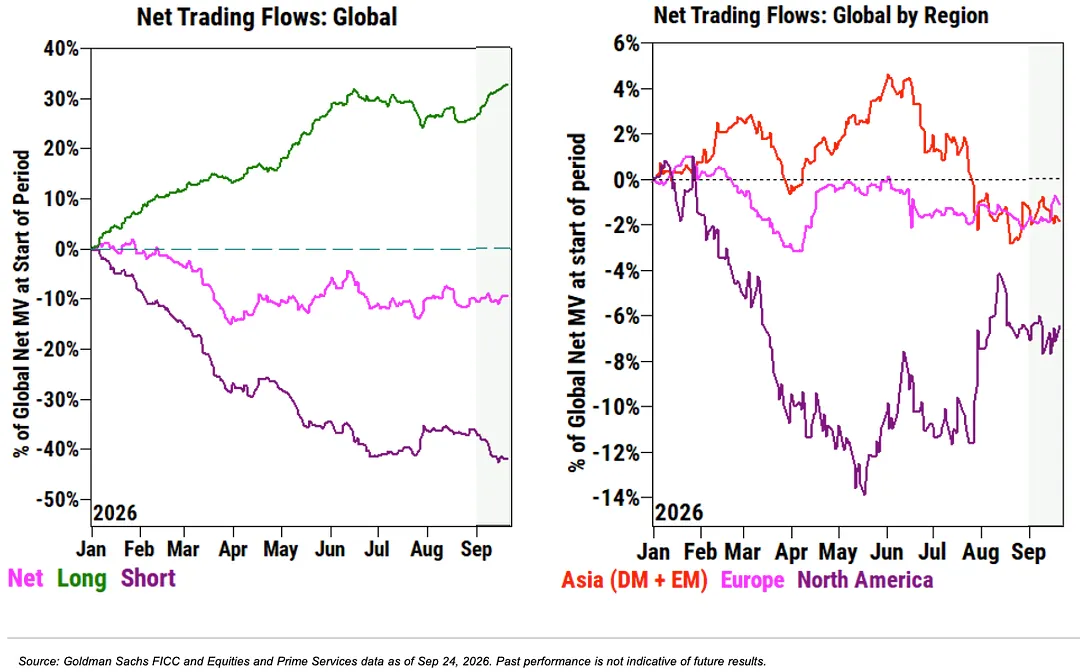
Hedge funds have spent most of 2026 shorting stocks faster than they buy them.

September is tilting the other way. Long buying is outpacing new shorts again, with Europe leading the buying while Asia is still being sold.

With net exposure still light, there is room for more.

Hedge funds have spent most of 2026 shorting stocks faster than they buy them.

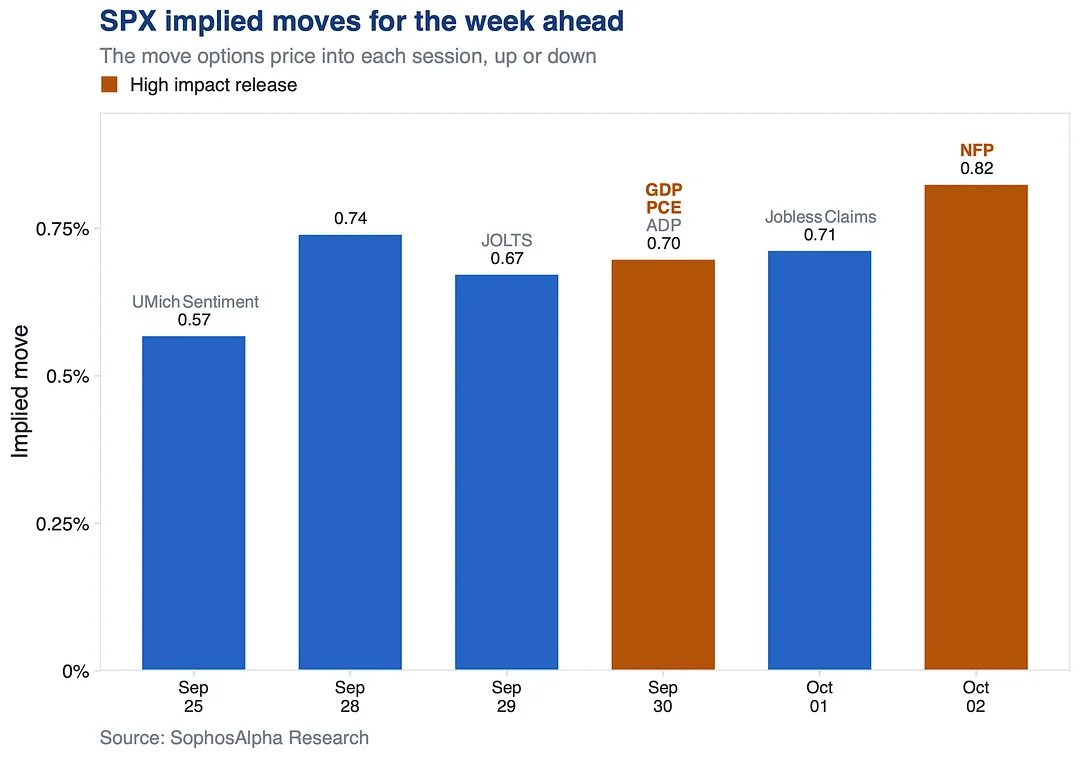
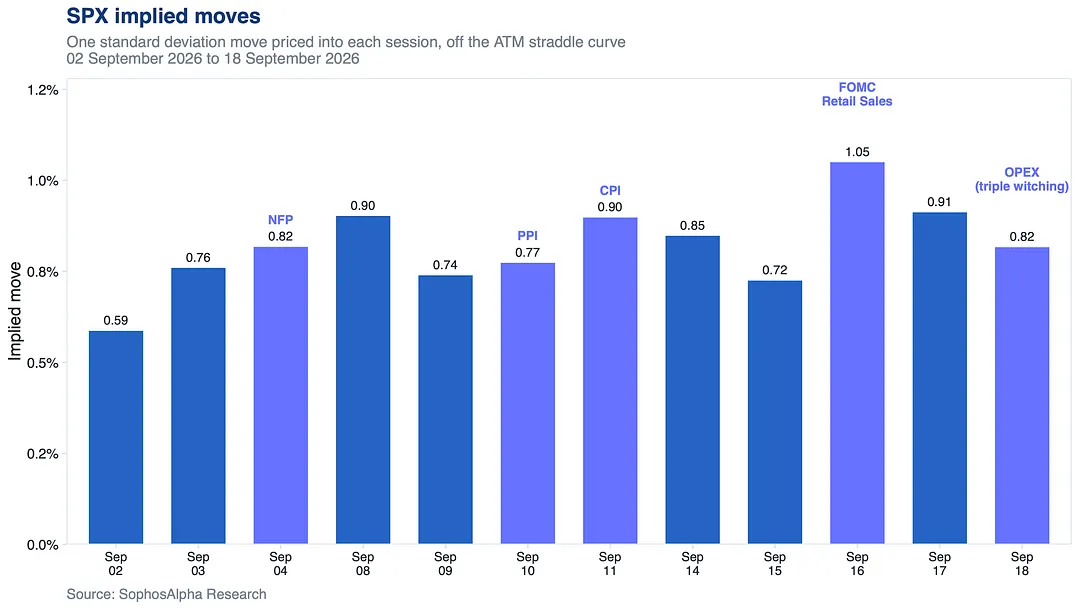
A quiet end to the week gives way to a much busier one, and NFP is the release to watch.

Options price a 0.57% move in SPX today. Every session next week is priced higher, with GDP and PCE on Wednesday and NFP on Friday carrying the biggest move of the week at 0.82%.

A quiet end to the week gives way to a much busier one, and NFP is the release to watch.

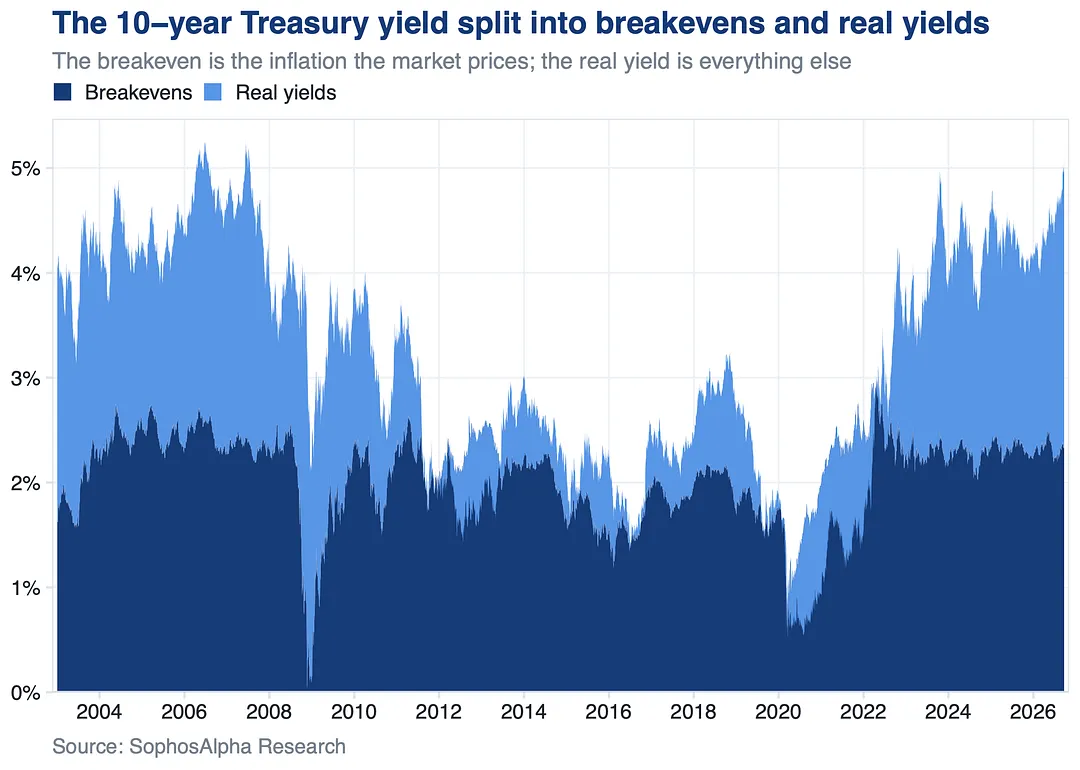
The bond selloff is not an inflation scare.

The US 10Y is up 93bp this year and only 10bp of that is breakevens. The rest is real yields, now the highest since 2008, while breakevens have barely moved in three years.

This is growth and a higher neutral rate being priced.

The bond selloff is not an inflation scare.

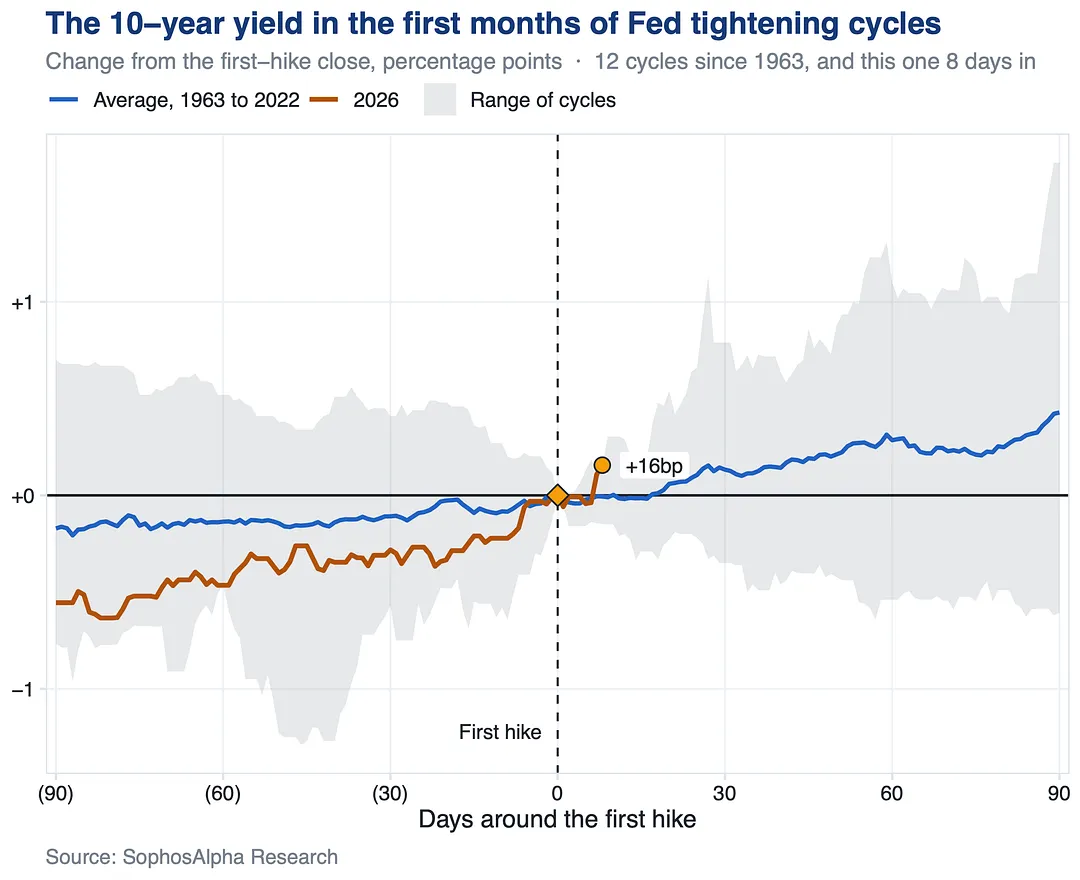
A week ago we flagged what happens to the 10Y once the Fed starts hiking.

On the historical odds, yields were more likely than not to rise over the coming year.

The 10Y is up 16bp since, already at the top of the range of every tightening cycle since 1963 at this stage.

https://substack.com/@sophosalpha/note/c-339471905

A week ago we flagged what happens to the 10Y once the Fed starts hiking.

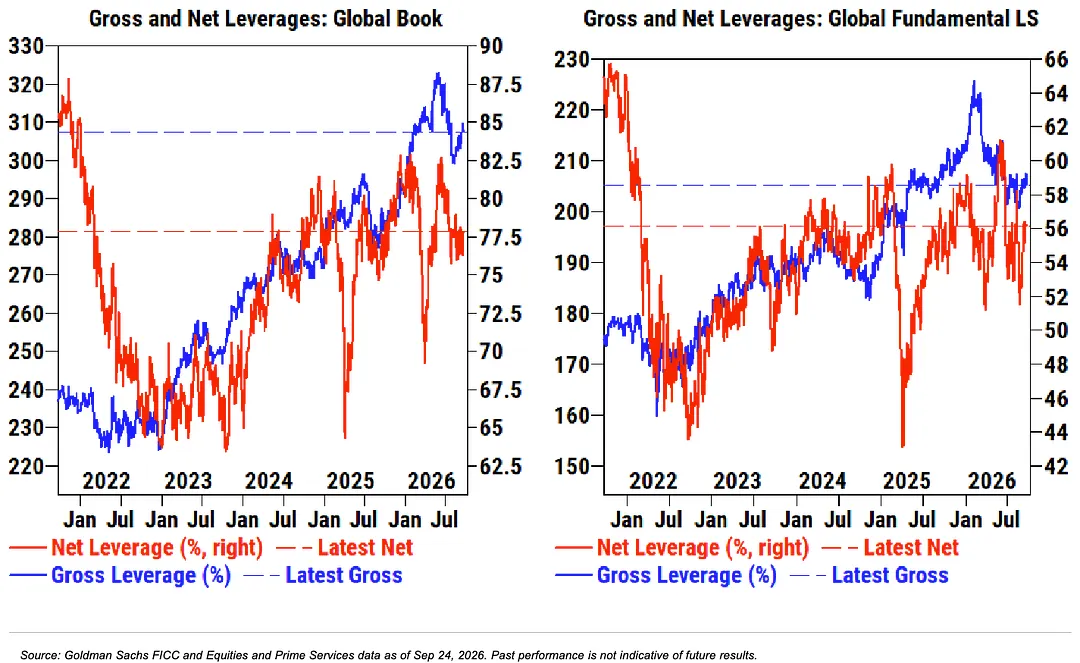
Hedge funds are running some of their biggest books in five years, but they are not betting big on stocks going higher.

Net exposure sits in the lower half of the past year. Lots of bets on both sides, little conviction on direction.

Room to chase if this rally keeps going.

Hedge funds are running some of their biggest books in five years, but they are not betting big on stocks going higher.

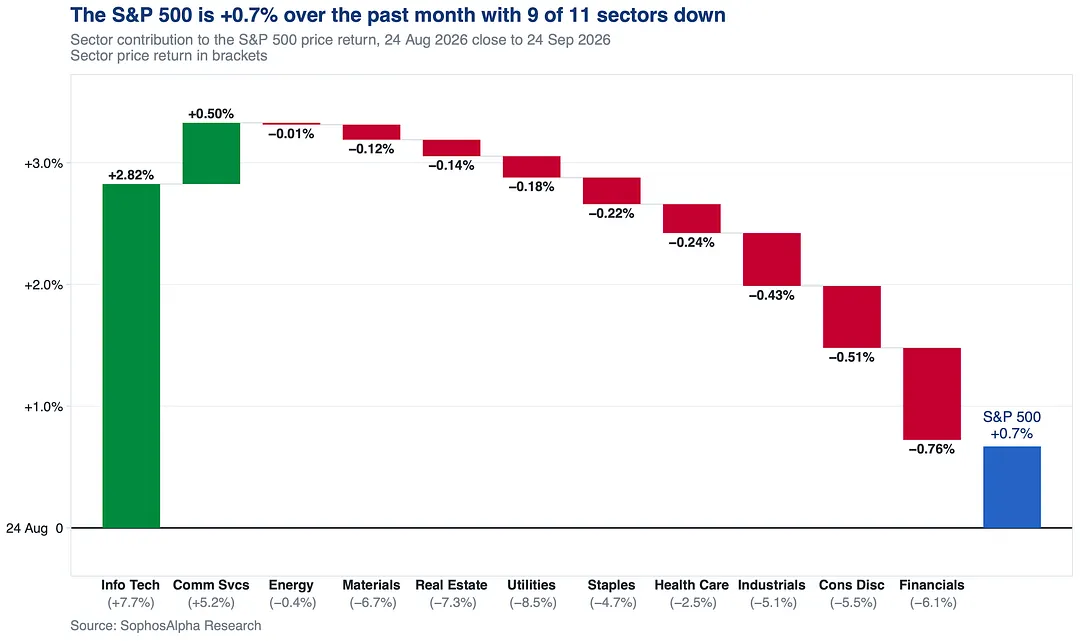
Take tech out and the S&P 500 would be down over the past month.

The index is up, but 9 of its 11 sectors fell.

Tech and communication services carried the whole move while everything from financials to utilities slid.

Take tech out and the S&P 500 would be down over the past month.

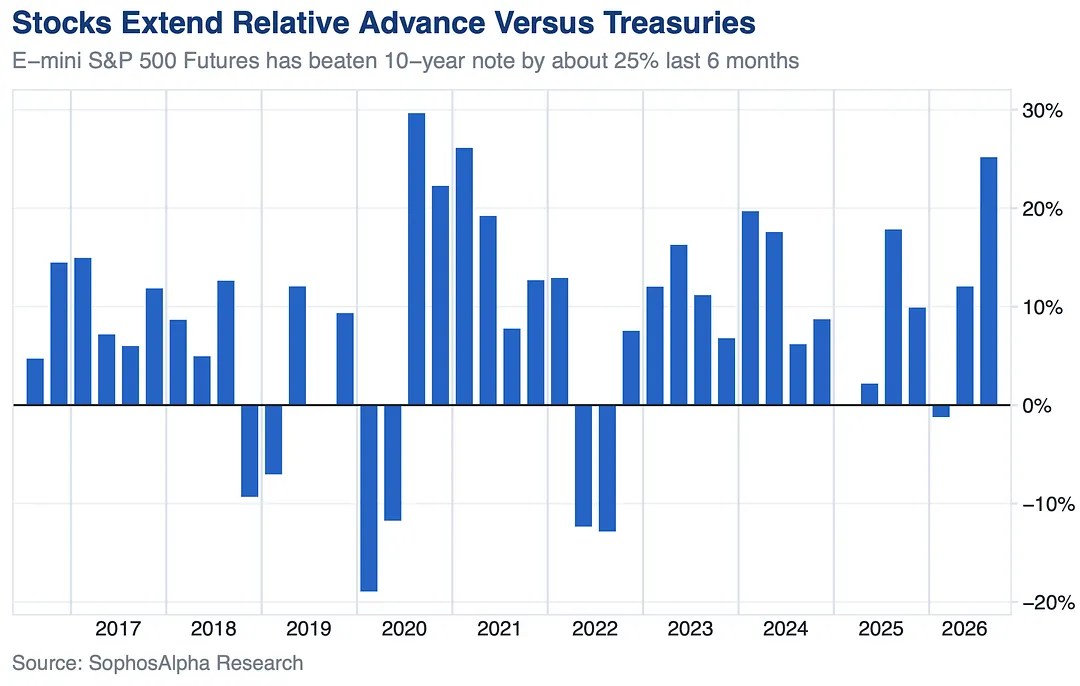
Stocks have beaten Treasuries by about 25% over the last six months, the widest gap since early 2021.

It is a double move: equities grinding higher while the bond selloff pushes the 10Y to its highest since 2007.

Stocks have beaten Treasuries by about 25% over the last six months, the widest gap since early 2021.

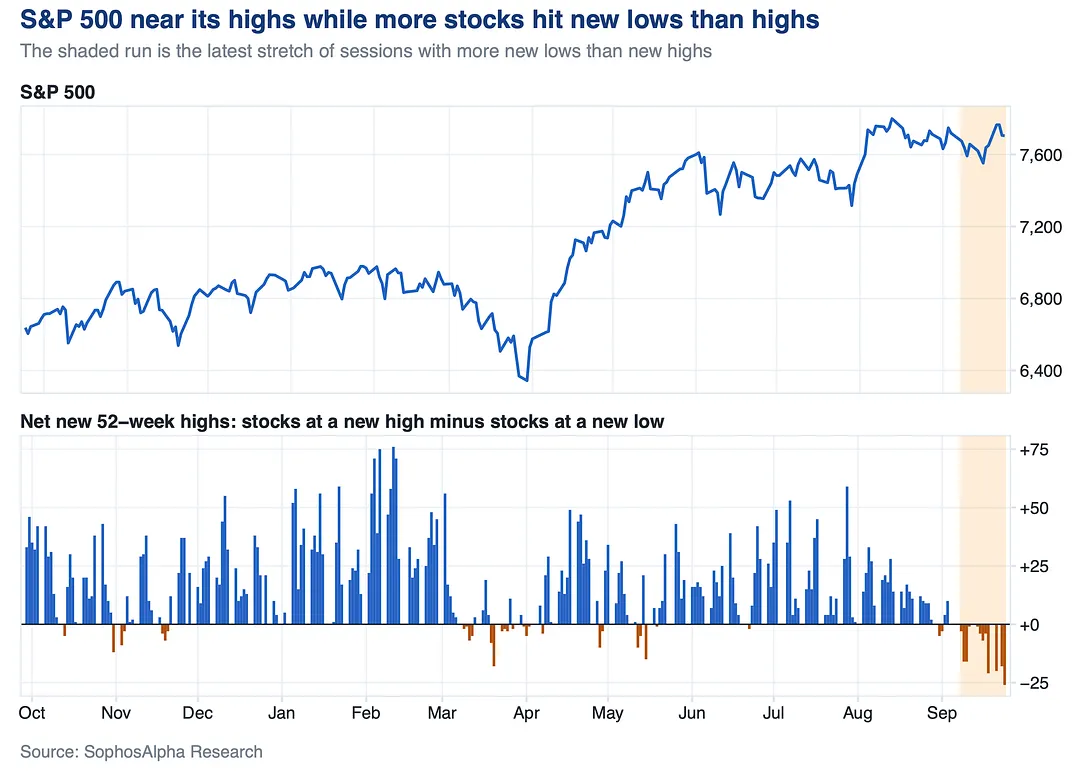
The S&P 500 is within touching distance of its record, yet more of its stocks are hitting 52 week lows than highs.

That has been the case for most of September, and the gap just hit its widest in a year. A narrow group is holding the index up while the average stock slips.

The S&P 500 is within touching distance of its record, yet more of its stocks are hitting 52 week lows than highs.

7 notes

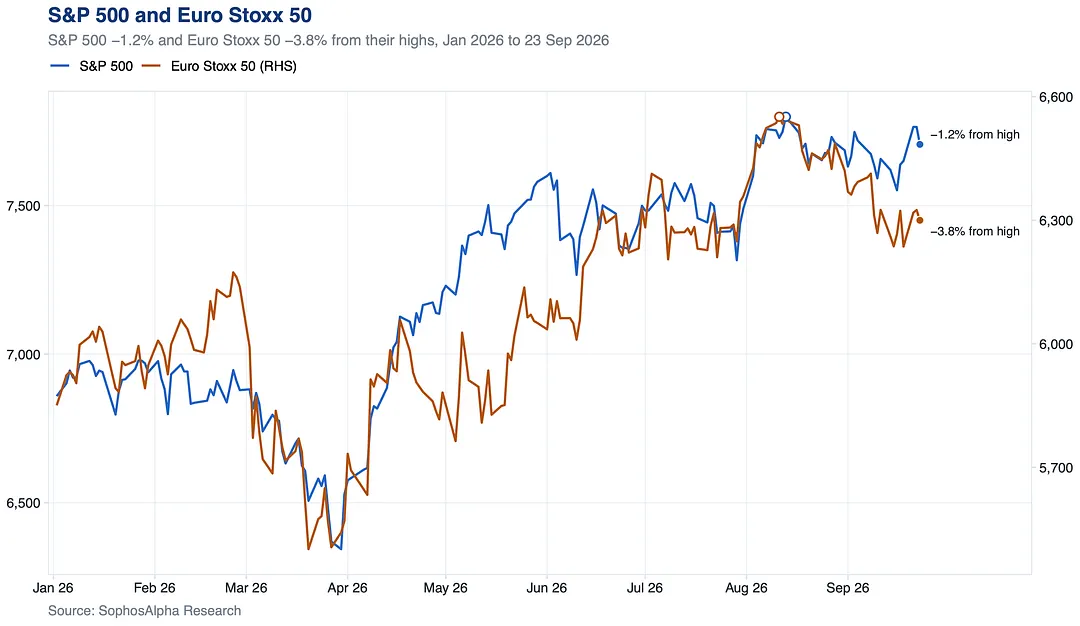
The damage to equities so far is limited.

This is a market digesting an oil and rates shock, not repricing a collapse in earnings.

The S&P 500 is 1.2% below its August record close. The Euro Stoxx 50 is 3.8% below its own.

The damage to equities so far is limited.

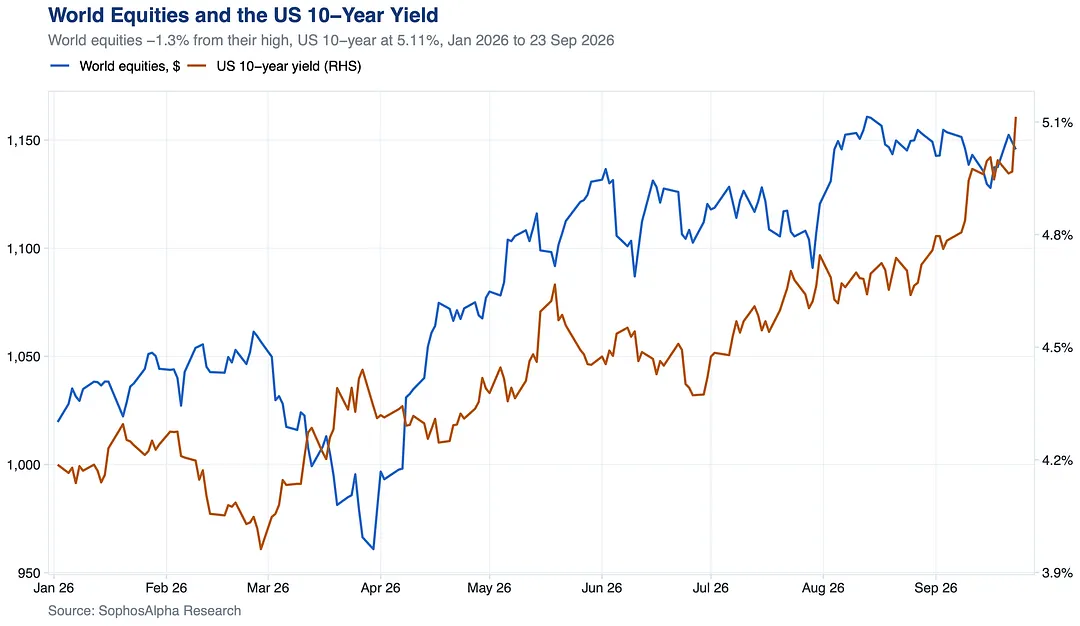
World equities are only 1.3% off their record high, even with the US 10 year yield at 5.11%.

Brent's break above $100 pushed yields up and weighed on stocks, but the pullback is modest. Corporates are strong on profitability and balance sheets across the US, Europe and Japan.

World equities are only 1.3% off their record high, even with the US 10 year yield at 5.11%.

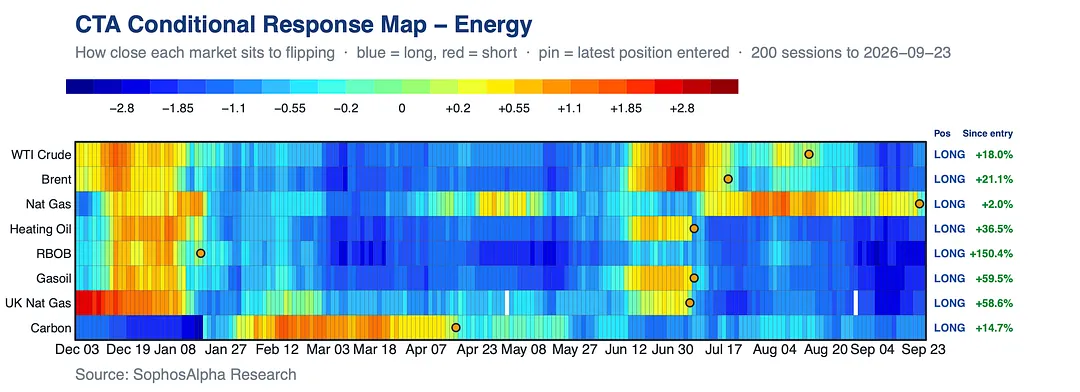
For a big share of institutional money, fundamentals are not part of the algorithm.

Oil fell 10% in a week, yet our model of trend following funds (CTAs) is still long every energy market. Crude is up about 20% since summer and gasoline more than doubled since January.

We update this book every week. Subscribe to follow it: https://sophosalpha.substack.com/subscribe

For a big share of institutional money, fundamentals are not part of the algorithm.

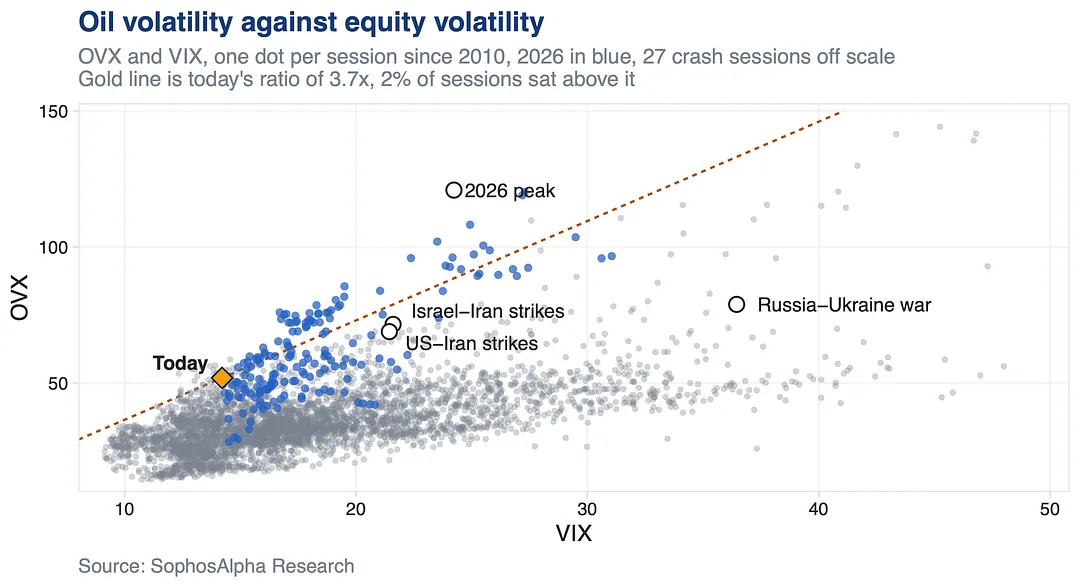
Oil volatility sits near the top of its range while the VIX sits on the calm side.

The gap between them has rarely been this wide since 2010, and most of those times came this year.

Oil volatility sits near the top of its range while the VIX sits on the calm side.

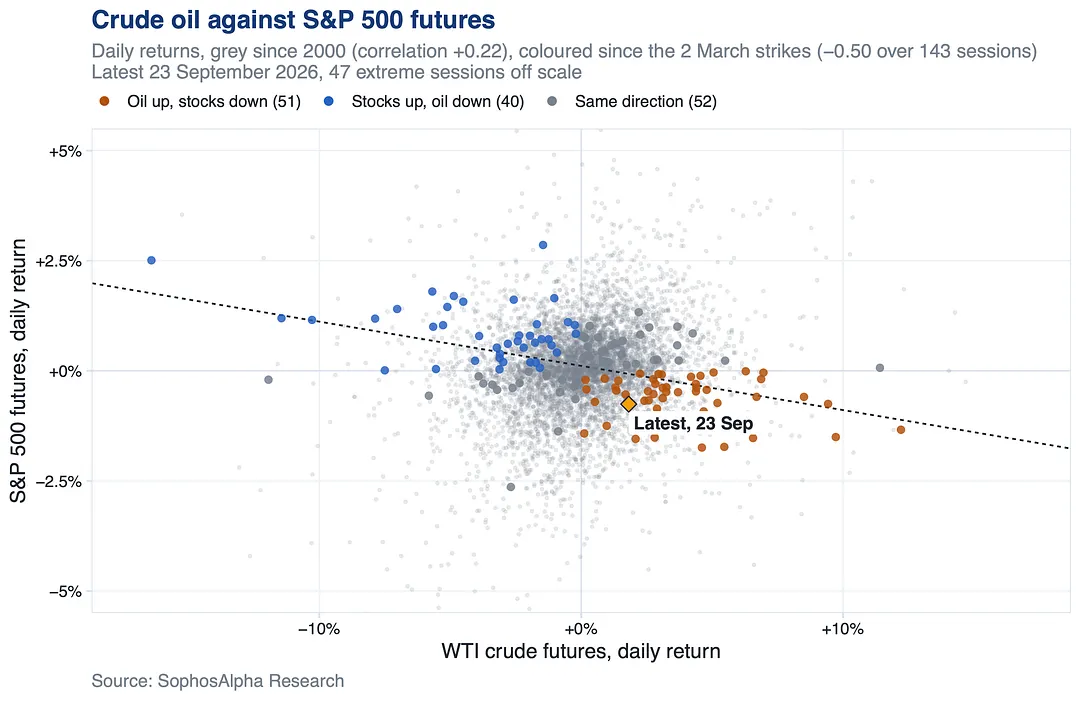
Oil and stocks are moving against each other more than at any point in over 25 years.

Normally they rise and fall together. Since the March strikes, when crude jumps, stocks drop, and when crude eases, stocks bounce.

That is what a supply shock looks like. Until it fades, crude is the number to watch.

Oil and stocks are moving against each other more than at any point in over 25 years.

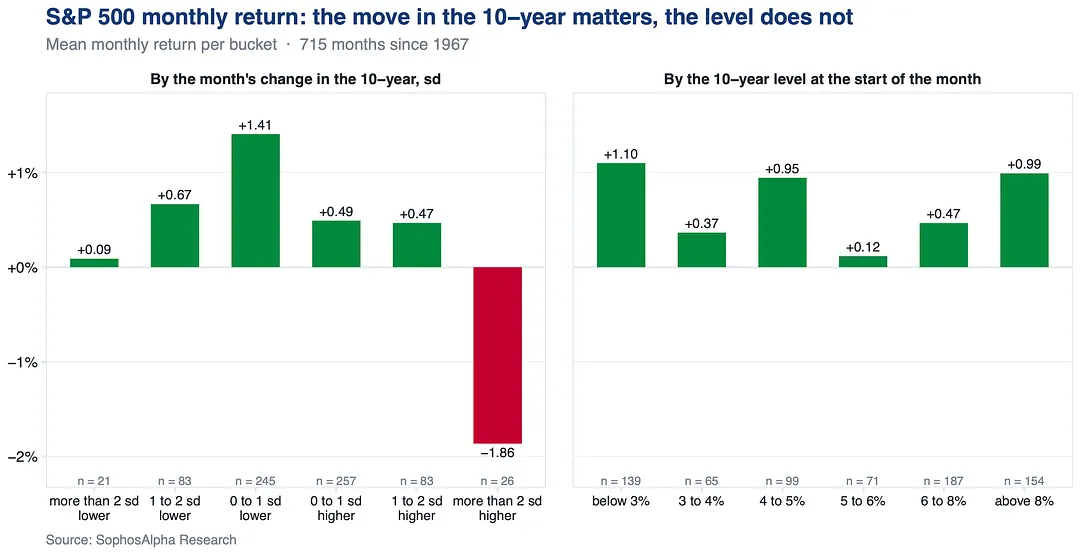
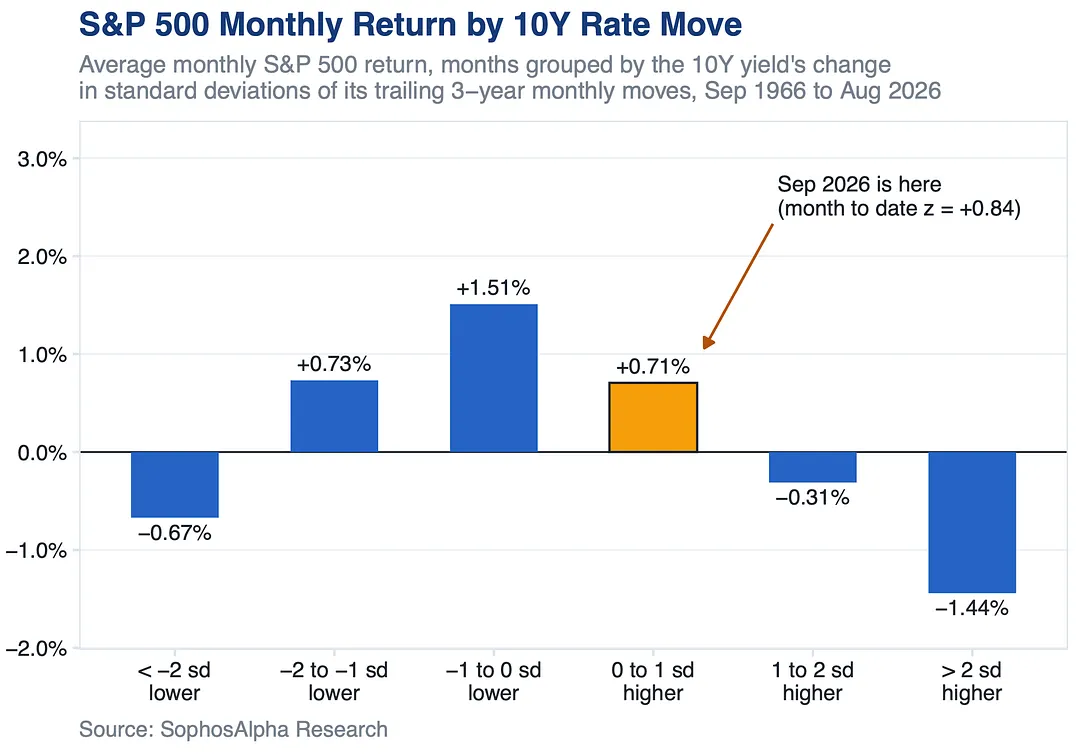
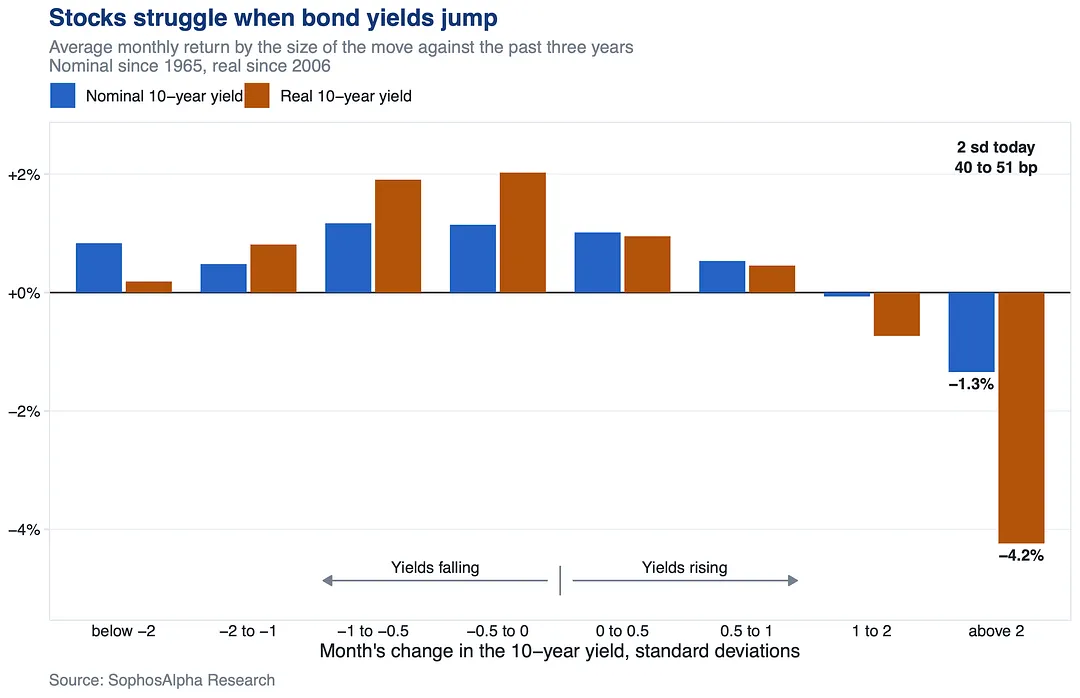
When the 10 year yield jumps more than 2 standard deviations in a month, the S&P 500 has averaged a 1.3% loss.

On real yields, 4.2%.

Today that is a move of about 50bp. The 10 year is up 36bp so far this month.

Less than 20bp more by month end puts September in that bucket.

When the 10 year yield jumps more than 2 standard deviations in a month, the S&P 500 has averaged a 1.3% loss.

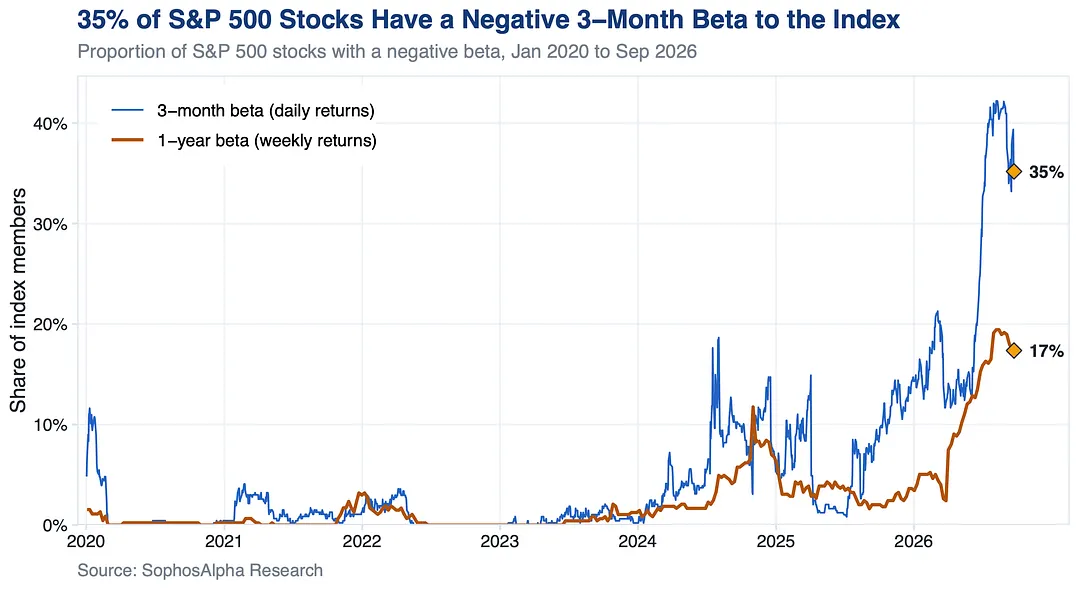
A third of the S&P 500 is moving against the index itself.

35% of its stocks have a negative 3 month beta, down from 42% in early August. In 2001 it never got above 20%.

When the index rallies, a third of its stocks tend to go the other way.

A third of the S&P 500 is moving against the index itself.

7 notes

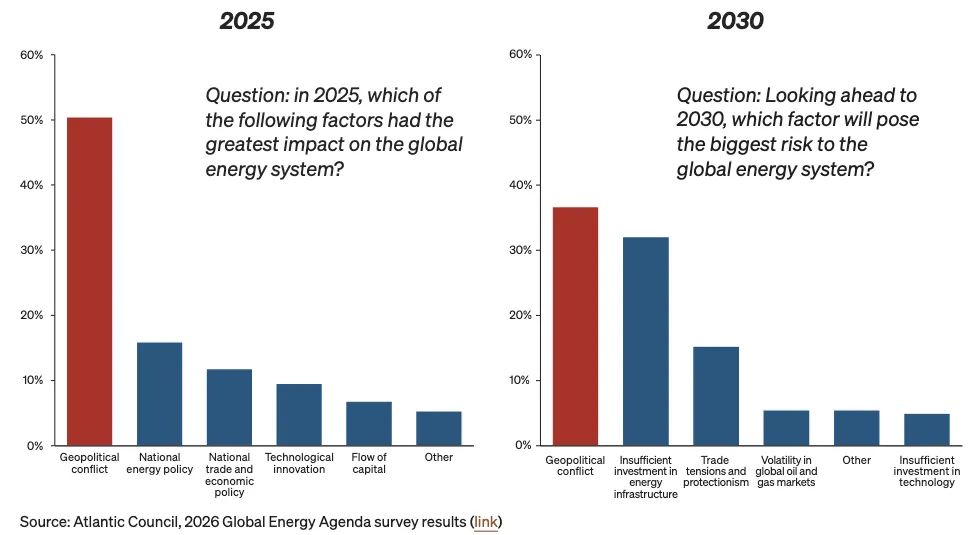
Geopolitical conflict had the greatest impact on the global energy system in 2025, a state of affairs expected to remain in 2030.

Geopolitical conflict had the greatest impact on the global energy system in 2025, a state of affairs expected to remain in 2030.

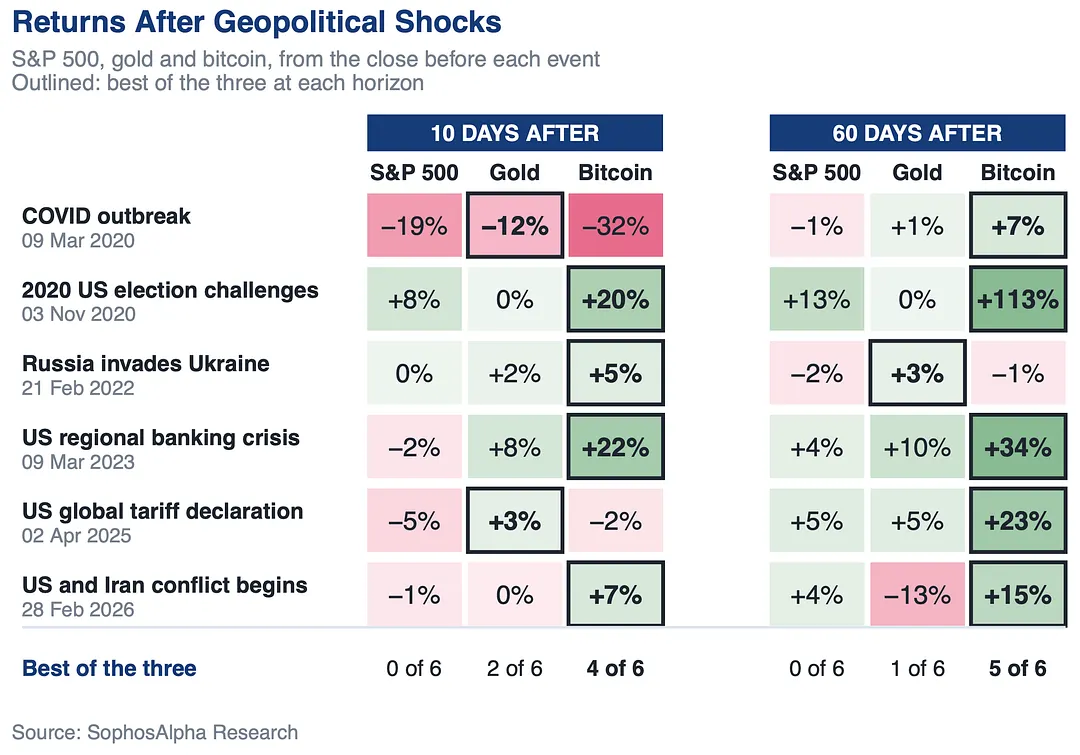
In the weeks and months after the major shocks of recent years, Bitcoin has often outperformed both the S&P 500 and Gold.

Sixty days out, it did in 5 of the last 6. 2026 has held to that pattern so far, through the ongoing conflict between the US and Iran.

In the weeks and months after the major shocks of recent years, Bitcoin has often outperformed both the S&P 500 and Gold.

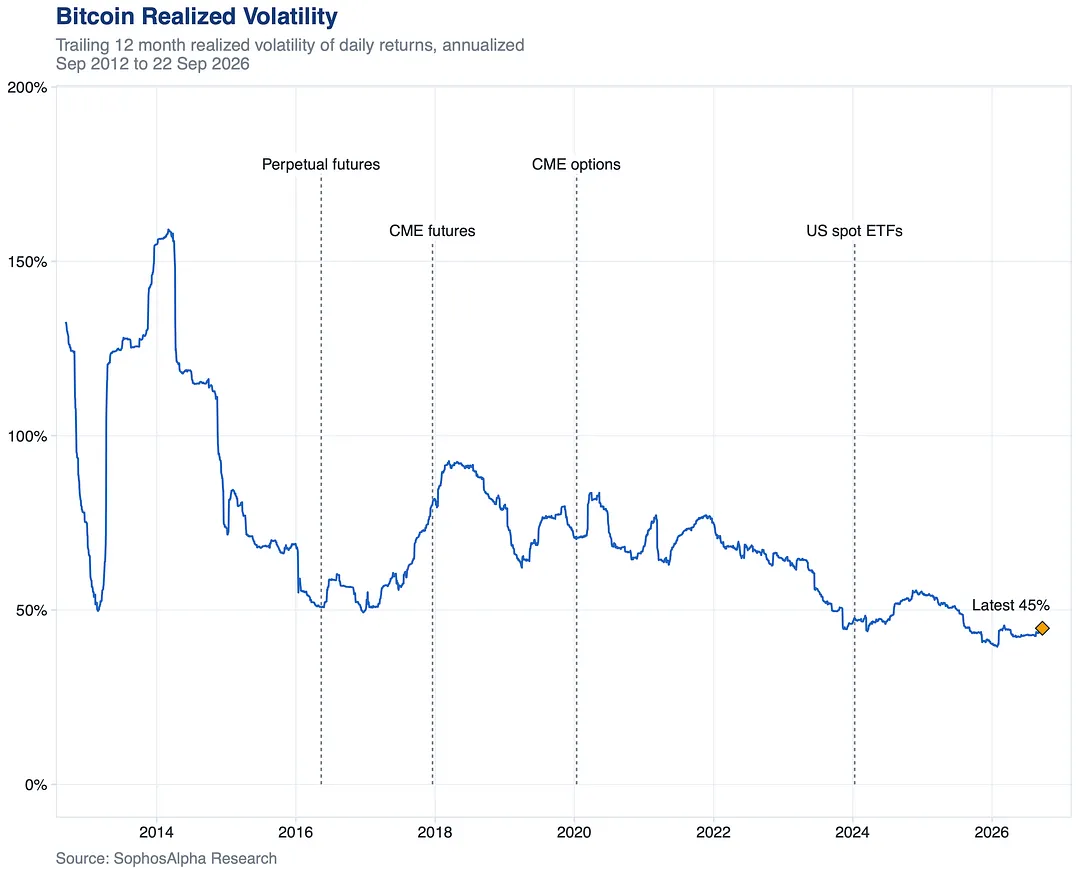
A decade ago bitcoin traded almost only on offshore exchanges, where the market was thin and moves were violent.

Then came regulated futures, options and US spot ETFs. Its yearly volatility fell from about 97% to 45%.

Calmer than it was. Still 3.5 times the S&P 500.

A decade ago bitcoin traded almost only on offshore exchanges, where the market was thin and moves were violent.

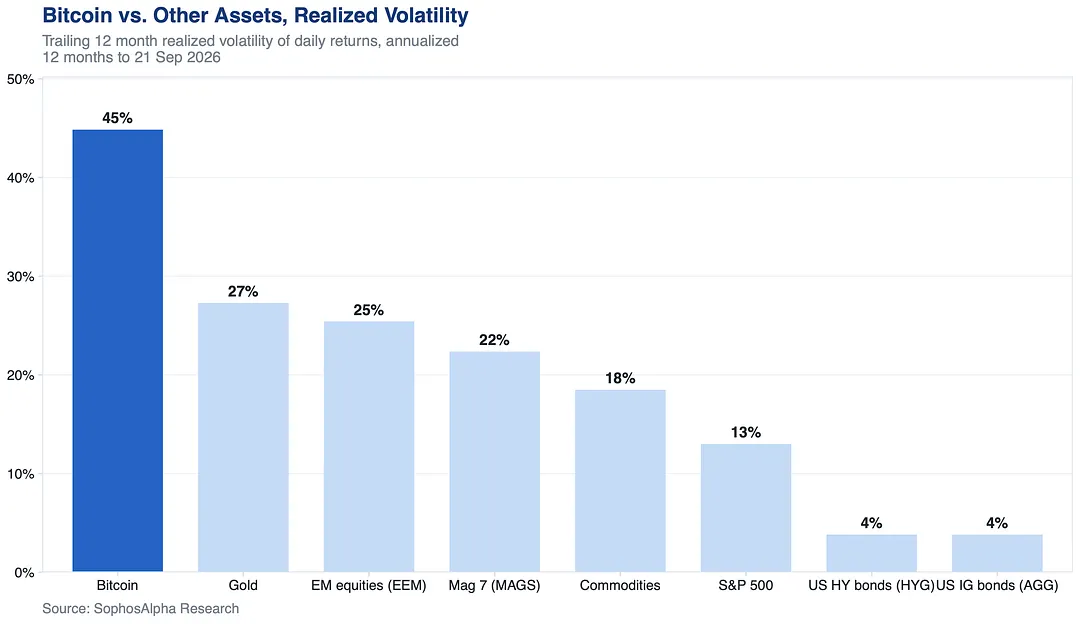
Sized by risk, a 1% position in Bitcoin swings about as much as 3.5% in the S&P 500.

Its volatility over the past 12 months was 45%. Gold's was 27%, the S&P 500's 13%, US bonds 4%.

Nothing else on the board comes close, gold included.

Sized by risk, a 1% position in Bitcoin swings about as much as 3.5% in the S&P 500.

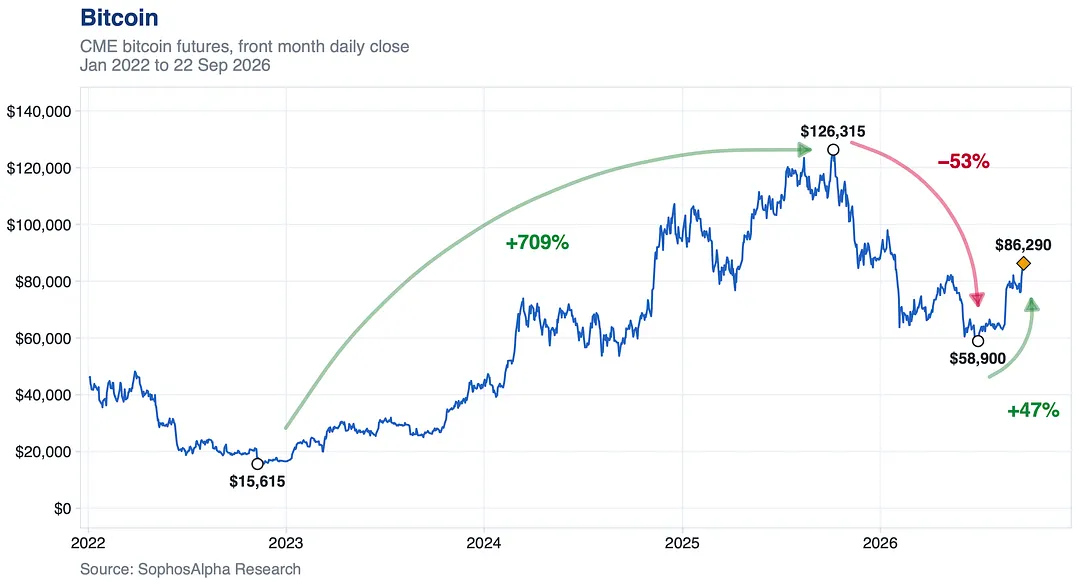
Bitcoin just posted its two highest closes since January, $86,590 and $86,290.

That's 46% off the June low.

It needs another 46% to get back to the October high of $126,315.

The drop took nine months. The rebound so far has taken twelve weeks.

Bitcoin just posted its two highest closes since January, $86,590 and $86,290.

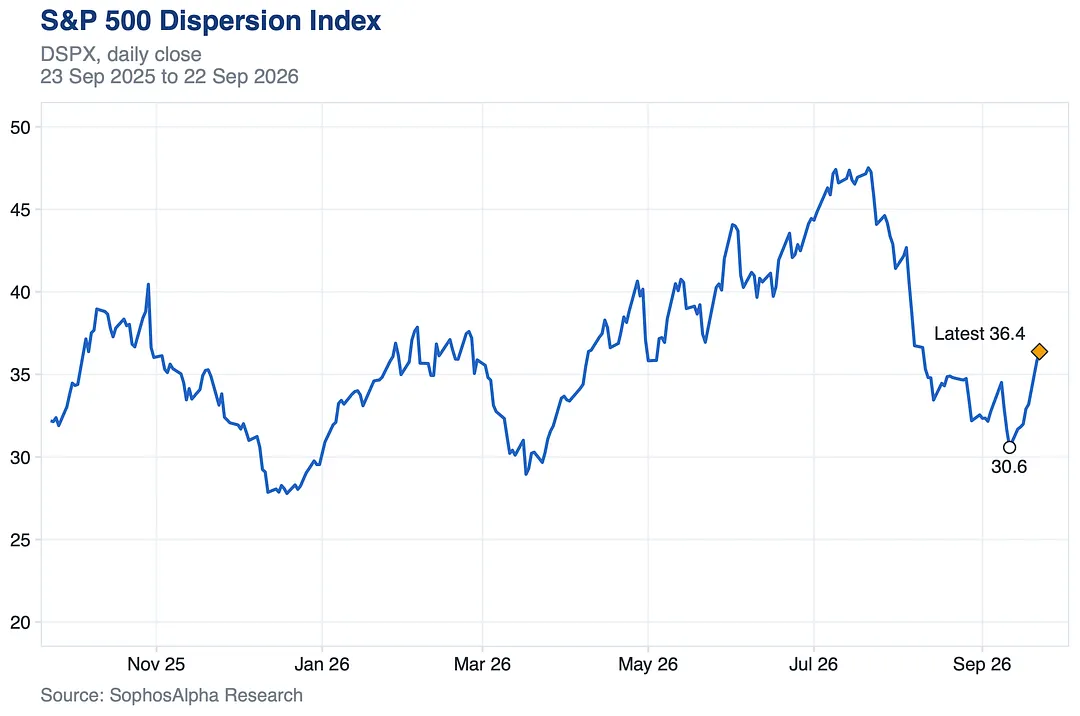
The S&P 500 Dispersion Index jumped from 30.6 to 36.4 in seven sessions, its second biggest run in a year.

The index is calm, the stocks aren't. VIX closed at 14.2, lowest since December. Single stock vol is 39.

While that gap holds, a quiet VIX says little about single names.

The S&P 500 Dispersion Index jumped from 30.6 to 36.4 in seven sessions, its second biggest run in a year.

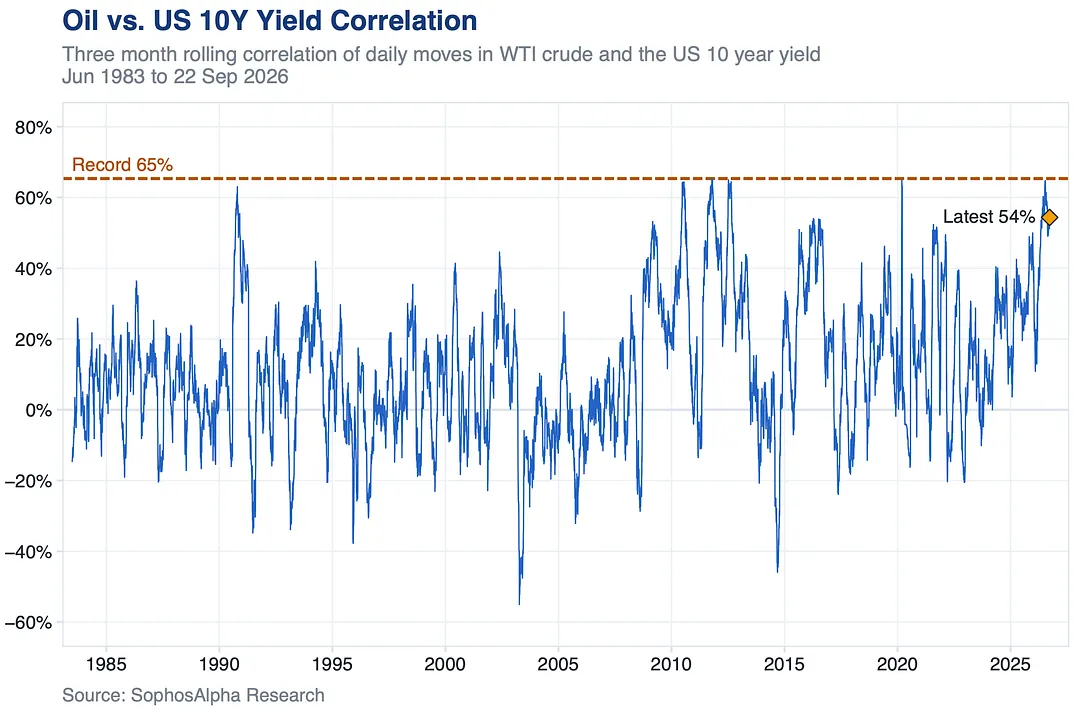
Oil and the US 10 year yield are moving together more in 2026 than in any year since 1983.

Their three month correlation hit 65% in July, within a point of the record, and has held above 40% since April. It's 54% now.

While that holds, a big oil move is a rates move too.

Oil and the US 10 year yield are moving together more in 2026 than in any year since 1983.

4 notes

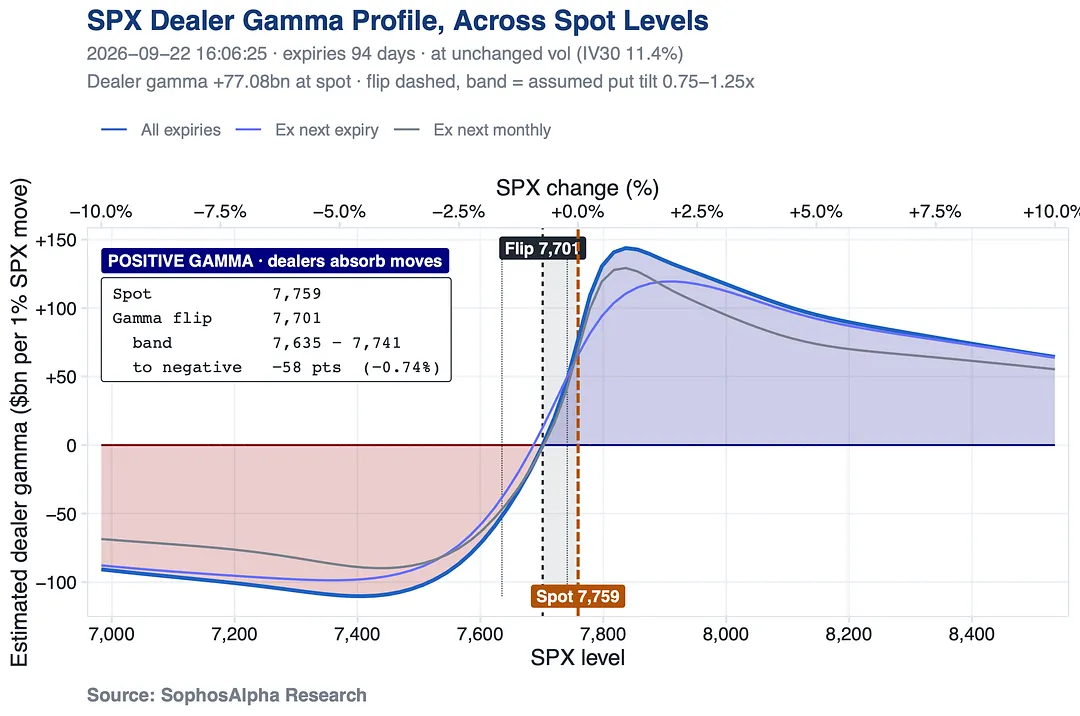
Positive dealer gamma means hedging flows run against the market, with dealers selling rallies and buying dips, which, combined with deep liquidity, can compress realised volatility.

But volatility measures magnitude, not direction, so that compression dampens rallies just as much as selloffs.

Positive dealer gamma means hedging flows run against the market, with dealers selling rallies and buying dips, which, combined with deep liquidity, can compress realised volatility.

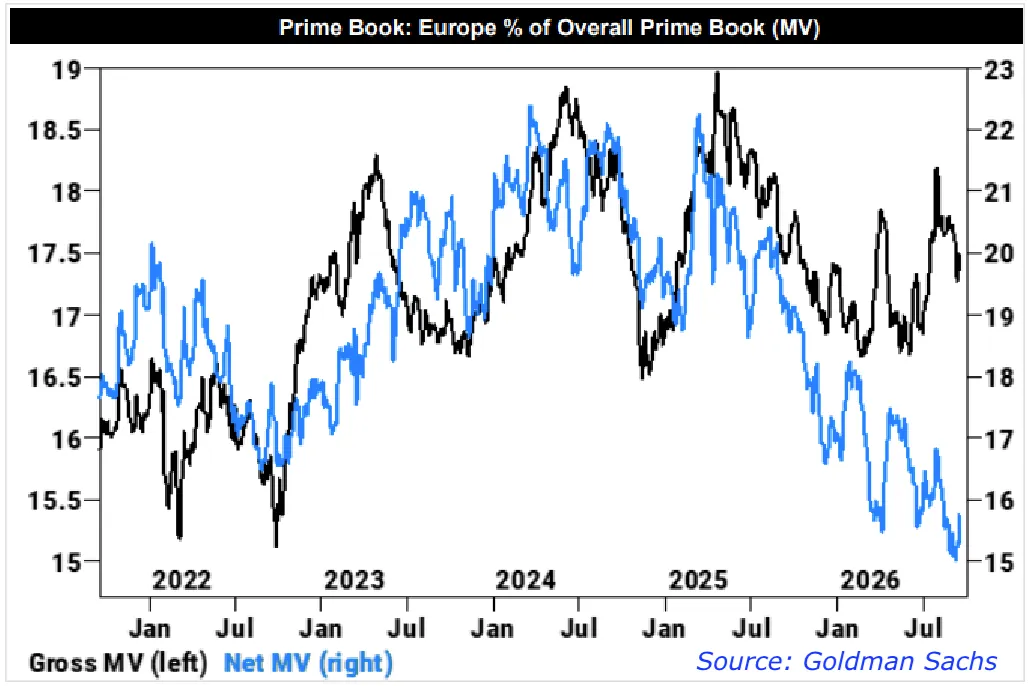
Hedge funds bought European equities at the fastest pace in 5 months last week, with short covering outpacing fresh longs almost 2 to 1.

Yet Europe's net share of the global prime book sits near its lowest in 5 years while gross is mid range.

Hedge funds bought European equities at the fastest pace in 5 months last week, with short covering outpacing fresh longs almost 2 to 1.

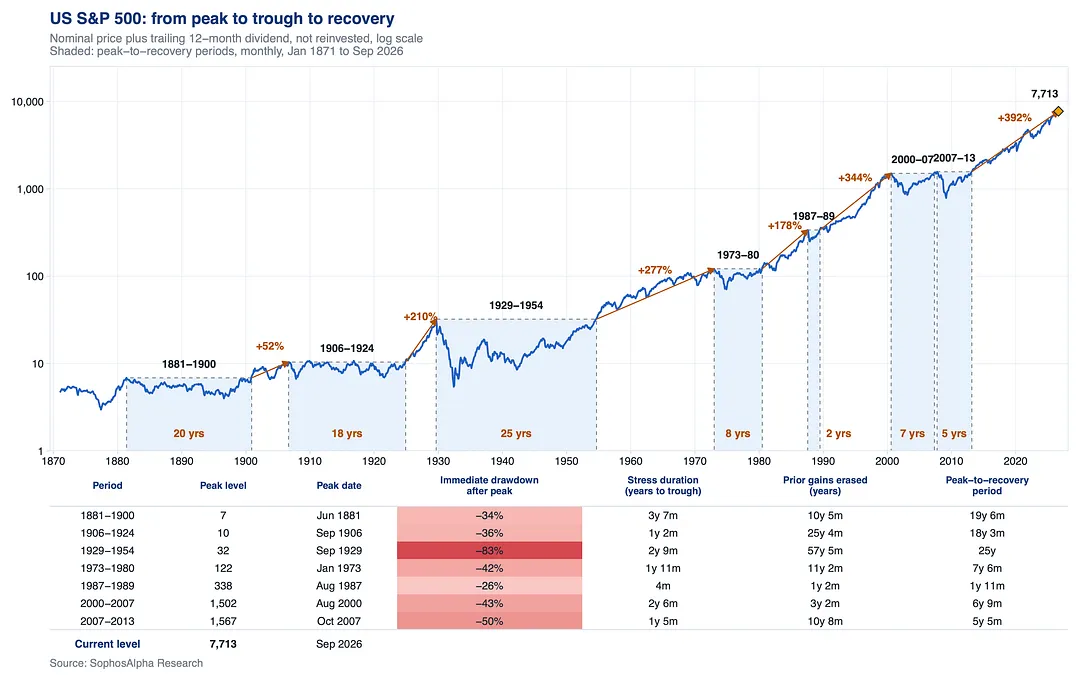
Enjoy the bull market while it lasts.

The S&P 500 is up 392% since it regained its 2007 peak in 2013. Thirteen years of one way traffic.

Seven times since 1871 a peak took years to see again: 25 after 1929, 20 after 1881, 18 after 1906, 8 after 1973, 5 after 2007. Only 1987 was quick, back at the high inside 2 years.

The drawdown is never the painful part. The waiting is.

Enjoy the bull market while it lasts.

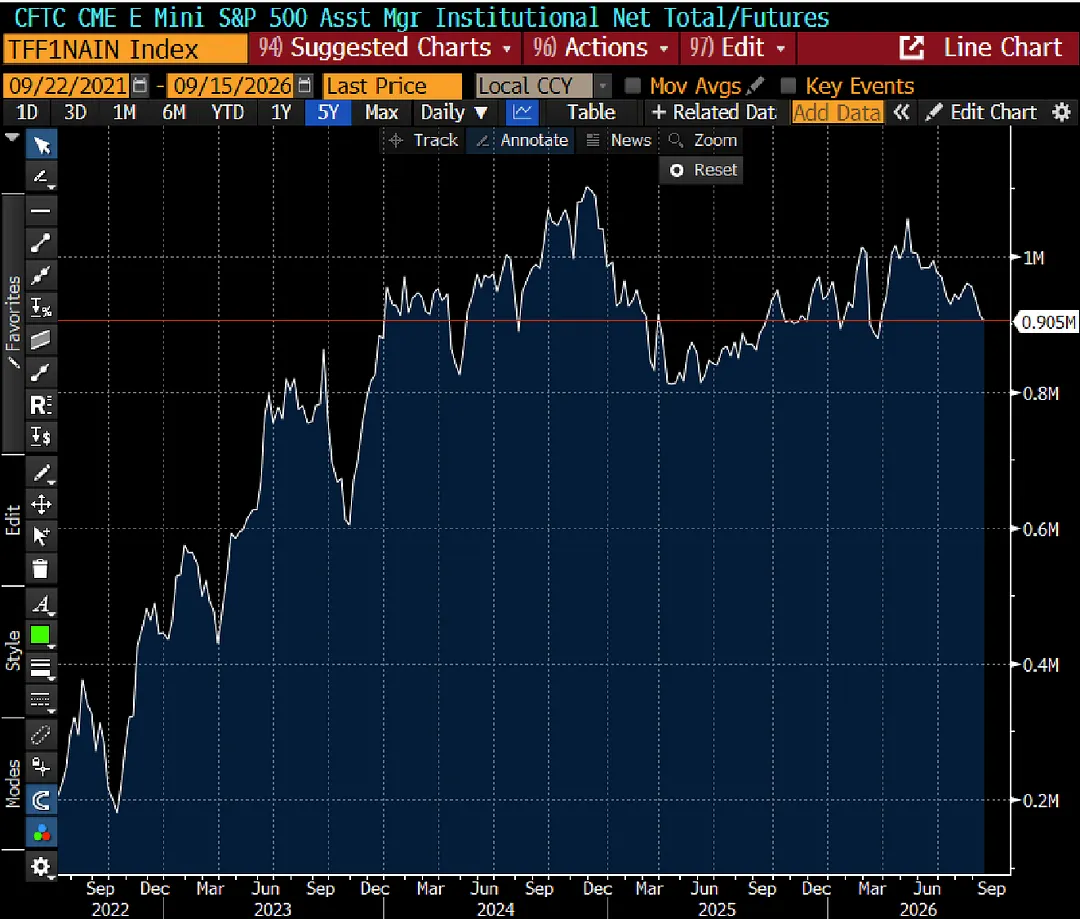
Institutions were net sellers of S&P futures in the week ending September 15, according to the latest CFTC data.

IB desk flows tell the same story: asset managers sold on the week, with supply concentrated in macro products, communication services, industrials, consumer discretionary, and tech.
See the full table: https://sophosalpha.substack.com/p/institutional-monitor-00c

Institutions were net sellers of S&P futures in the week ending September 15, according to the latest CFTC data.

9 notes

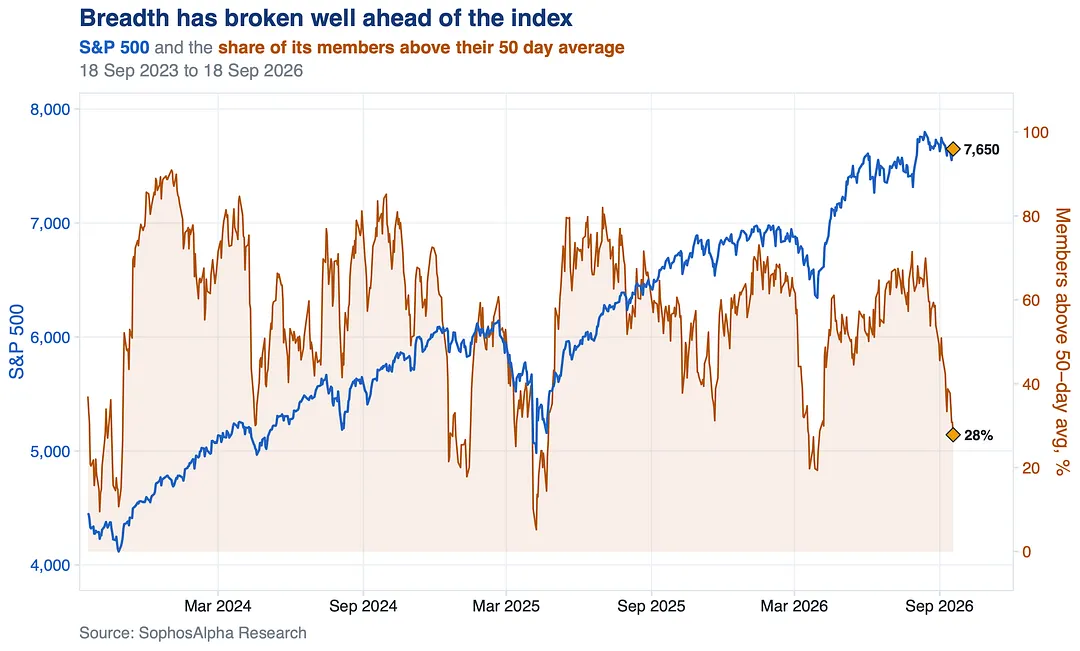
Breadth has become another pretty clear indication of how much harder the tape has been than the headline index suggests.

Less than 30% of S&P stocks are now above the 50-day moving average.

Breadth has become another pretty clear indication of how much harder the tape has been than the headline index suggests.

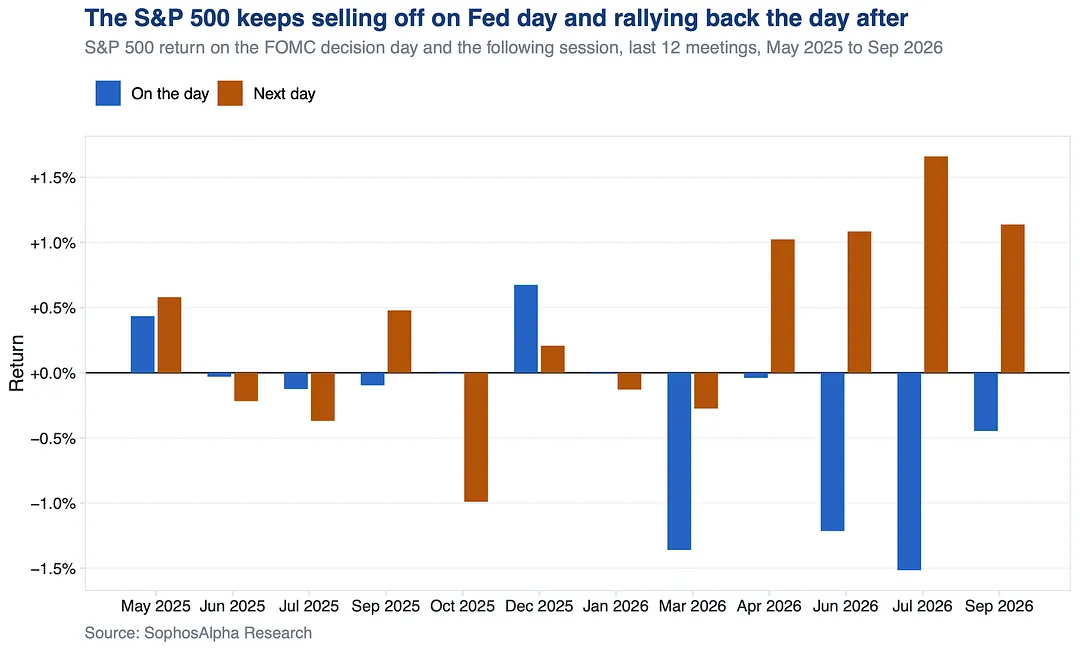
The S&P 500 keeps selling off on Fed day and rallying back the day after.

The last four meetings all traded the same way: red on decision day, green the next session, and the bounce more than paid back the drop each time.

The S&P 500 keeps selling off on Fed day and rallying back the day after.

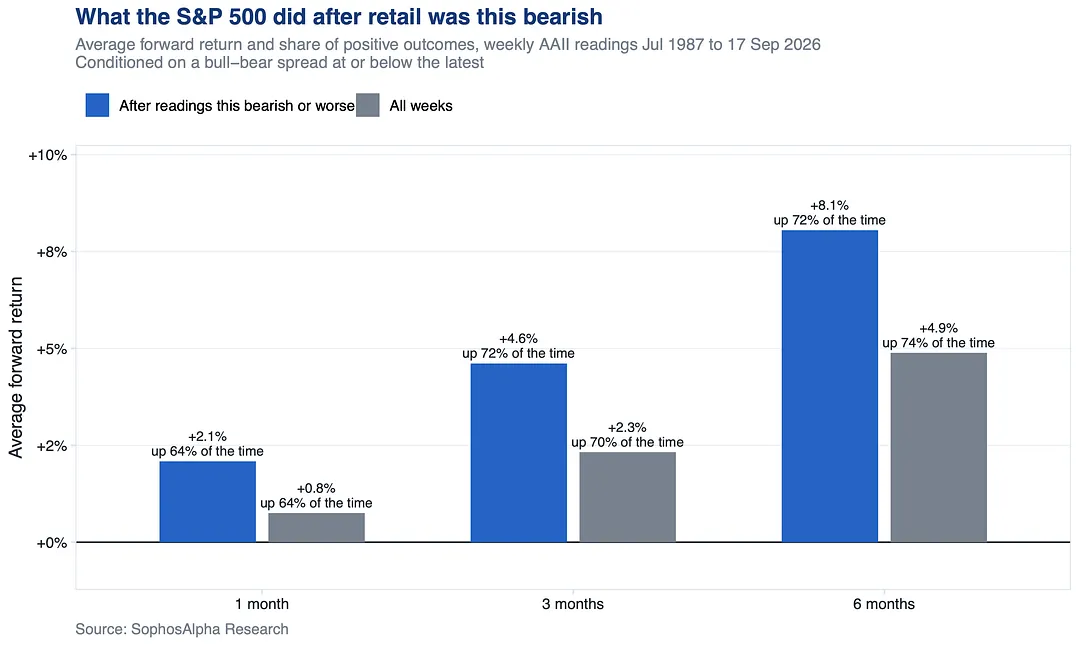
Retail this bearish has been a buying opportunity far more often than a warning.

Readings this negative are rare. In the months after them the S&P 500 did roughly double what it does in an average stretch, and finished higher most of the time.

Retail this bearish has been a buying opportunity far more often than a warning.

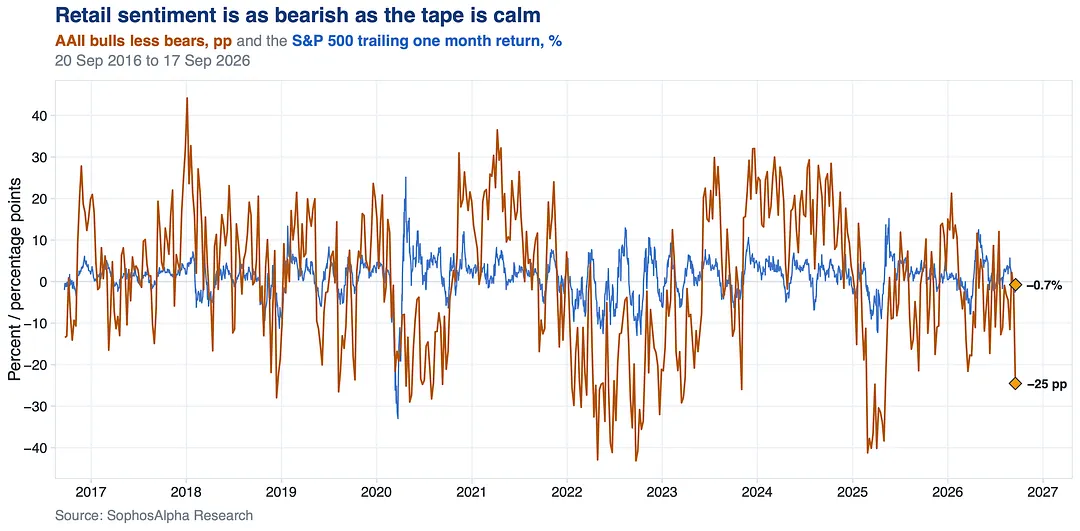
Retail sentiment has collapsed to bear market levels with the index a couple of percent from its high.

The AAII bull bear spread is at a reading seen a handful of times in a decade. The S&P 500 has barely moved in a month.

Retail sentiment has collapsed to bear market levels with the index a couple of percent from its high.

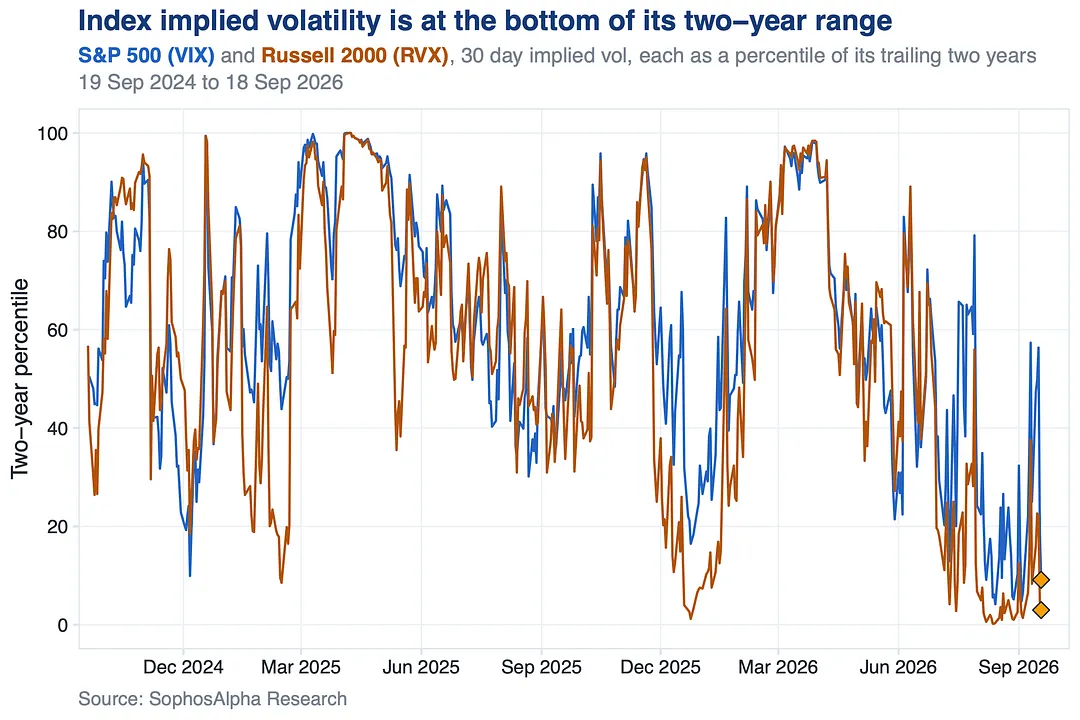
Index volatility is sitting at the floor of its two year range.

The macro is not.

Central banks still tightening, the ten year at five, the AI trade under attack, midterms weeks away. Small cap vol is cheaper still.

Buy protection when you can, not when you have to.

Index volatility is sitting at the floor of its two year range.

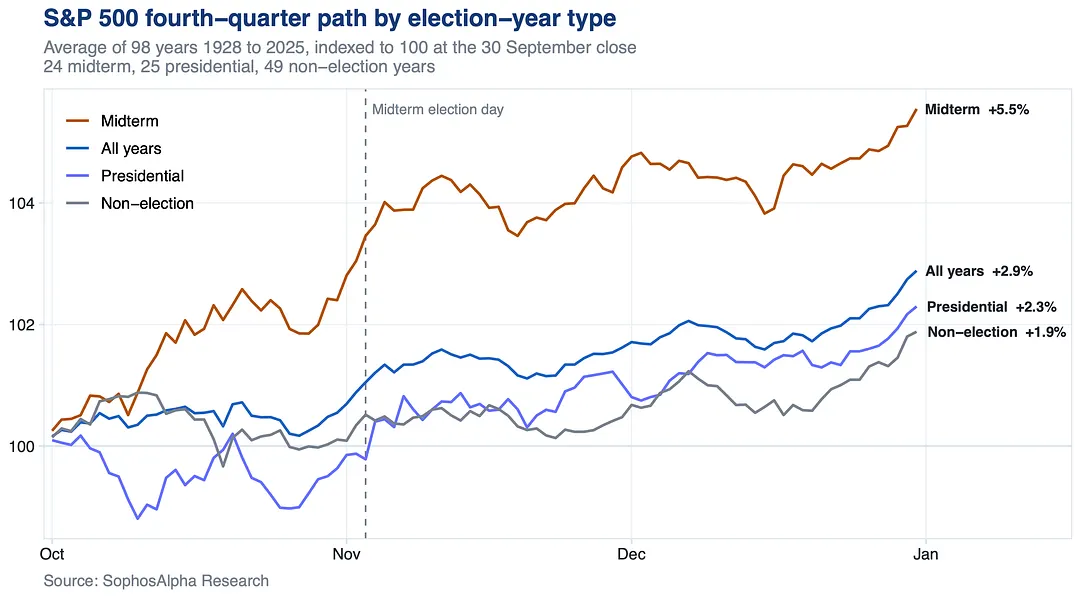
The setup gets more interesting after quarter end.

Midterm years have been the best fourth quarter of the cycle, with most of the gain after election day. Presidential years are the ones that dip first in October.

We enter that window with far less crowding than in July.

The setup gets more interesting after quarter end.

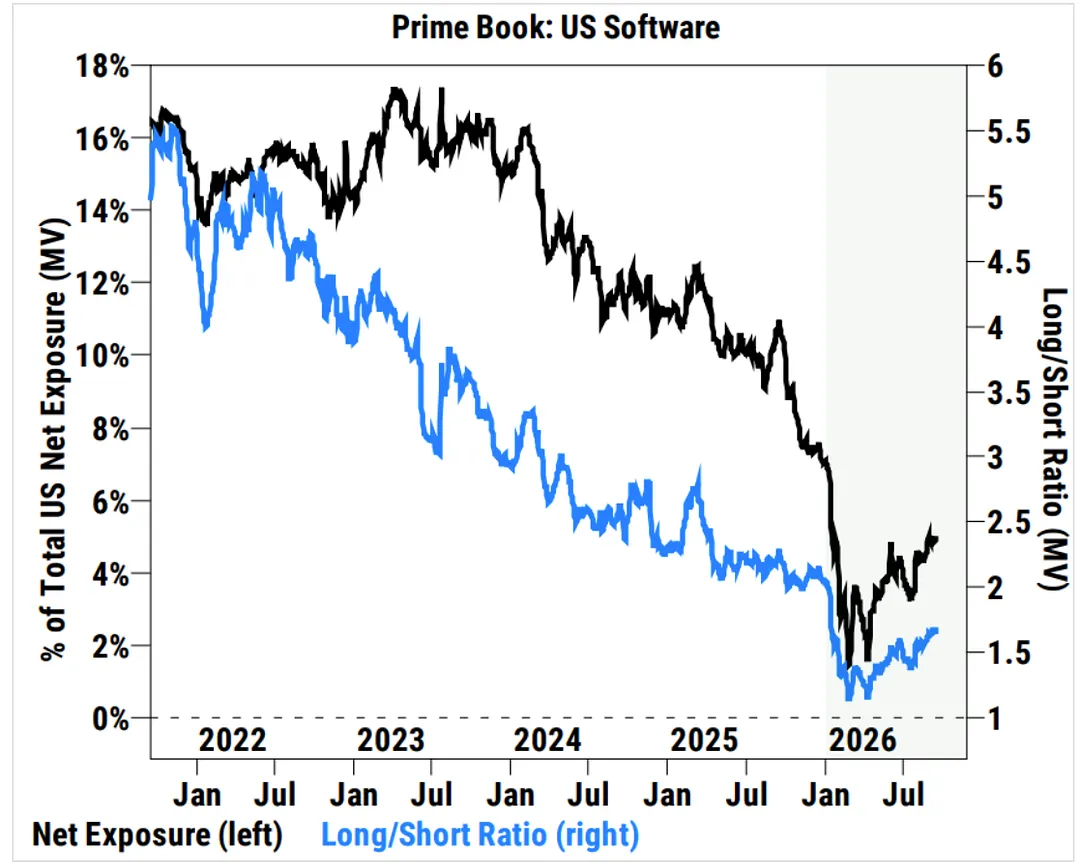
Hedge funds have now net bought US Software for four consecutive weeks and 6 of the last 8, with some early signs of increased long buying according to prime book data from Goldman Sachs.

Hedge funds have now net bought US Software for four consecutive weeks and 6 of the last 8, with some early signs of increased long buying according to prime book data from Goldman Sachs.

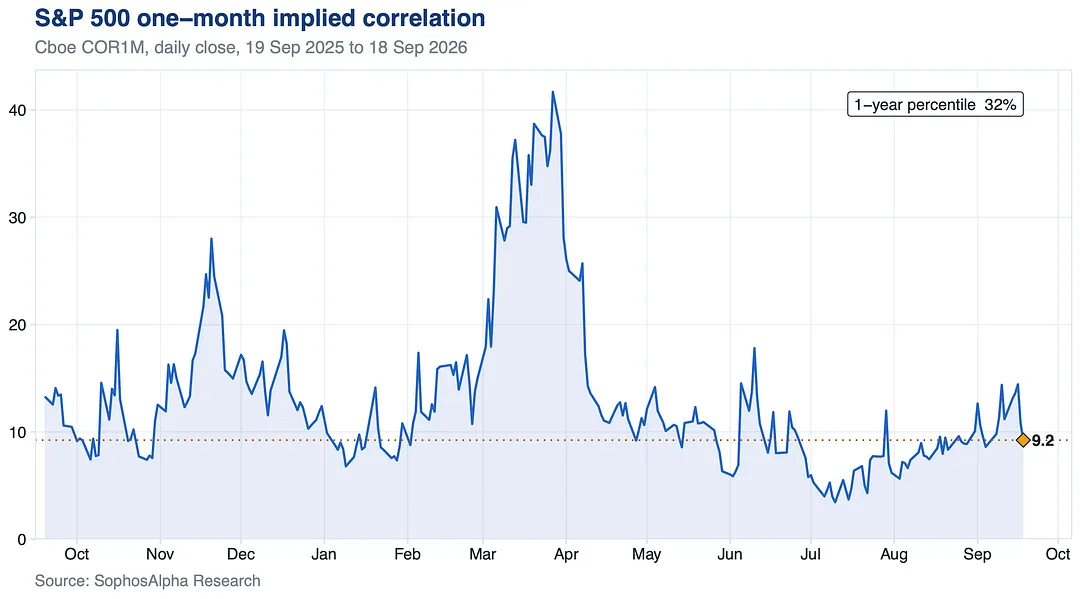
The implied correlation reprice did not stick.

It jumped into September expiry and gave it back on the roll, back in the lower third of its one year range.

Stocks are trading their own stories, not one macro story. That keeps index vol contained while single names get hit.

The implied correlation reprice did not stick.

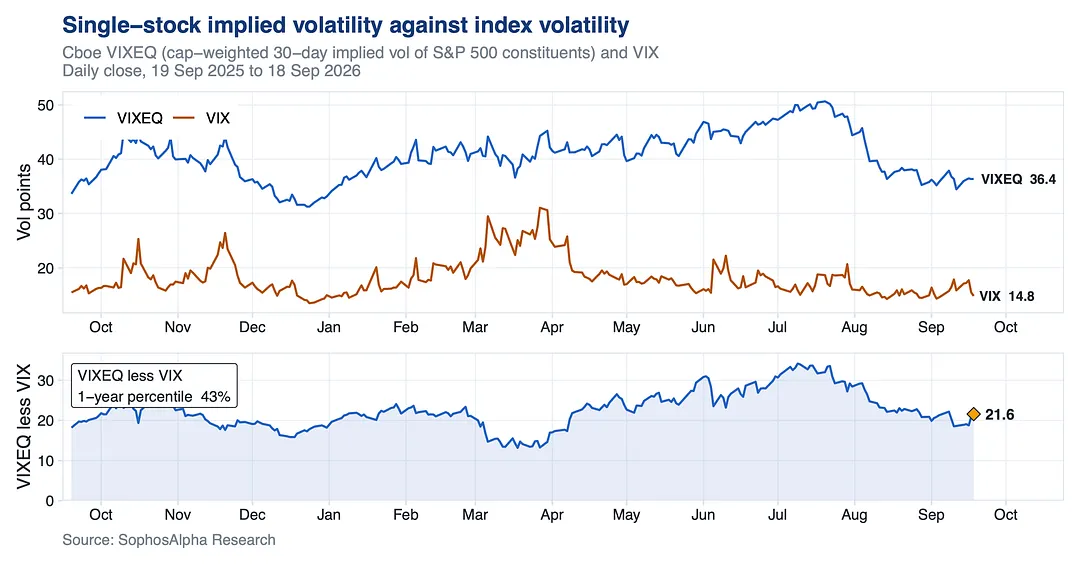
The single stock vol premium over index vol has round tripped from its summer record to the middle of its one year range.

That is what less embedded single name leverage looks like. Fewer crowded upside bets, fewer forced unwinds.

The single stock vol premium over index vol has round tripped from its summer record to the middle of its one year range.

2 notes

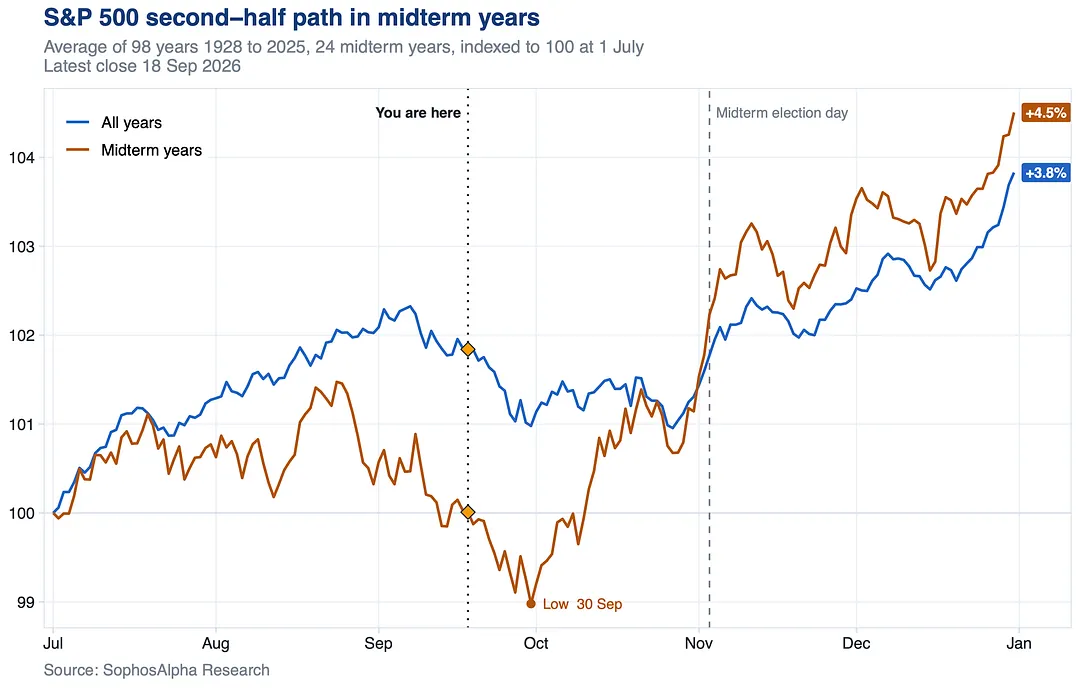
We are now in the window we flagged earlier this month.

September weakness sits in the back half, more so in midterm years.

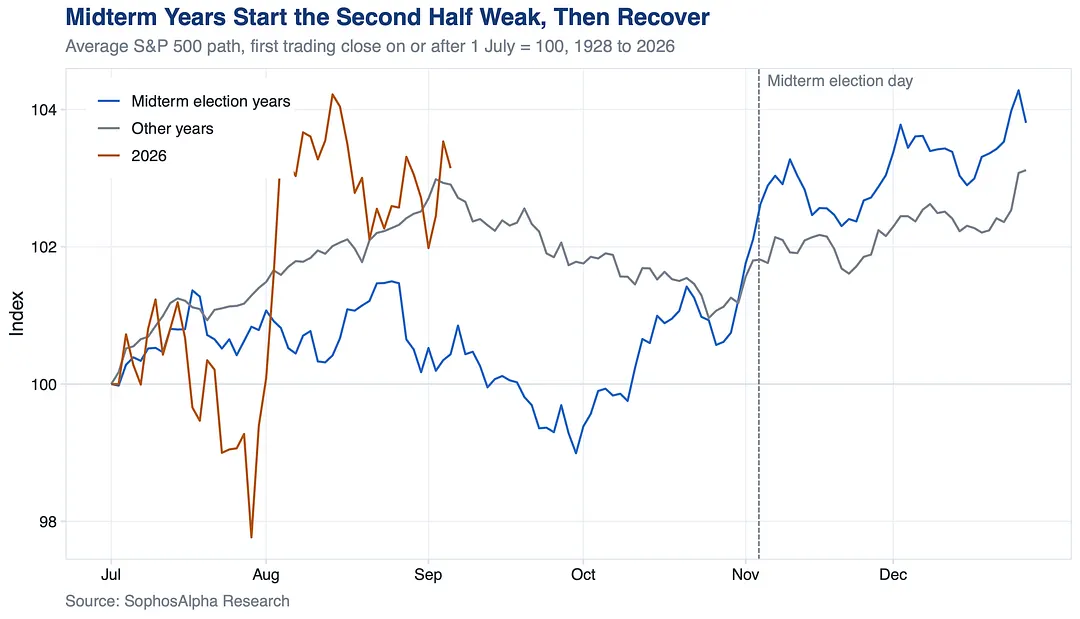
Since 1928 the average midterm path drops about 1% from here to September 30, recovers through October and runs past Election Day, up 5.6% off the low.

We are now in the window we flagged earlier this month.

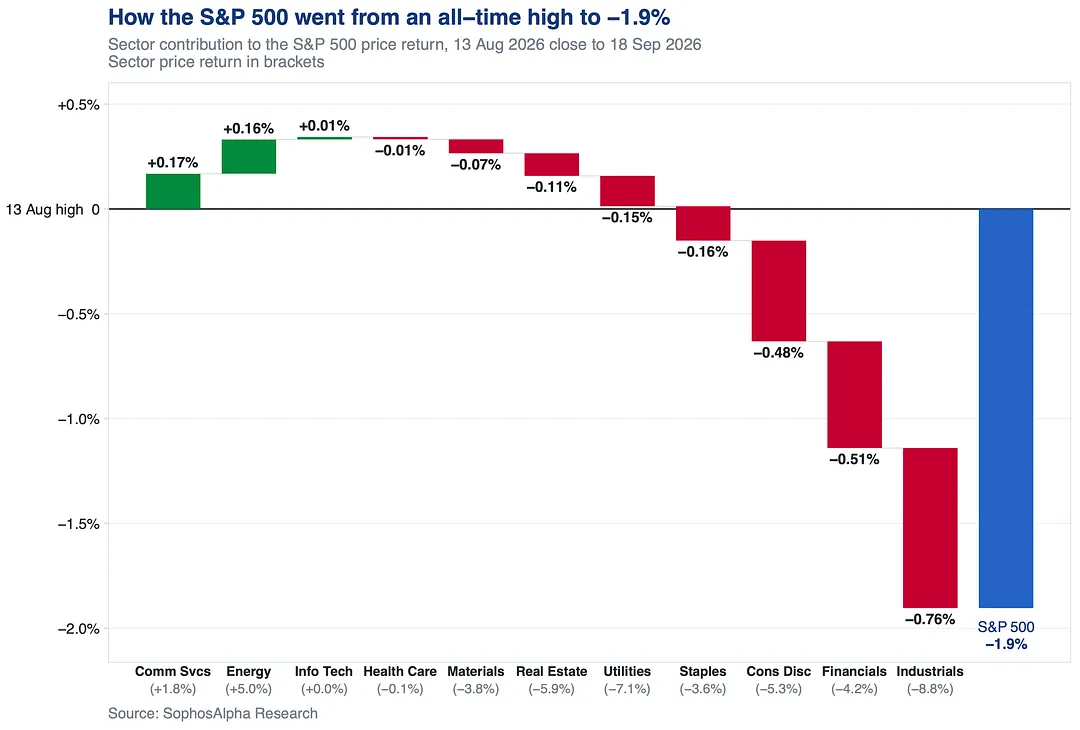
The S&P 500 is 1.9% off the August 13 high, but the headline understates the damage underneath.

Industrials, Financials and Consumer Discretionary account for the entire decline. Only Energy and Communication Services added against them.

The S&P 500 is 1.9% off the August 13 high, but the headline understates the damage underneath.

one note

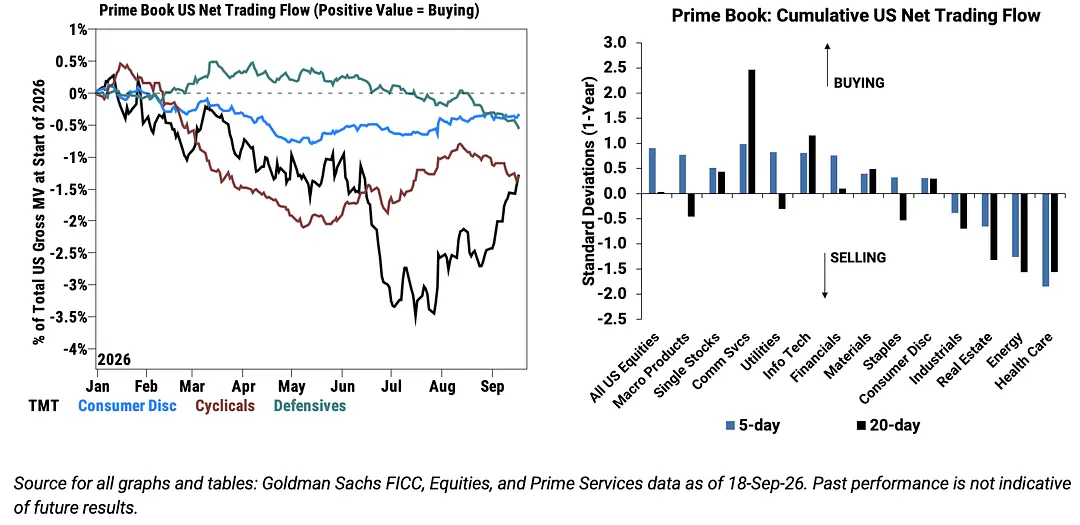
Hedge funds bought US equities at the fastest pace in five weeks, and put it back into the sector they spent the summer dumping.

7 of 11 sectors net bought.

Info Tech and Comm Svcs led for a third straight week on long buys, Comm Svcs flow near 2.5 standard deviations above its 1 year norm. Health Care paid for it, net sold a fifth week running and the biggest outflow on the board.

TMT cumulative flow still sits 1.5% of US gross market value below where it began 2026. Three weeks of buying has only walked it up from a July trough near 3.6%.

Hedge funds bought US equities at the fastest pace in five weeks, and put it back into the sector they spent the summer dumping.

5 notes

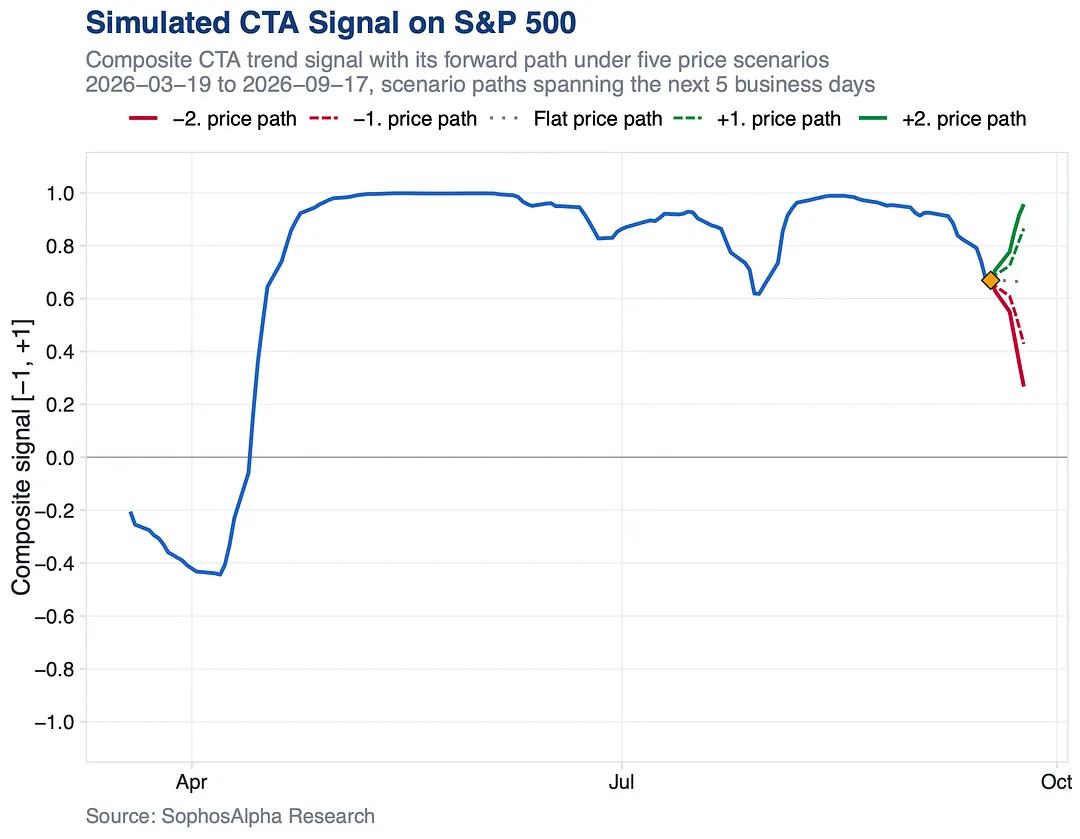
We estimate CTAs remain long the S&P 500 and that their exposure is still elevated.

However, current flow estimates are dramatic given that exposure: Wednesday's session was enough to turn their fastest signals.

We anticipate this cohort sells on a flat tape, and on a down tape their selling runs at more than twice their buying potential on a rally. Expect the market to feel “heavy” on rallies while these flows work through.

We estimate CTAs remain long the S&P 500 and that their exposure is still elevated.

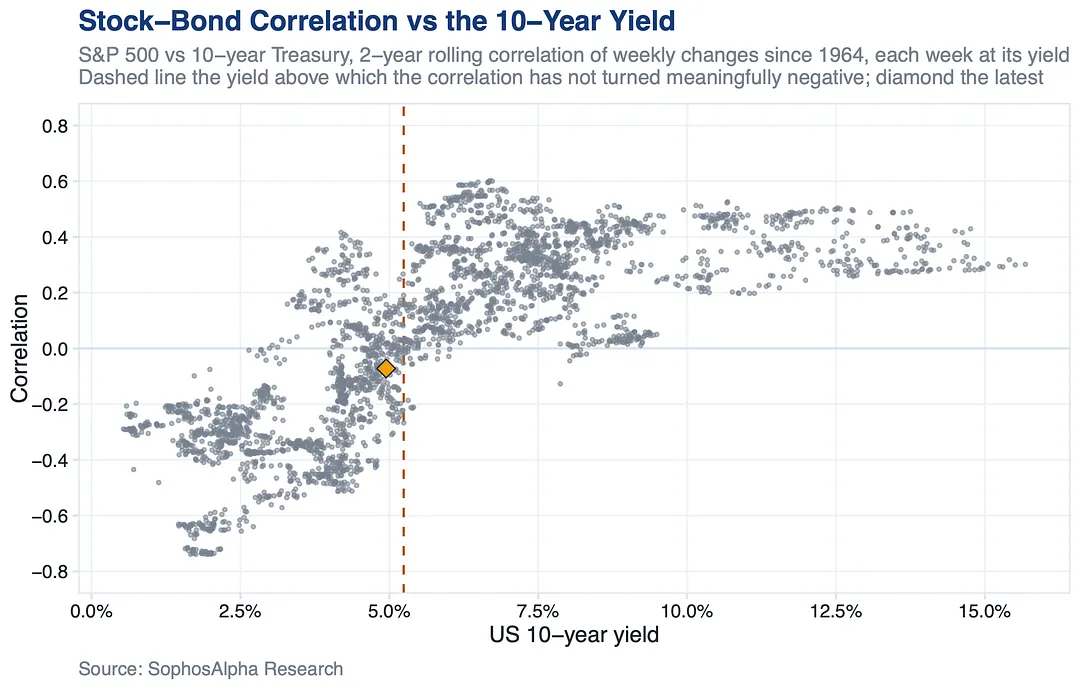
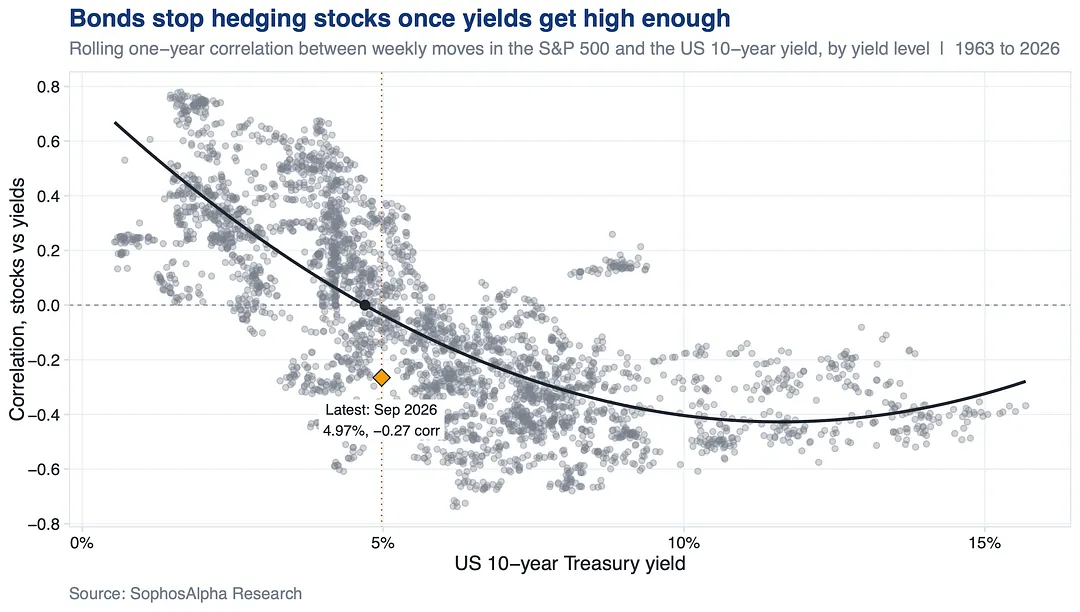
Bonds only protect your stocks when yields are low.

Every time since the 1960s that the 10 year yield sat right of that line, stocks and bonds moved together and the hedge was gone. Yields are just under it.

If the energy shock pushes them through, 60/40 has nowhere to hide.

Bonds only protect your stocks when yields are low.

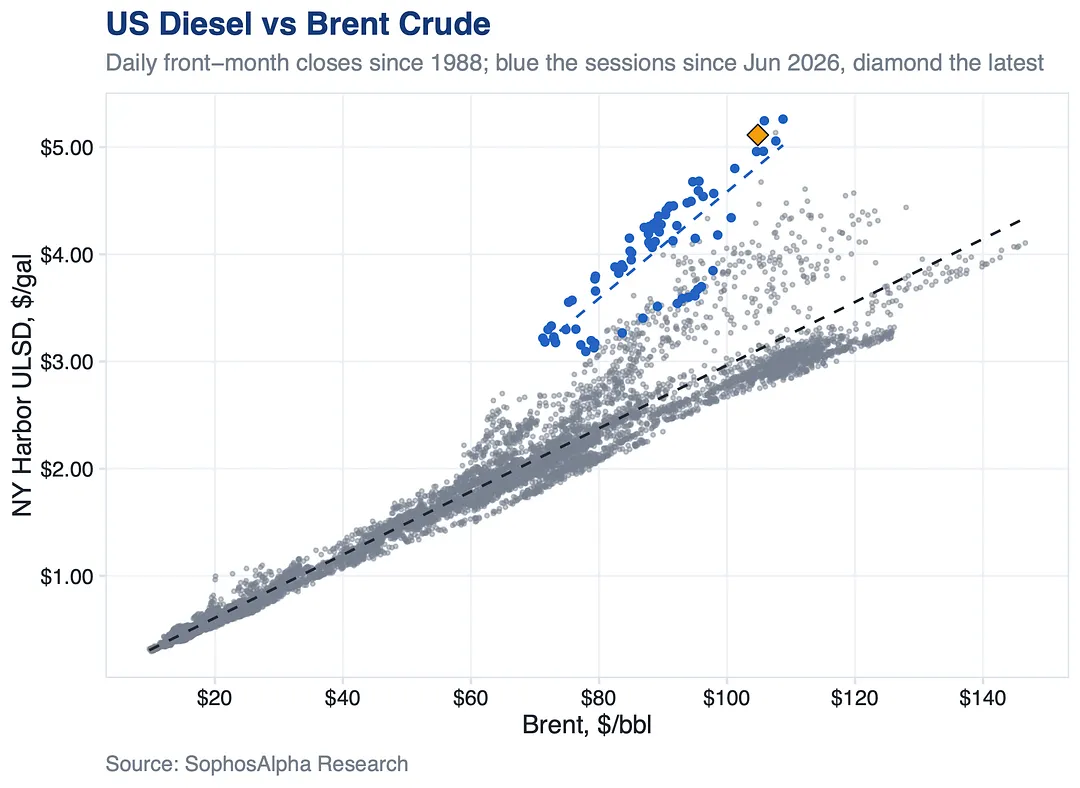
Diesel has stopped following crude oil.

For nearly four decades the two moved as one line. Since June, diesel has been trading far above anything crude can explain. The shortage is in refining, not in oil.

That is why a US diesel export ban is now a real possibility.

Diesel has stopped following crude oil.

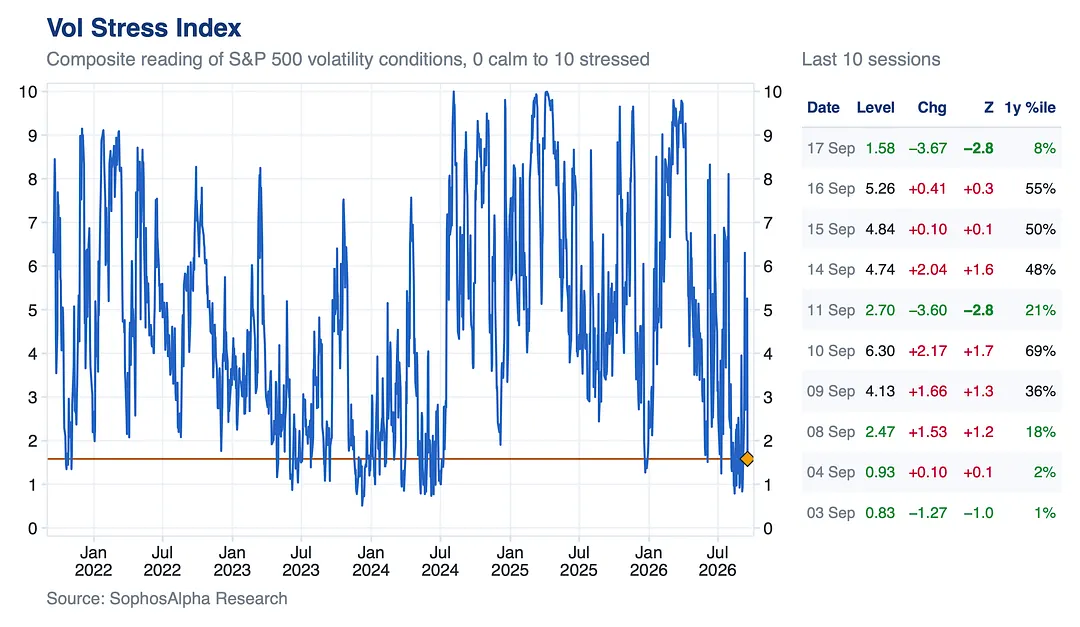
Heading into the FOMC, investors reached for volatility products to express anxiety around the market.

That panic has since completely unwound.

Our Vol Stress Index climbed all week into the meeting, then collapsed the session after the decision to the calm end of its range.

Heading into the FOMC, investors reached for volatility products to express anxiety around the market.

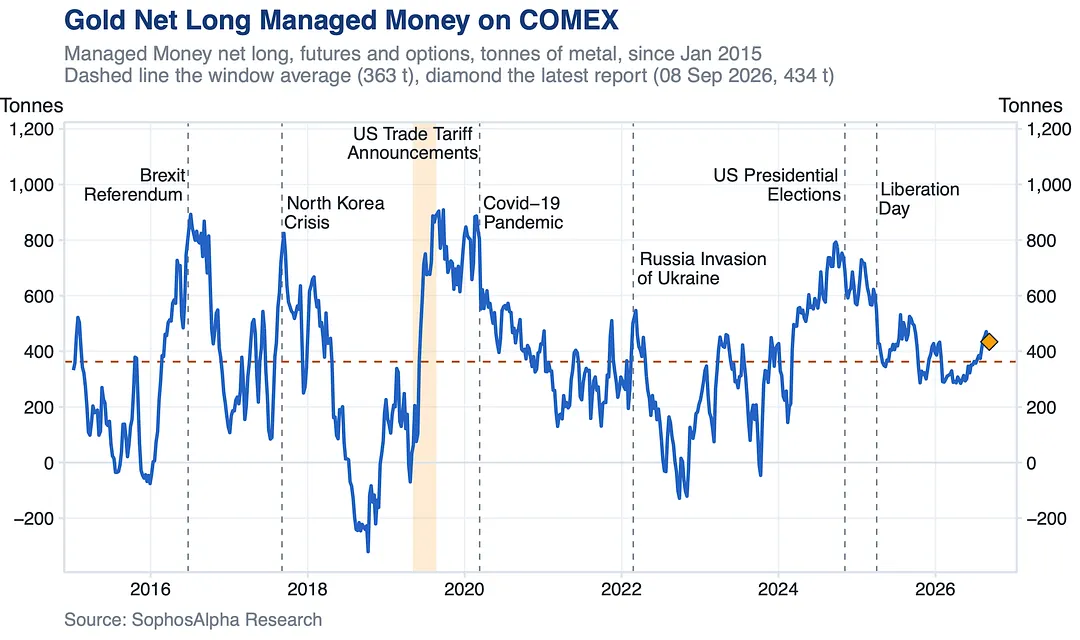
Speculative gold positioning often rises ahead of major events with wide outcome uncertainty.

Once the outcome is known, gold can sell off sharply.

COMEX Managed Money net long peaked near 890 tonnes at the 2016 Brexit vote and near 800 into the 2024 US election. Both unwound.

Speculative gold positioning often rises ahead of major events with wide outcome uncertainty.

6 notes

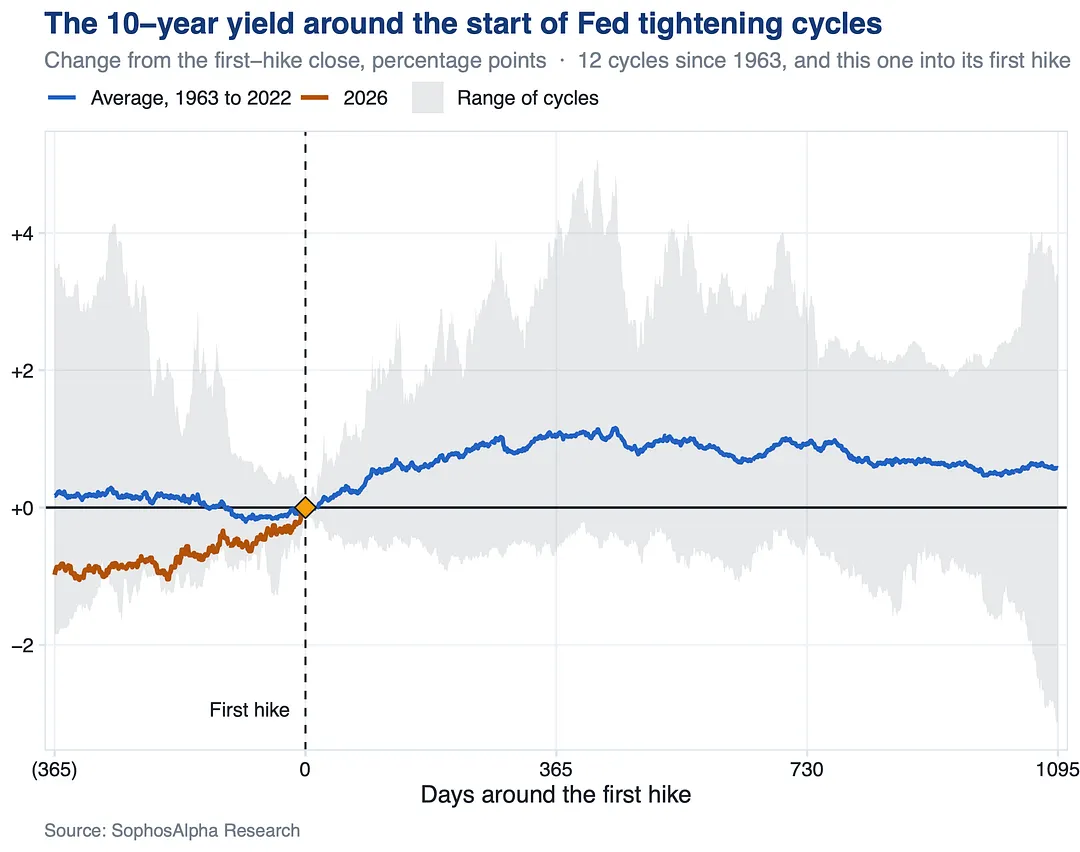
What happens to the 10Y once the Fed starts hiking?

We modeled every tightening cycle since 1963.

With rates on the move like this we looked at what the 10Y does around the start of a hiking cycle. The chart shows the average across every cycle since the early 1960s, with the range of the individual cycles behind it.

A year after the first hike the 10Y is up around 100bp on average. More telling, only one cycle, 2004, saw yields fall at any point in that first year.

On the historical odds, yields are more likely than not to rise over the coming year.

What happens to the 10Y once the Fed starts hiking?

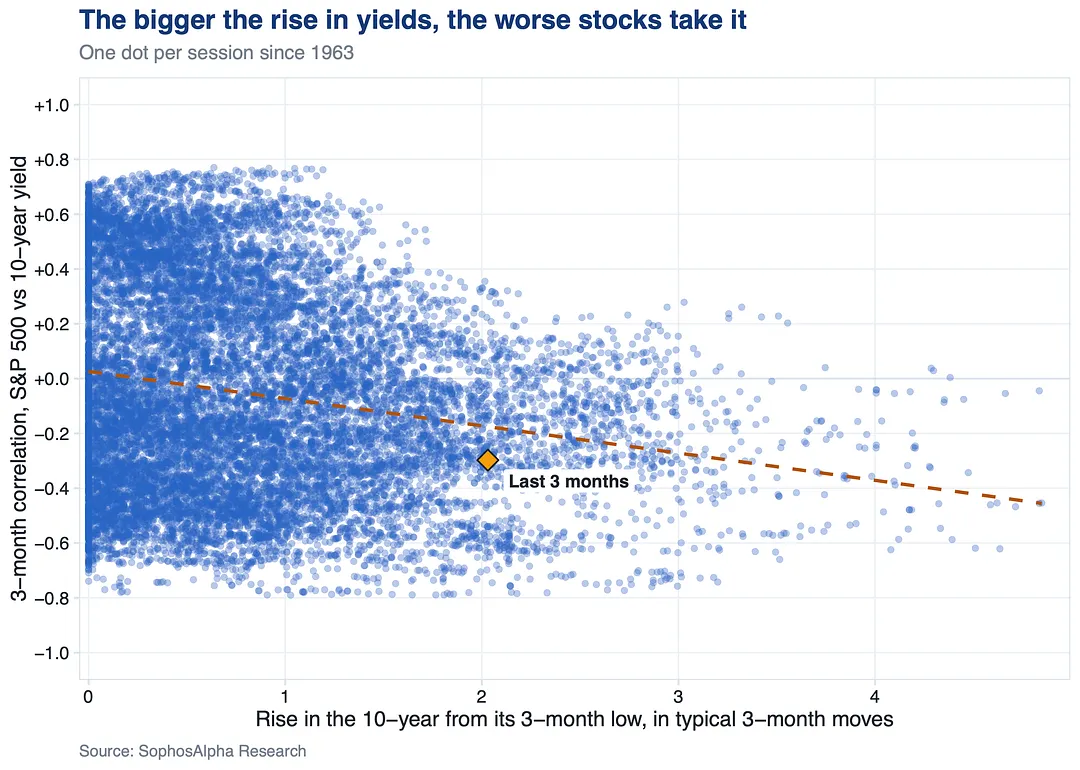
It is not the level of yields that hurts stocks, it is how fast they got there.

Near its 3 month low the 10Y and stocks move together as often as not. Two quarterly moves above it and the correlation is negative 4 times in 5.

Today the 10Y sits two moves above its low.

It is not the level of yields that hurts stocks, it is how fast they got there.

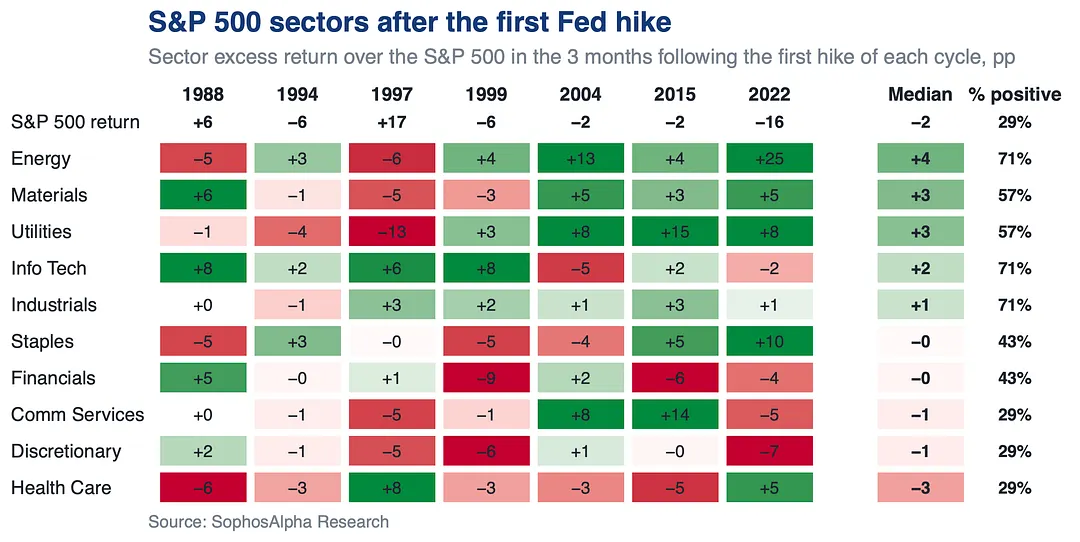
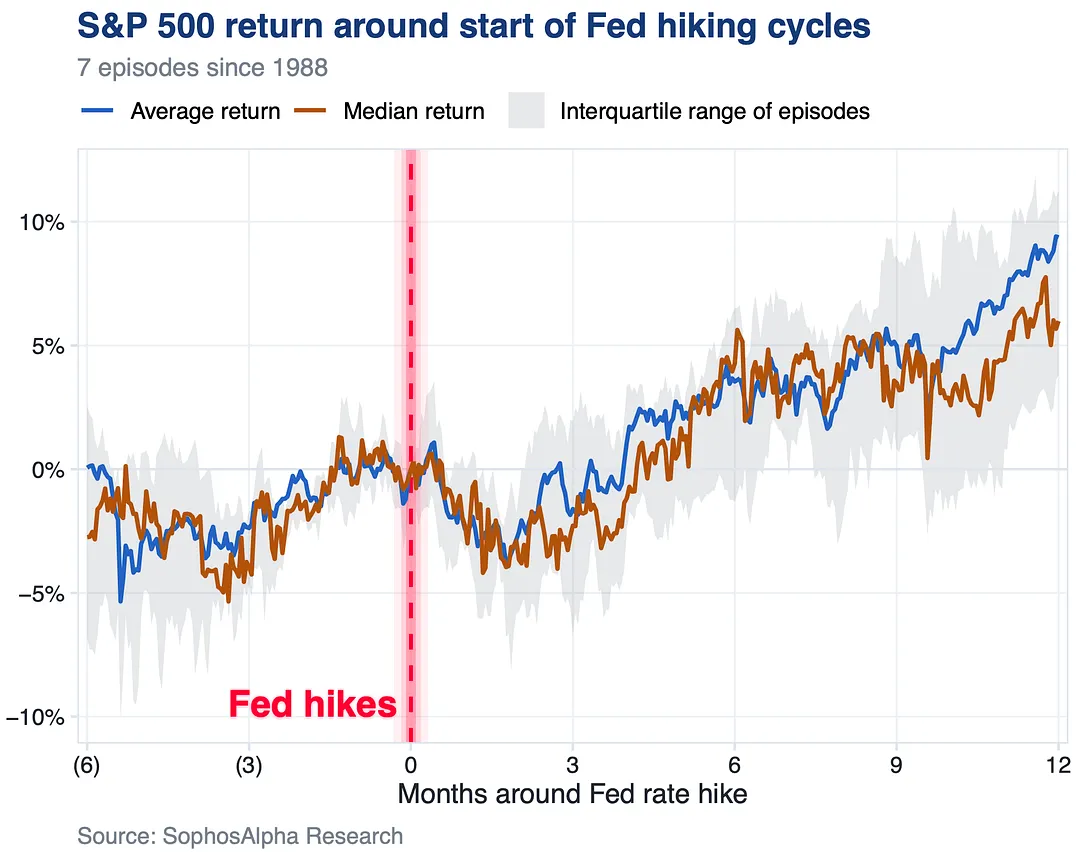
What happens to S&P 500 sectors after the first Fed hike?

We modeled every cycle since 1988.

The index is usually red 3 months on but the dip is uneven. Energy, Materials and Tech beat it in most cycles, Discretionary and Health Care lag. A year on the index is up 9% on average.

What happens to S&P 500 sectors after the first Fed hike?

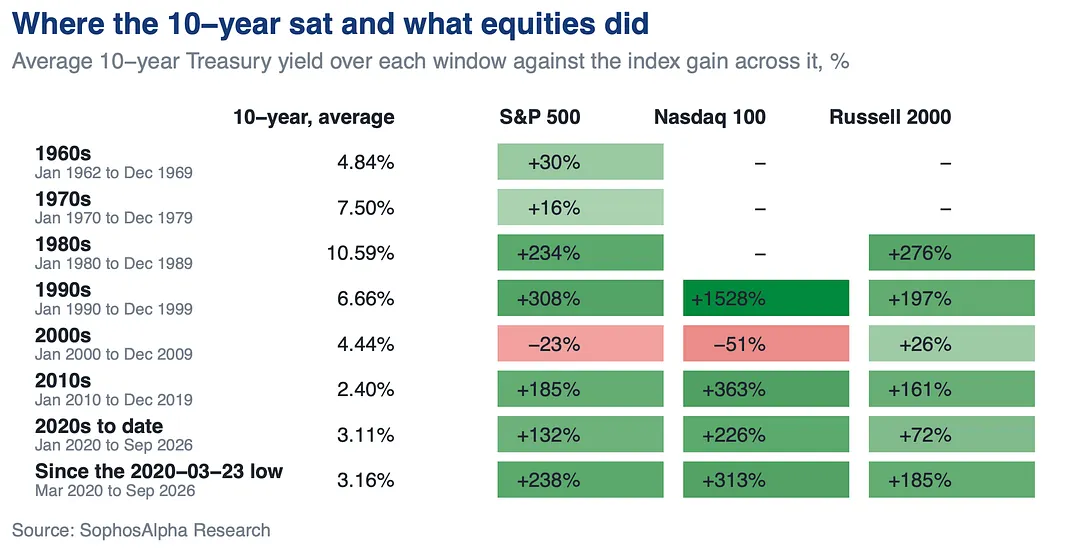
Stocks have never needed low yields.

The 10Y averaged over 10% in the 80s and the S&P tripled.

It averaged near 7% in the 90s and the NDX went up 15x. Since the 2020 low it has averaged 3% and the S&P more than tripled again.

The one losing decade, the 2000s, had yields at 4%.

Stocks have never needed low yields.

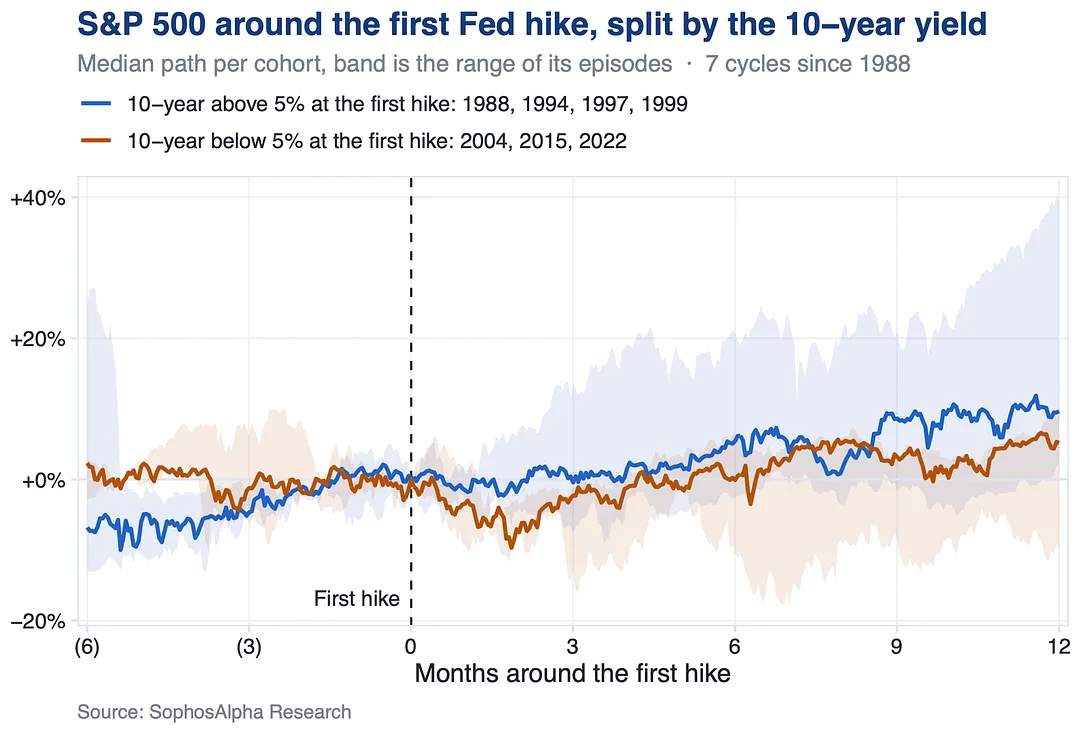
The first Fed hike only hurts stocks when yields are low.

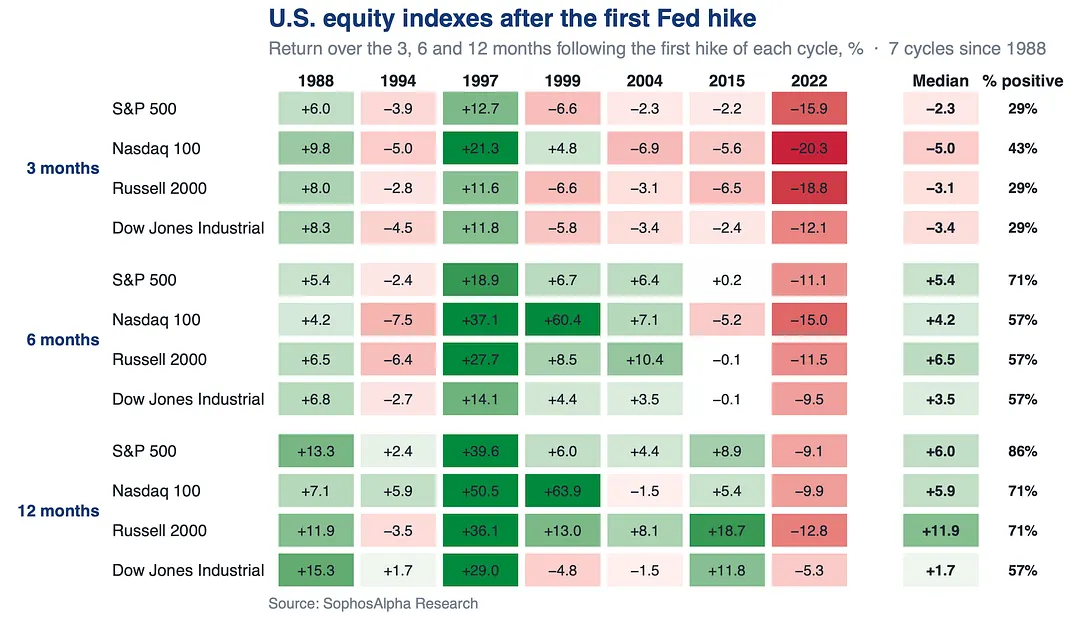
7 cycles since 1988. The 3 that started with the 10Y under 5% (2004, 2015, 2022) were all red 3 months later. The 4 that started above 5% held, and were all up a year on.

Yesterday's hike came with the 10Y at 5%.

The first Fed hike only hurts stocks when yields are low.

Bond volatility hurts stocks.

Bond yields do not.

60 years of monthly data and the S&P has one losing setup, the month the 10Y jumps more than 2sd. Sort the same months by yield level and stocks made money at every level, 3% or 8%.

September so far is a move, not a jump.

Bond volatility hurts stocks.

4 notes

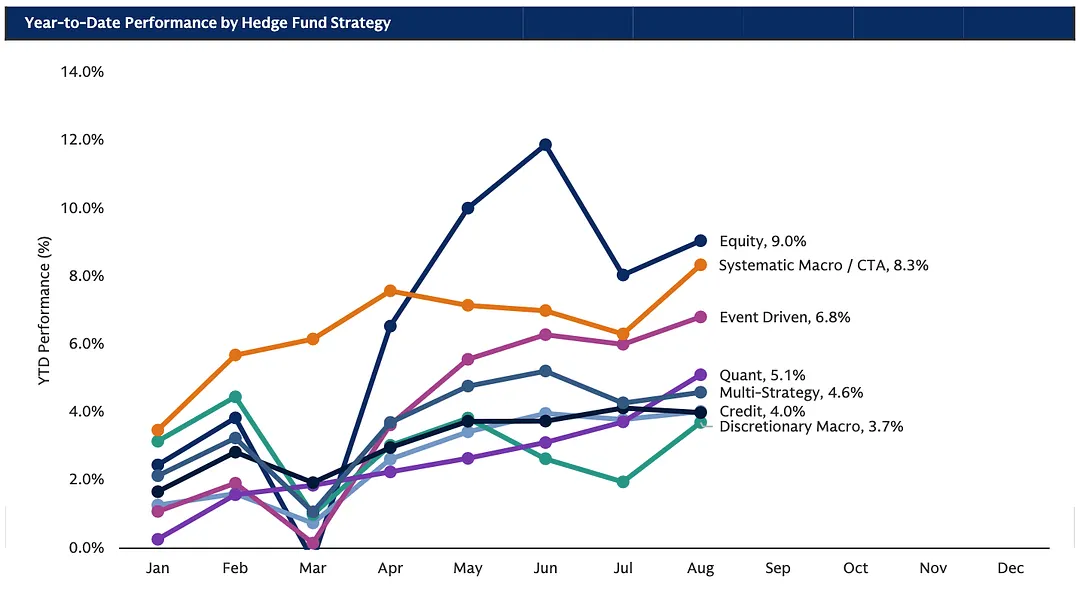
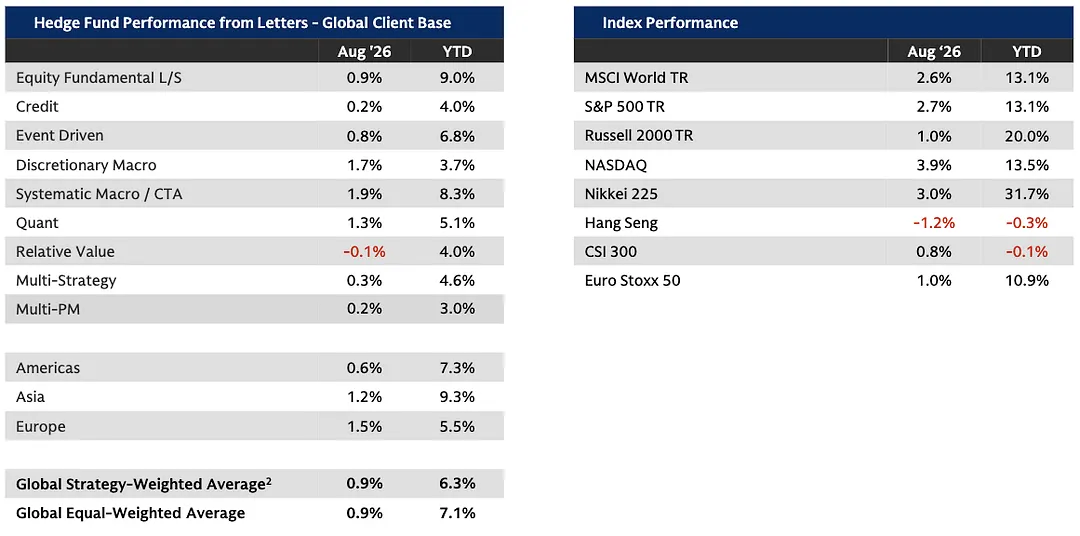
Systematic macro/CTAs were once again the top-performing hedge fund strategy in August, and remain the second best this year, riding trends across energy, metals, agriculture and equities.

We model their behavior closely in our Institutional Monitor reports and share weekly intelligence on where these funds are positioned.

Latest: https://sophosalpha.substack.com/p/institutional-monitor-b49

Systematic macro/CTAs were once again the top-performing hedge fund strategy in August, and remain the second best this year, riding trends across energy, metals, agriculture and equities.

If your favourite LARP influencer who's allergic to math is posting +150% weekly PnLs, hedge funds should hire them, because the pros aren't anywhere close.

Hedge funds made money in August but still trailed a rallying S&P 500, and even the top strategy, systematic macro, posted only modest gains. Year to date, the average fund is up about half as much as the index.

That's with the smartest algorithms and brightest PhDs money can buy. The reason is that most funds aren't chasing the index. They're chasing steady returns while limiting risk, hedging their bets so they can protect capital when markets turn.

They give up some upside in a rally to avoid the big drawdowns that wipe out accounts. That's the part the screenshots never show.

If your favourite LARP influencer who's allergic to math is posting +150% weekly PnLs, hedge funds should hire them, because the pros aren't anywhere close.

What happens to U.S. indexes after the first Fed hike?

We modeled every cycle since 1988.

The first three months are usually red across the S&P, Nasdaq, Russell and Dow. By six months it flips green, and a year on each index is up in most cycles. Only 2022 stayed red.

What happens to U.S. indexes after the first Fed hike?

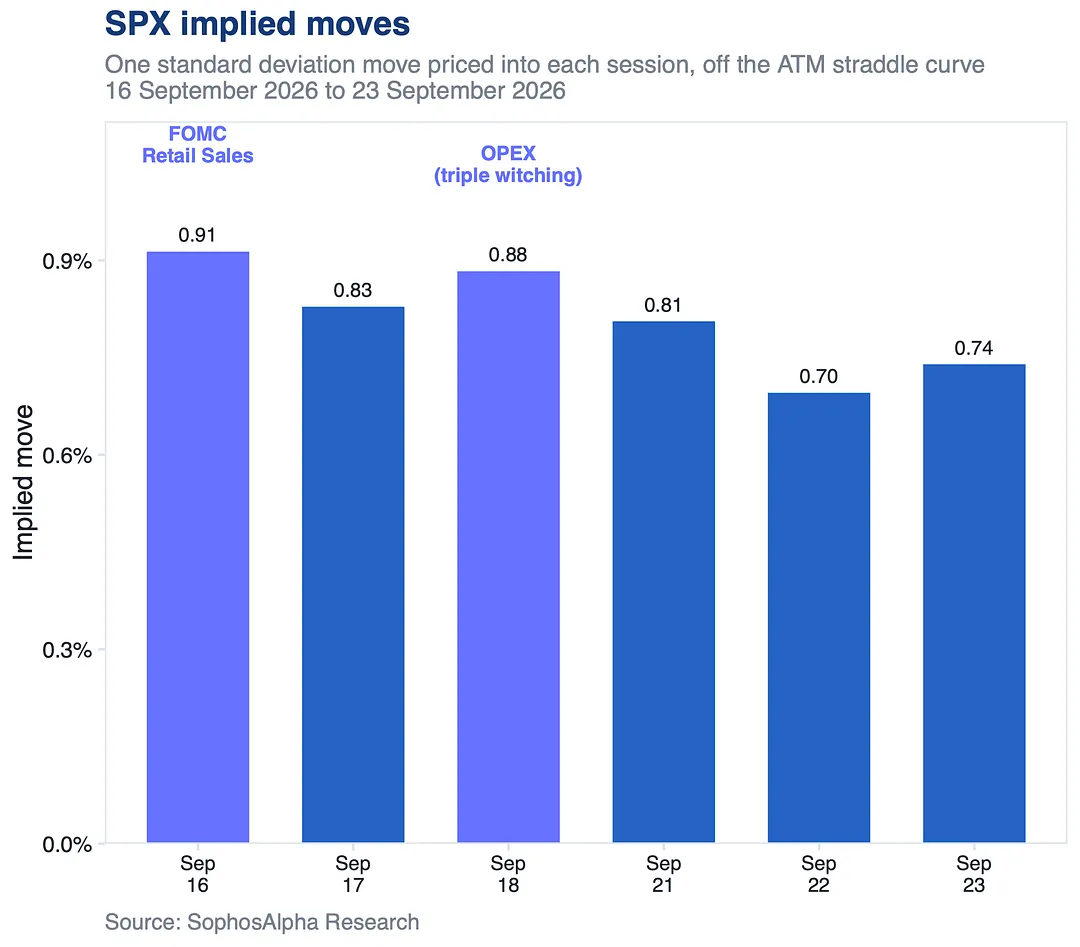
Options markets see today's Fed decision and retail sales data as the biggest event risk on the calendar.

The S&P 500's implied move for today is the highest in the window, with Friday's triple-witching expiry close behind.

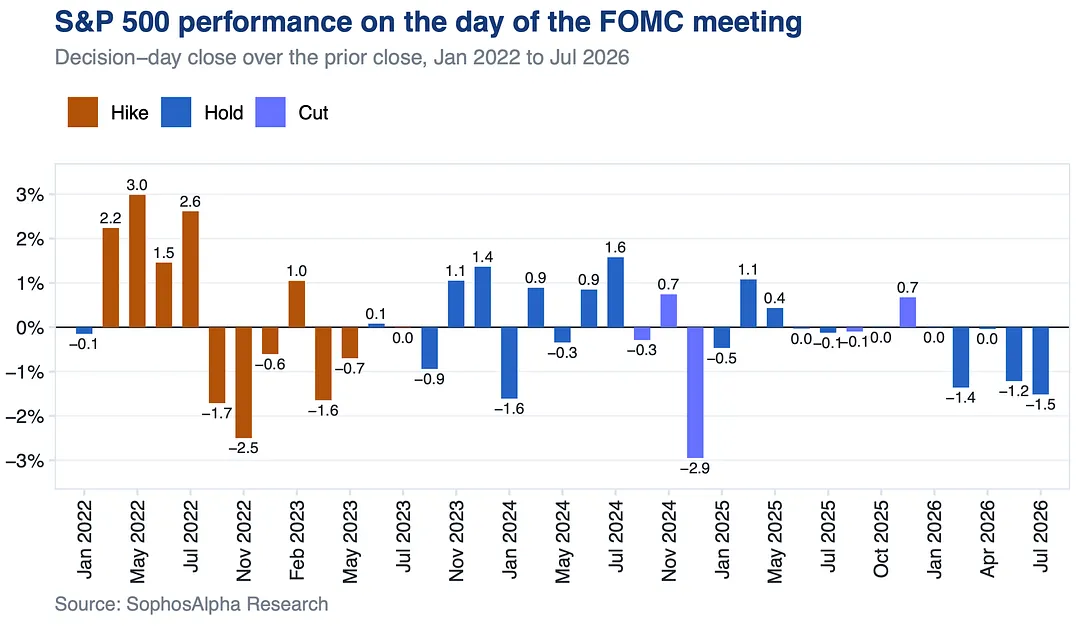
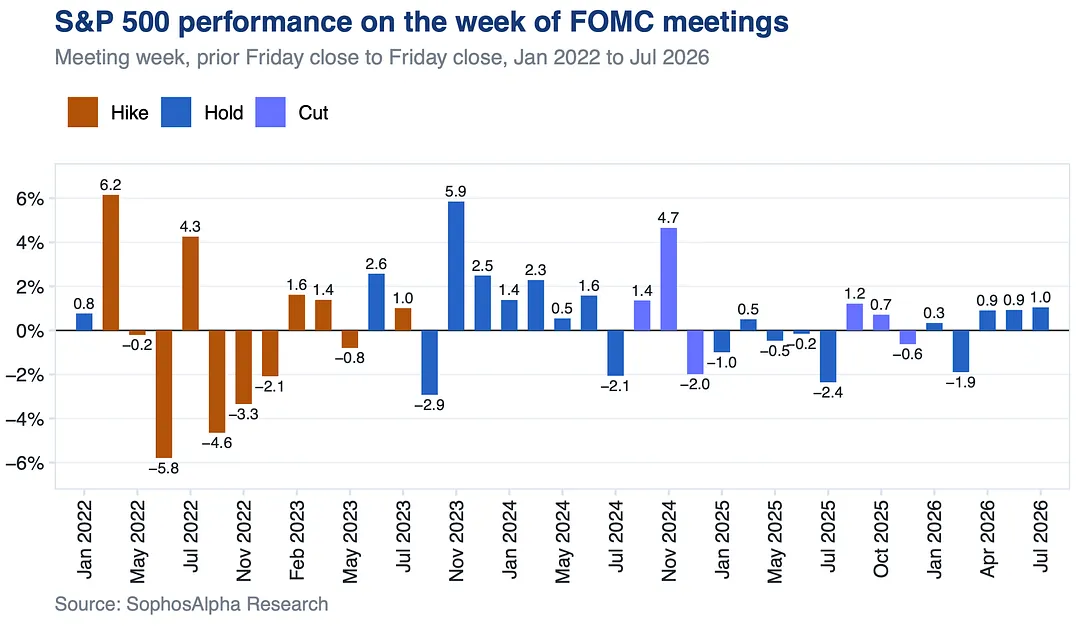
What usually happens next? Stocks have often slipped on FOMC day before recovering by Friday. The exception was 2022's hiking cycle, which makes today's expected hike worth watching closely.

https://substack.com/@sophosalpha/note/c-337498758

Options markets see today's Fed decision and retail sales data as the biggest event risk on the calendar.

7 notes

US equities usually struggle around the start of a Fed tightening cycle.

US equities usually struggle around the start of a Fed tightening cycle.

Equities have struggled on FOMC days this year, yet still ended the meeting weeks higher.

A modest rally into the decision, a selloff on the day, a recovery by Friday. The one stretch that broke the pattern was the aggressive hiking of 2022, when the pace of hiking drove the vol.

Equities have struggled on FOMC days this year, yet still ended the meeting weeks higher.Equities have struggled on FOMC days this year, yet still ended the meeting weeks higher.

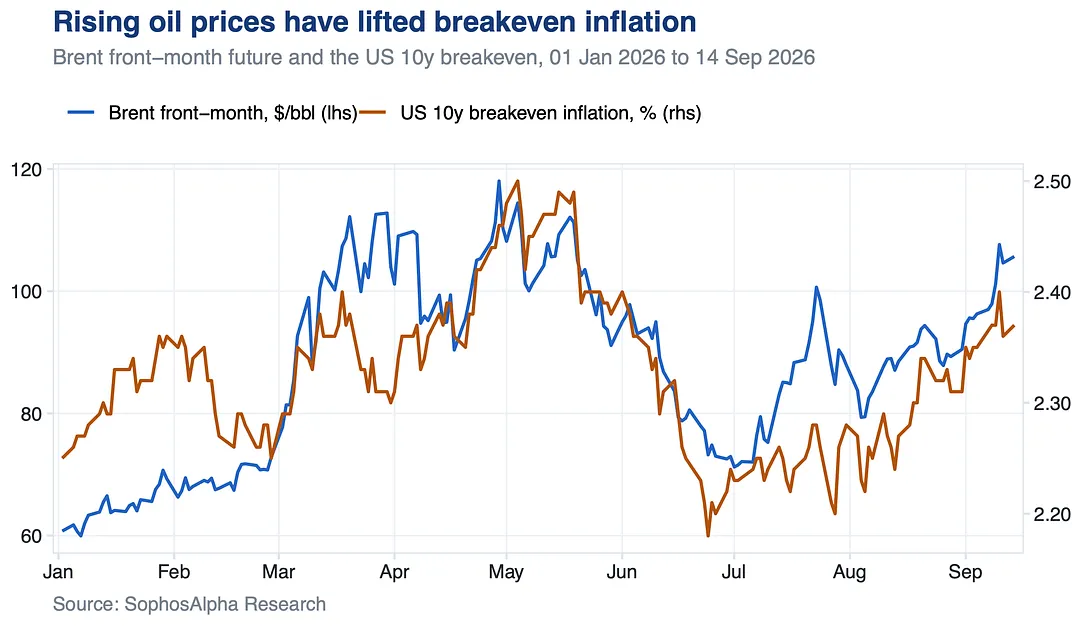
Oil is back to pricing acute disruption.

Brent has returned to the range last seen in the spring, and 10 year breakeven inflation has followed it almost step for step since the war began.

What crude does next is now a rates story as much as an energy one.

Oil is back to pricing acute disruption.

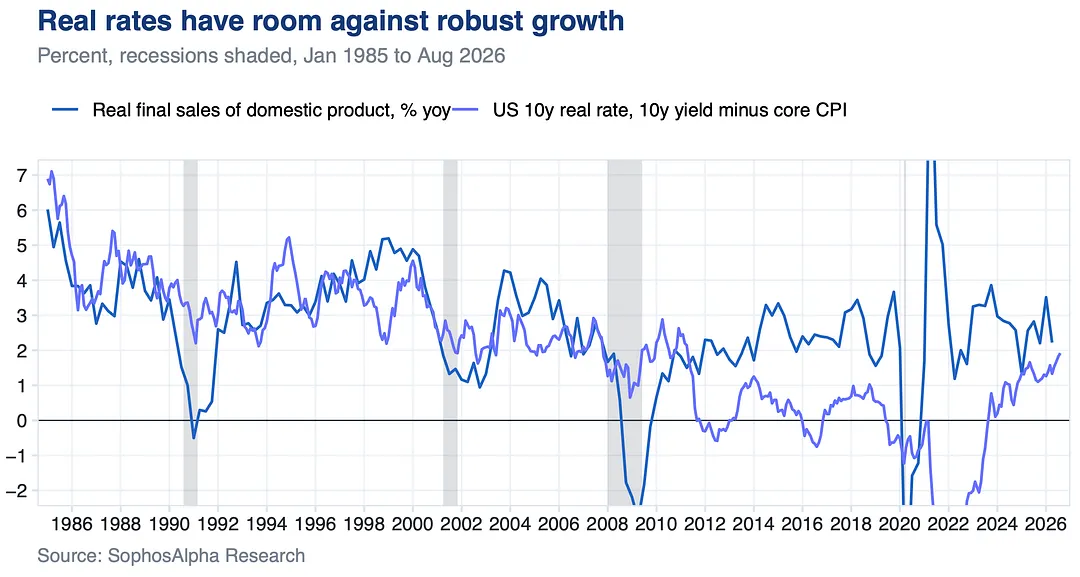
Real rates are rising into robust growth, not against it.

Real final sales of domestic product still expand at a healthy pace while the 10 year real yield has climbed to its highest since the early 2010s.

The two have moved together for decades. Growth can carry higher rates.

Real rates are rising into robust growth, not against it.

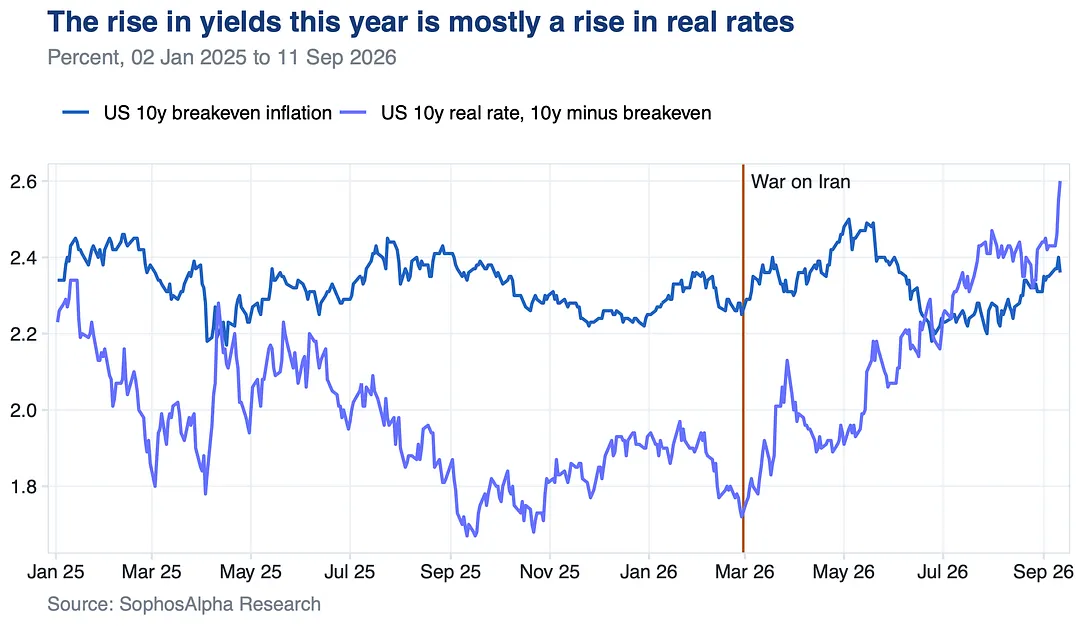
The 10 year yield sits near the top of its three year range, and the bulk of this year's rise is real rates, not inflation expectations.

Breakevens have swung with oil but sit near where they began the year. Real yields have climbed since the Iran war as markets price Fed hikes.

The 10 year yield sits near the top of its three year range, and the bulk of this year's rise is real rates, not inflation expectations.

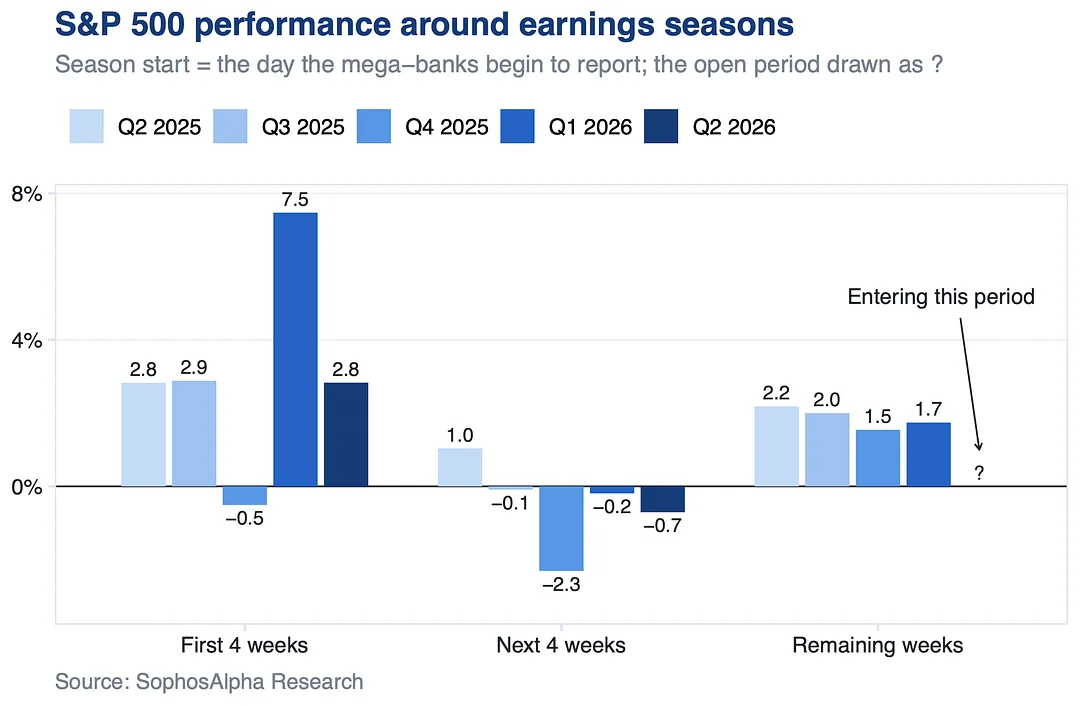
The post earnings season lull is over.

In recent quarters the S&P 500 rallied through the first weeks of reporting, went quiet for the next four as the focus shifted to sustainability, then rallied again into the next season as guidance took over.

We are entering that stretch.

The post earnings season lull is over.

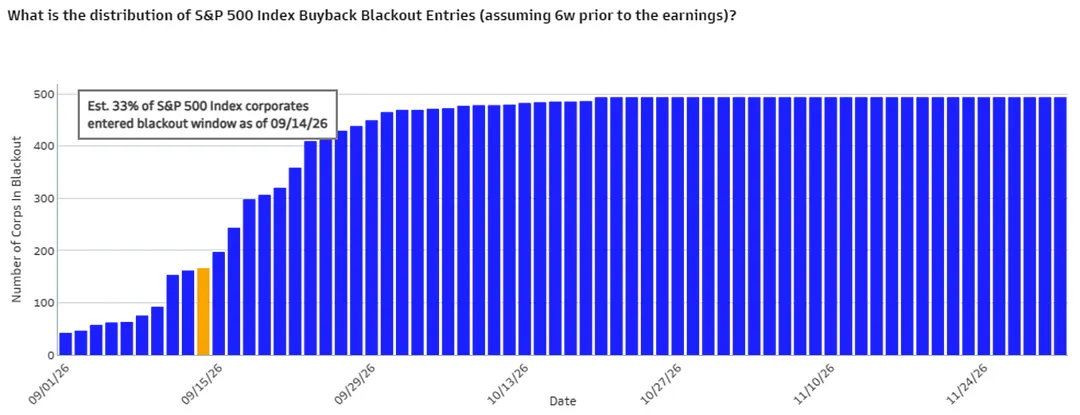
Buyback blackout season kicks in today.

About 40% of S&P 500 companies are now in their quiet period, and by early October nearly the whole index will be.

That sidelines the market's most reliable buyer until earnings reopen the window, so dips get less support.

Buyback blackout season kicks in today.

8 notes

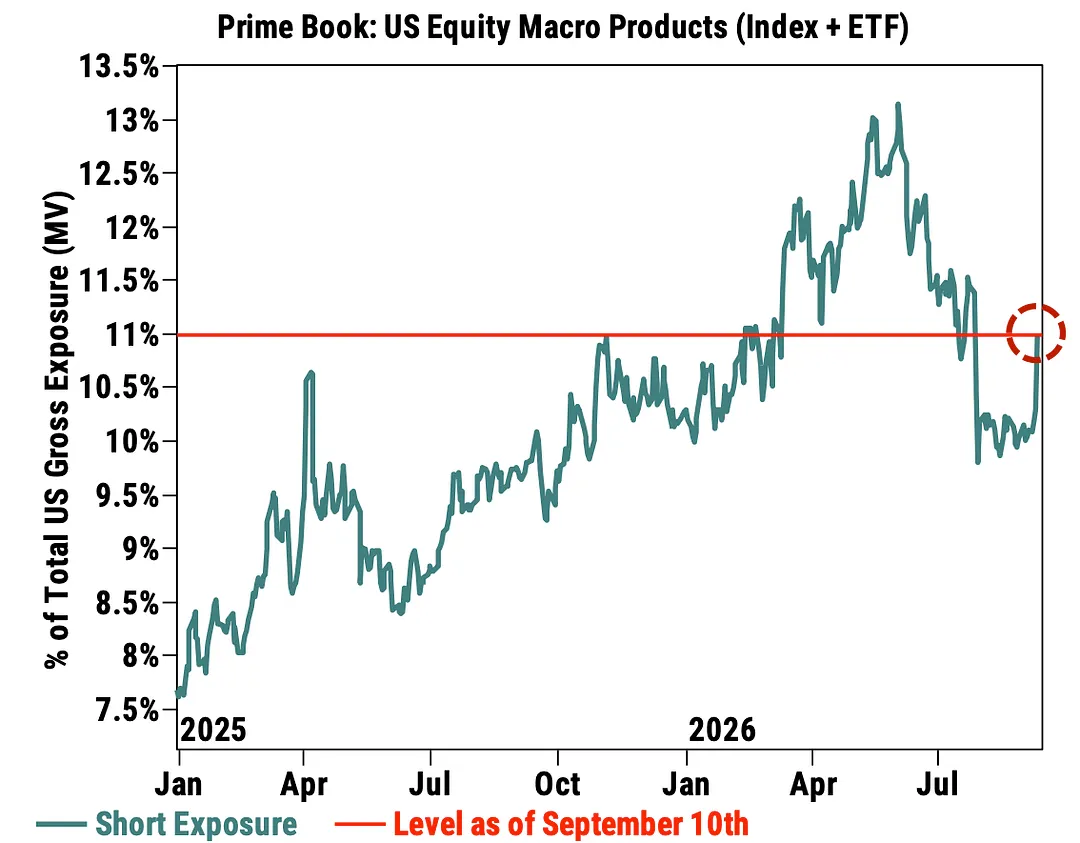
Hedge funds just pushed short exposure in index products and ETFs to its biggest weekly jump in six months, the heaviest macro selling since Liberation Day and all of it new shorts.

It still sits below the highs seen earlier this year. Hedging, not capitulation.

Hedge funds just pushed short exposure in index products and ETFs to its biggest weekly jump in six months, the heaviest macro selling since Liberation Day and all of it new shorts.

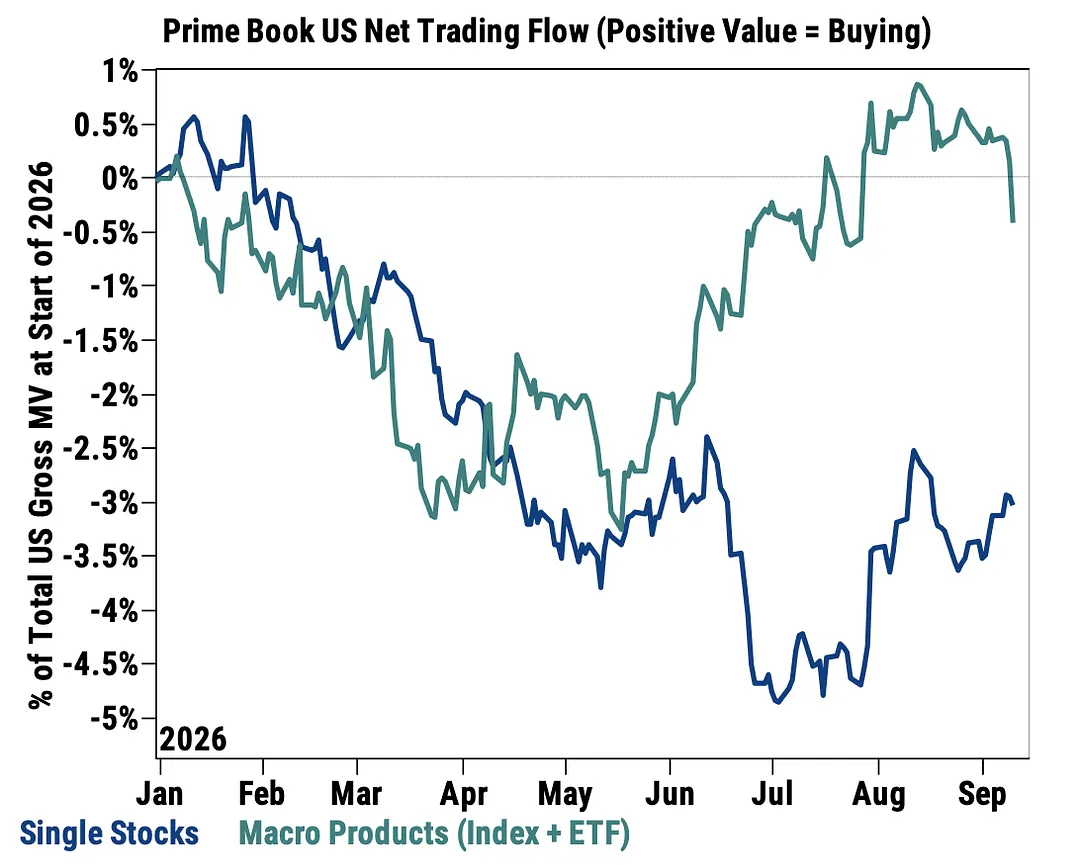
Hedge funds spent the summer steadily rebuilding index and ETF exposure.

Last week they gave all of it back in a matter of days.

Single stock buying kept grinding higher through it, led by tech. Not a de-risking, a rotation into one theme with the index hedged.
Hedge funds spent the summer steadily rebuilding index and ETF exposure.

Over 60 years, equities only lose money in months when the 10Y jumps higher unusually fast, a true rates shock.

Ordinary grinds higher, like this month so far, have been fine. The 1990s ran at far higher yields and stocks tripled.

Over 60 years, equities only lose money in months when the 10Y jumps higher unusually fast, a true rates shock.

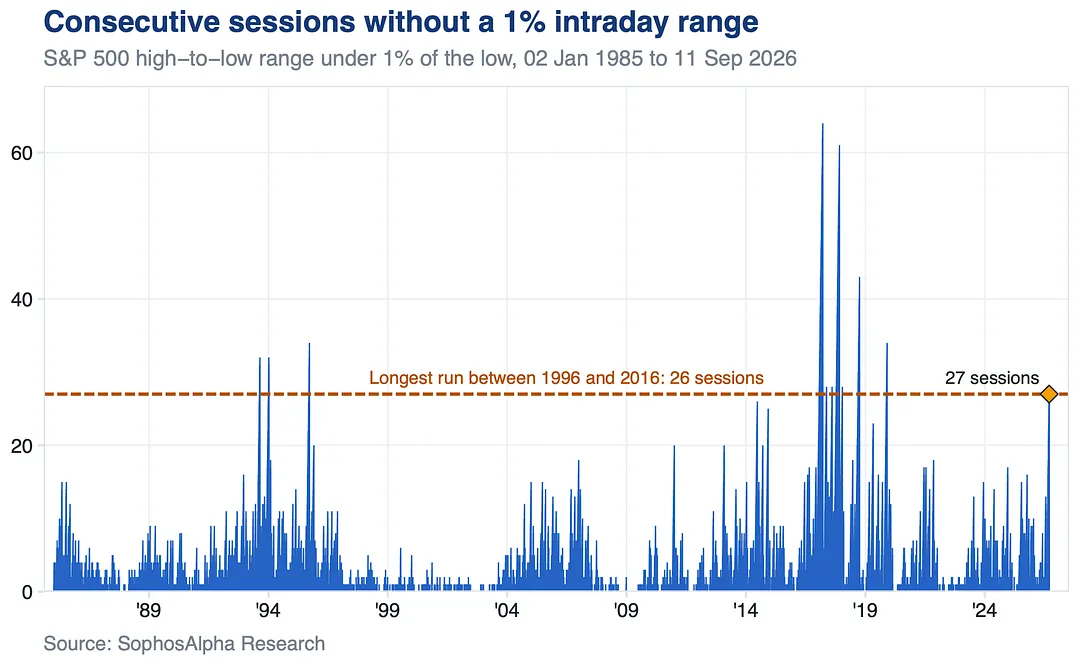
27 straight sessions without a 1% intraday range in the S&P 500.

Between 1996 and 2016 a run this long never happened once.

27 straight sessions without a 1% intraday range in the S&P 500.

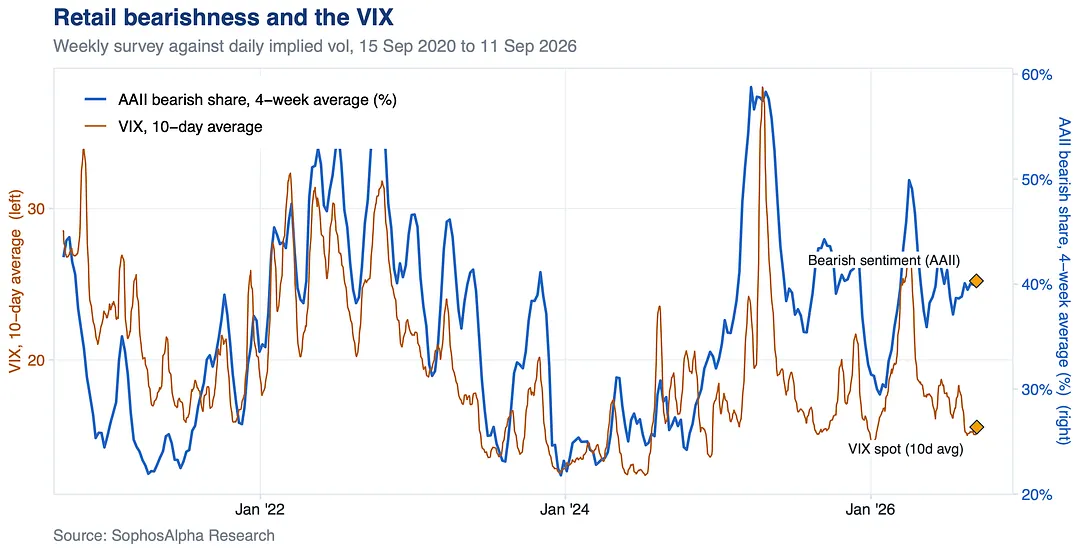
Retail is more bearish than the VIX says it should be.

Bearish sentiment in the AAII survey is running at levels that historically came with a VIX near 25, not the 15 we have today. The gap between how investors feel and what vol charges is still wide open.

Retail is more bearish than the VIX says it should be.

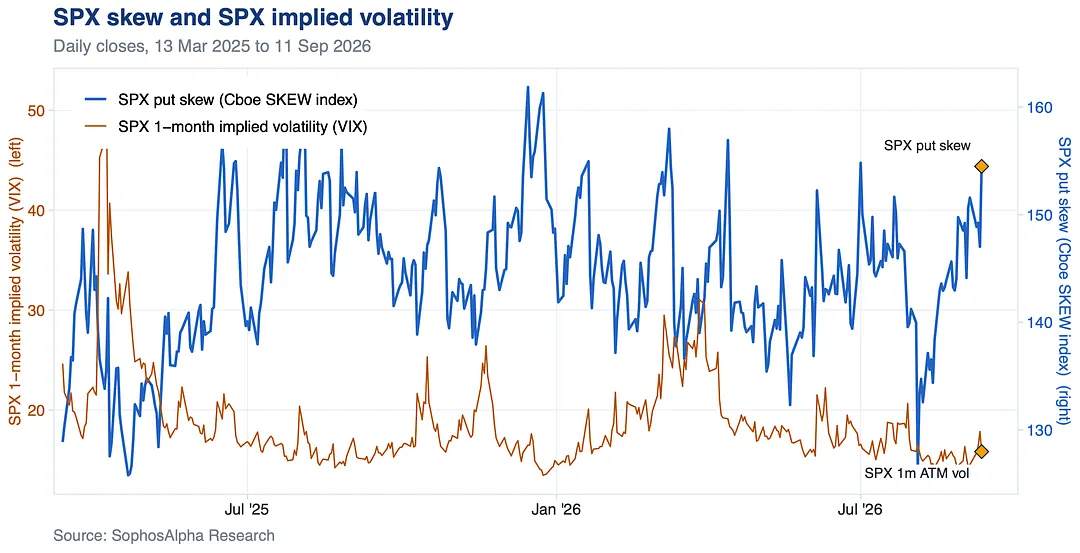
SPX put skew has steepened to its highest level since July while at the money vol barely moved.

The VIX sits in the mid teens, yet the cost of downside protection keeps climbing. Calm on the surface, and paying up underneath.

SPX put skew has steepened to its highest level since July while at the money vol barely moved.

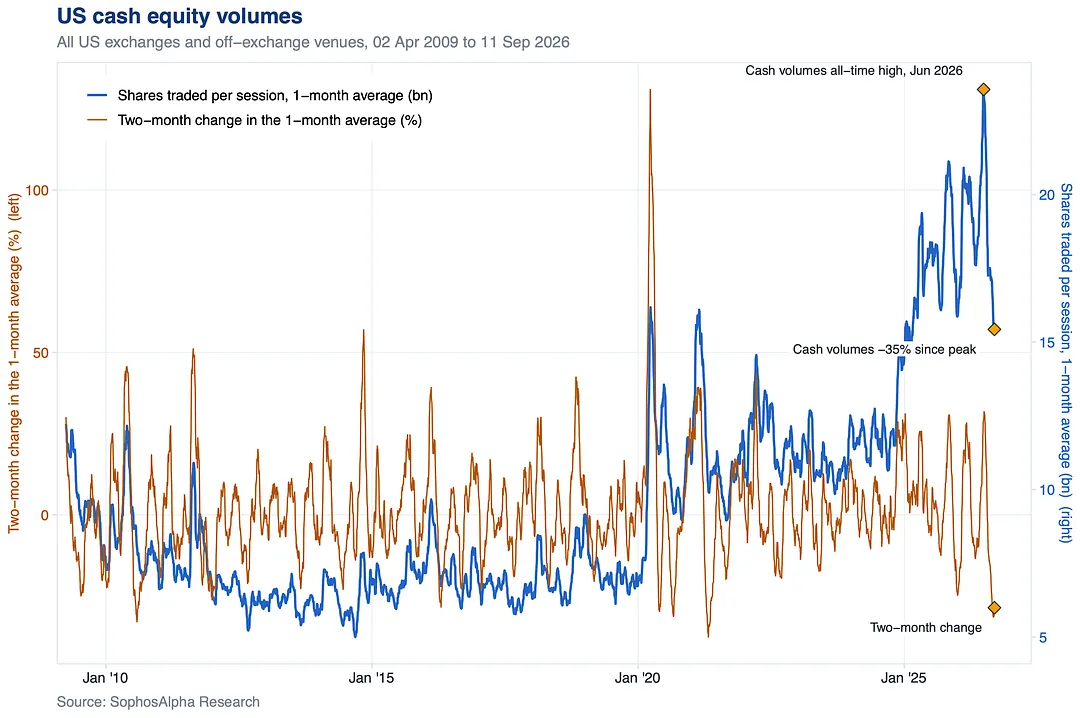
US cash equity volumes set an all time high this summer.

Since that peak they have fallen by roughly a third, the kind of drop last seen when the post covid frenzy faded.

Investor anxiety is still high, the tape is just thinner.

US cash equity volumes set an all time high this summer.

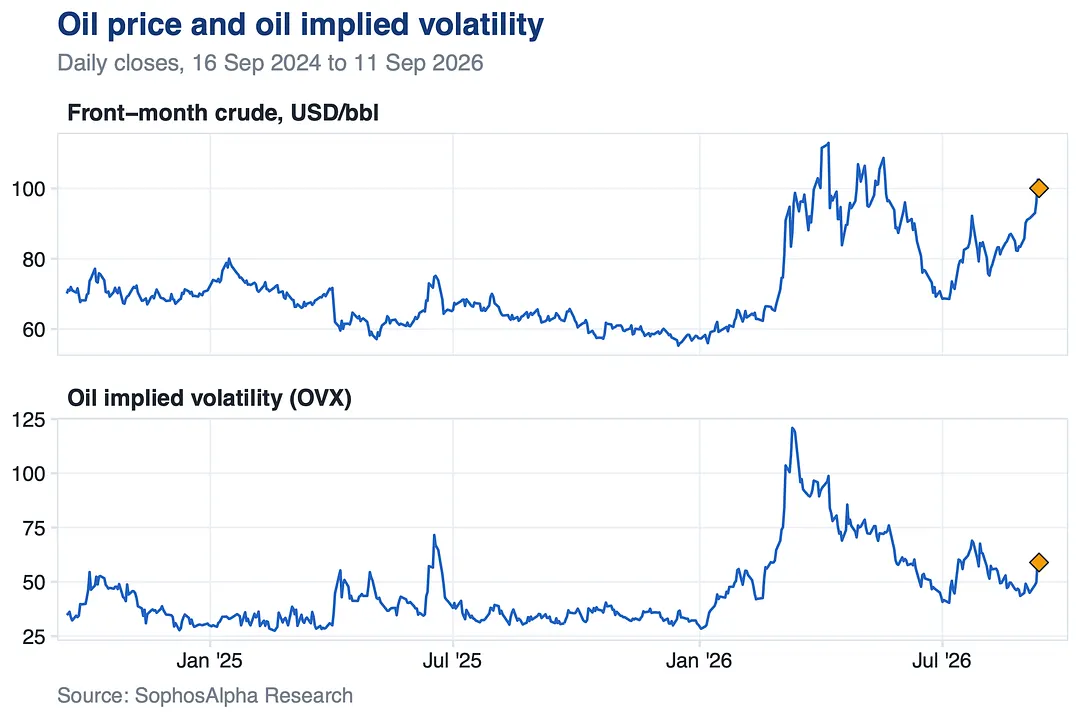
Crude is back above 100 and oil is back at the center of the conversation.

The last time it traded here in the spring, oil implied vol was roughly double where it sits today.

The price has returned, the fear has not.

Crude is back above 100 and oil is back at the center of the conversation.

one note

Diversification is harder to secure and increasingly important.

The stock bond relationship cannot be taken for granted when inflation, fiscal pressure and rising yields weigh on both markets at once. Yields sit near levels where that hedge has historically been least reliable.

Diversification is harder to secure and increasingly important.

3 notes

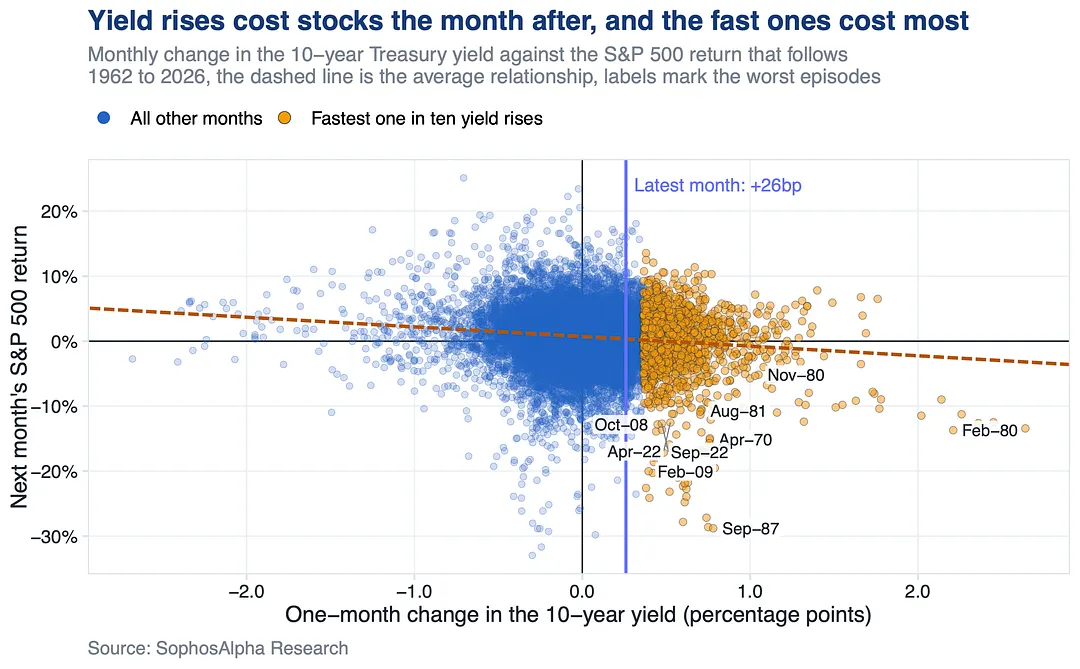
The 30 year just closed at 5.36%, its highest since 2004.

Does that hurt stocks?

Since 1962 each 10bp the 10 year rises in a month has cost the S&P about 15bp the month after, and the losses cluster in the fastest rises. This move, 26bp in a month, is not the fast kind yet.

The 30 year just closed at 5.36%, its highest since 2004.

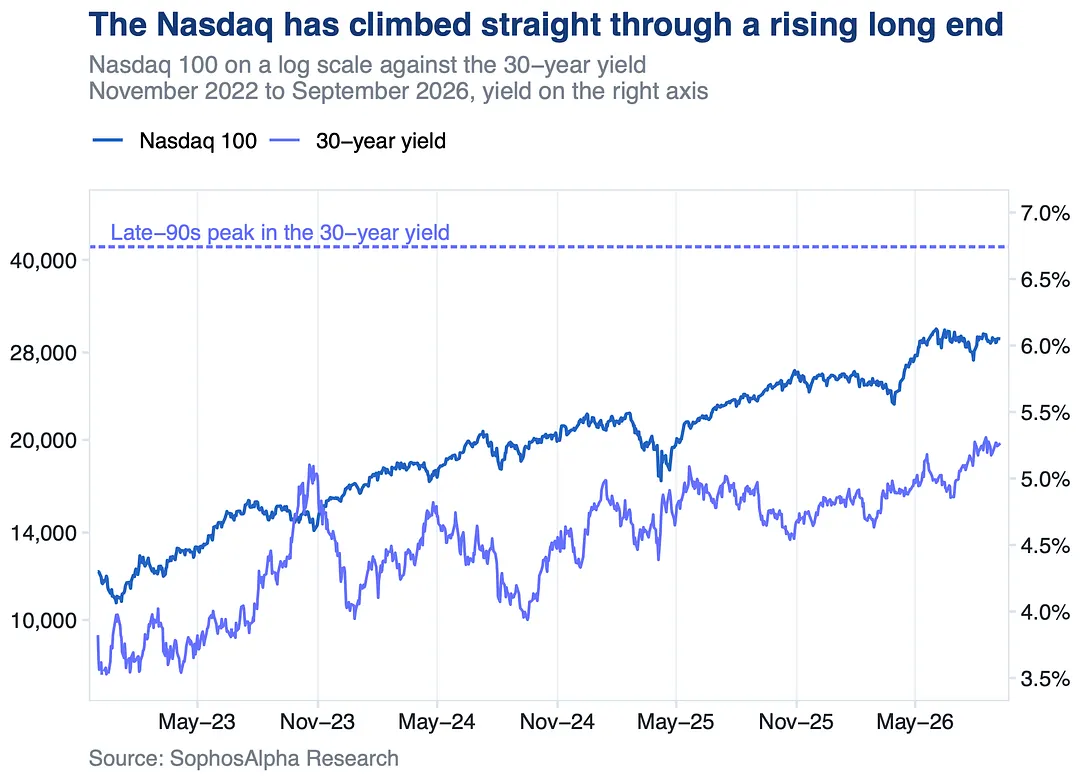
Since ChatGPT launched in November 2022, the Nasdaq 100 has rallied while the 30 year yield rose, driven by strong earnings and AI enthusiasm.

Since ChatGPT launched in November 2022, the Nasdaq 100 has rallied while the 30 year yield rose, driven by strong earnings and AI enthusiasm.

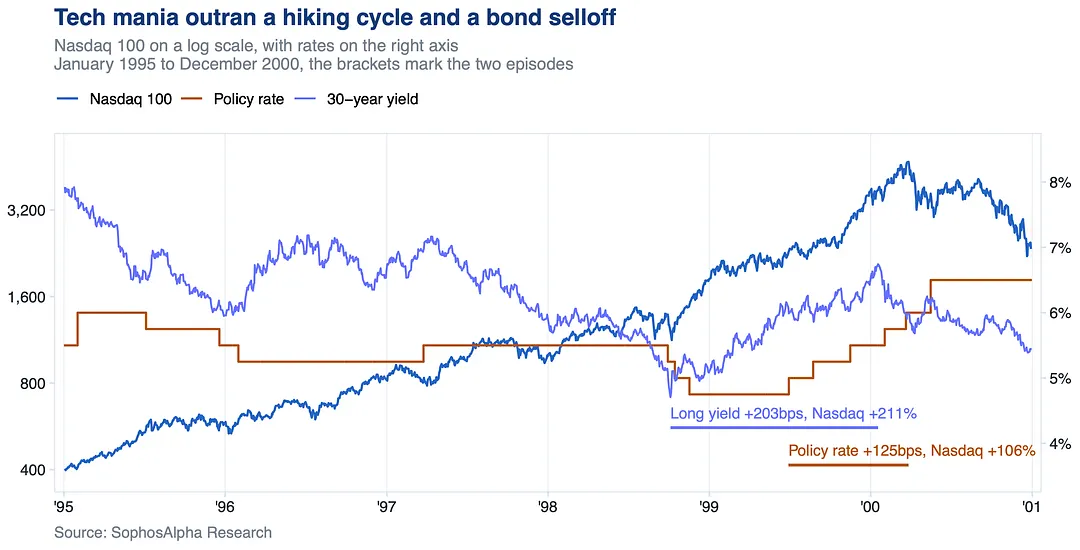
Bubbles fuelled by tech euphoria can overcome the macro headwinds of rising rates, as evidenced by the Dotcom boom of the late 90s.

The Nasdaq 100 tripled as the 30 year yield added 200bps. Over an overlapping window it doubled again while the Fed hiked 125bps.

Bubbles fuelled by tech euphoria can overcome the macro headwinds of rising rates, as evidenced by the Dotcom boom of the late 90s.

7 notes

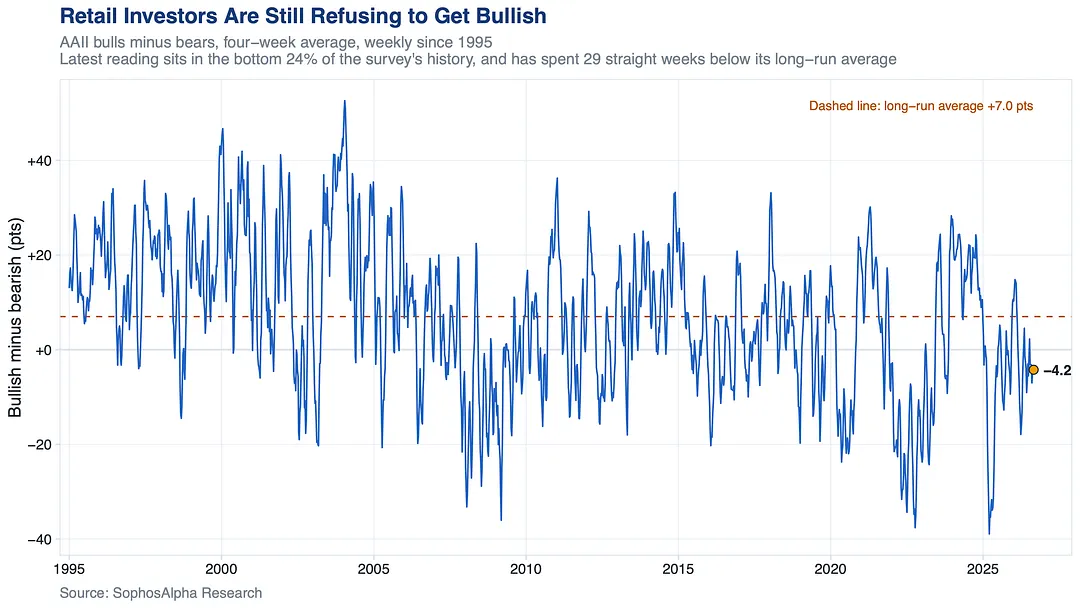
Retail sentiment has been below its long run average for 29 straight weeks.

AAII bulls minus bears sits in the bottom quarter of readings since 1995, even with the S&P within 3% of a record set last month.

Nobody got euphoric on this rally, so there is no crowd to unwind.

Retail sentiment has been below its long run average for 29 straight weeks.

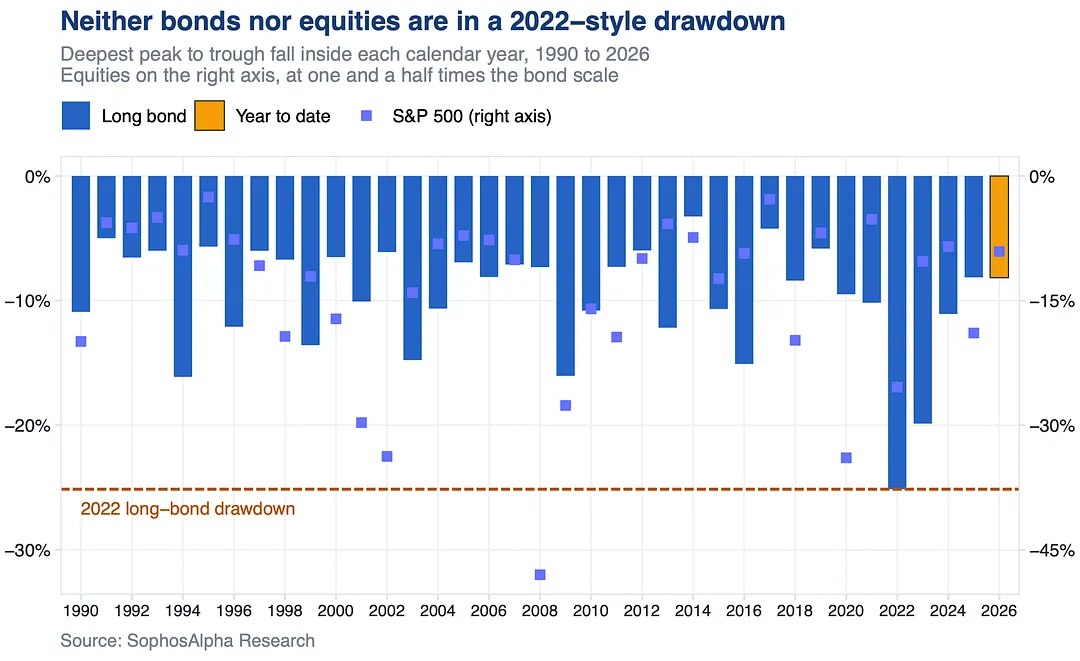
The long bond is having a bad year, not a 2022 year.

Its deepest fall this year is about 8%, against 25% in 2022.

The S&P 500 has given up 9%, against 25%. Yields at multi year highs are a real fiscal signal, but the tightening carried with them has been far gentler.

The long bond is having a bad year, not a 2022 year.

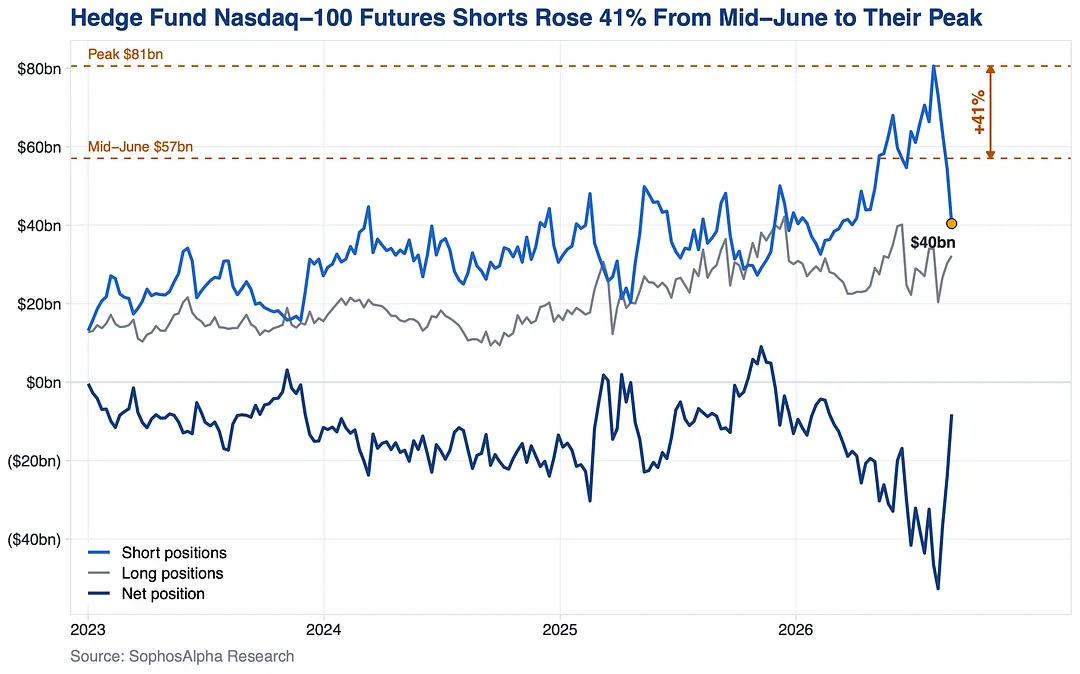
Hedge funds built Nasdaq 100 futures shorts 41% higher from mid June into the peak, then covered all of it and more in four weeks.

Shorts now sit 29% below where the build started. The squeeze fuel everyone was pointing to has already been spent.

Hedge funds built Nasdaq 100 futures shorts 41% higher from mid June into the peak, then covered all of it and more in four weeks.

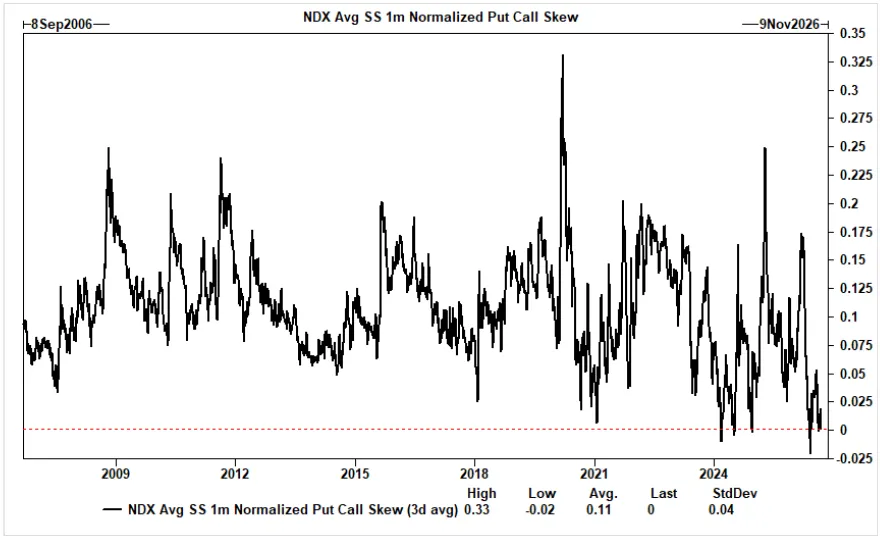
Options traders have stopped paying up for downside in tech.
Average put call skew across NDX single stocks is near the flattest in 20 years, and implied vol has collapsed since the summer. Upside and downside cost roughly the same now. Convexity is cheap, not crowded.

Options traders have stopped paying up for downside in tech.
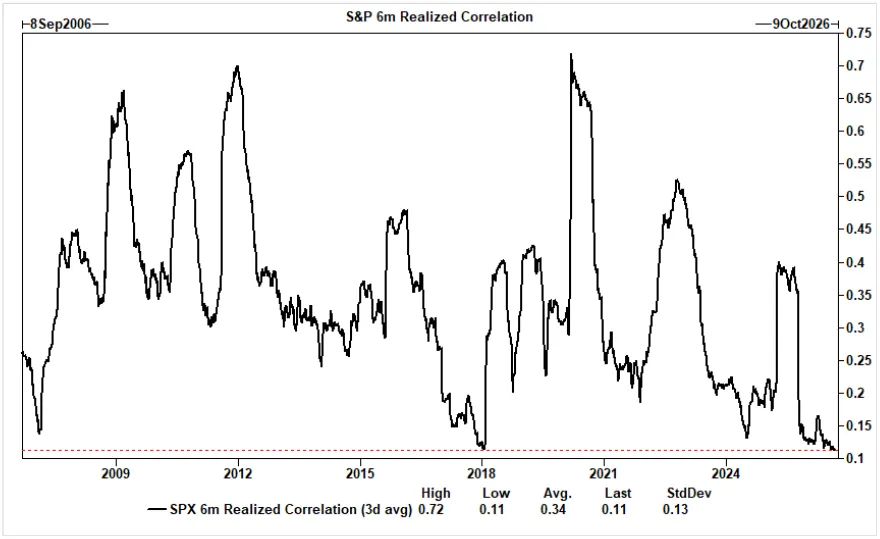
S&P 6 month realized correlation just traded through the lowest level on record.
Single stocks are moving on their own stories, and that is what keeps index vol pinned. History says correlation this low does not last, and the unwind tends to show up as a burst of index vol.

S&P 6 month realized correlation just traded through the lowest level on record.

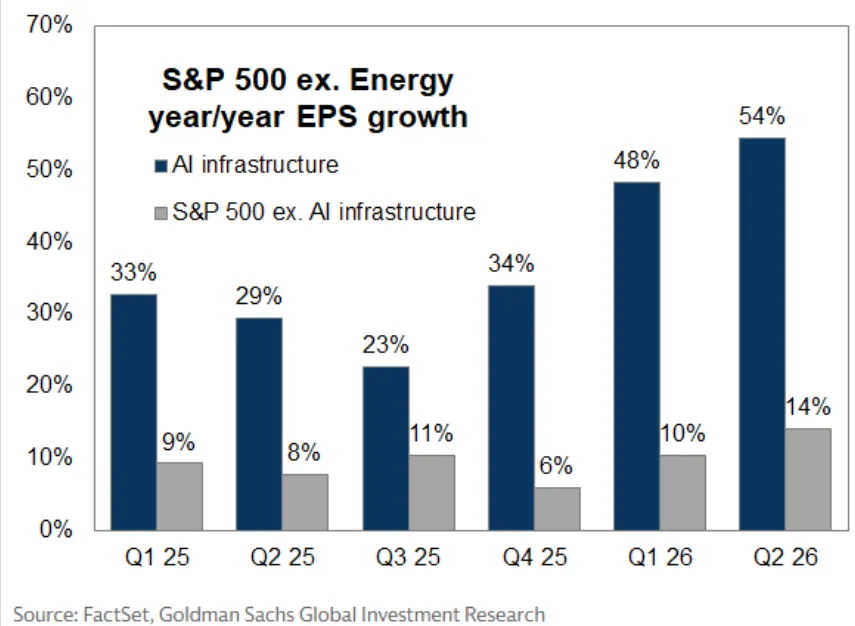
AI infrastructure earnings grew 54% y/y in Q2 and drove about half of all S&P 500 EPS growth.
The part that gets missed is the rest of the market. Excluding energy, it grew 14%, its strongest in at least six quarters. The earnings base is broadening, not narrowing.
AI infrastructure earnings grew 54% y/y in Q2 and drove about half of all S&P 500 EPS growth.

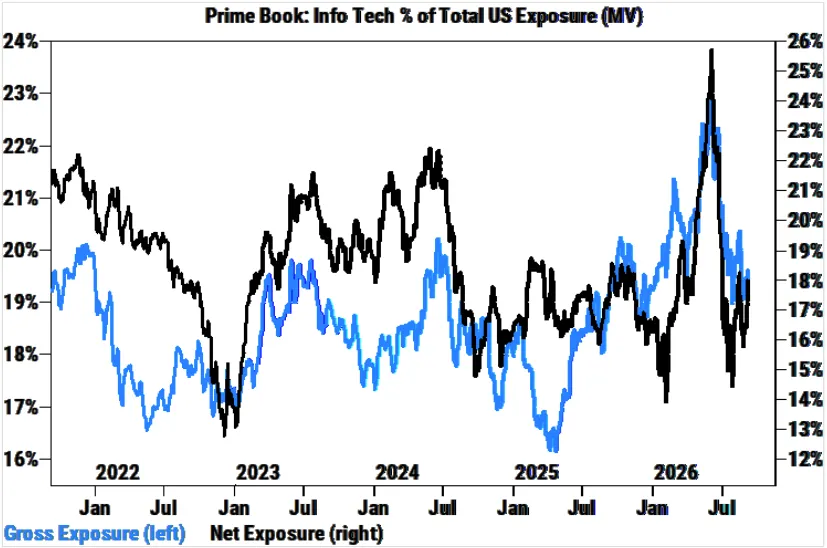
Hedge funds pushed Info Tech exposure to five year highs in June, then spent the summer unwinding it.

This quarter's de-grossing was one of the sharpest since 2020, and gross leverage now sits near the low end of the past year.

Hedge funds pushed Info Tech exposure to five year highs in June, then spent the summer unwinding it.

7 notes

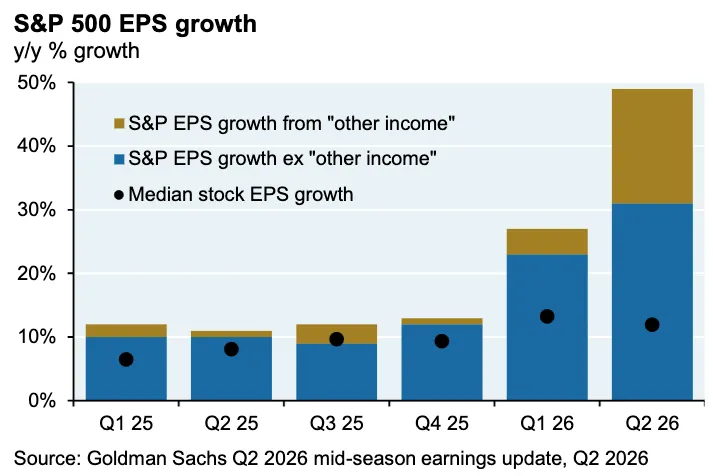
S&P 500 earnings growth looks spectacular this quarter.

The median company isn't seeing it.

A growing share of index EPS growth is "other income," largely unrealized valuation gains on OpenAI and Anthropic stakes. Mark-to-market gains are not operating earnings.

S&P 500 earnings growth looks spectacular this quarter.

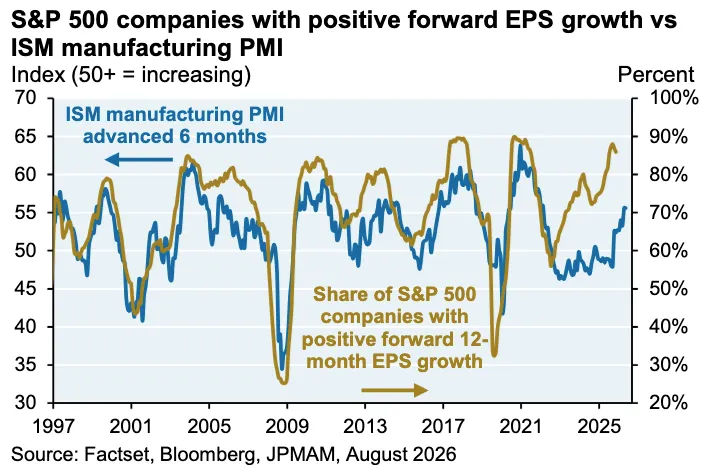
Earnings breadth has broken away from the manufacturing cycle.

The share of S&P 500 companies with positive forward EPS growth normally tracks ISM manufacturing with a 6 month lead. Since the AI capex boom it has run well ahead of the survey.

Earnings breadth has broken away from the manufacturing cycle.

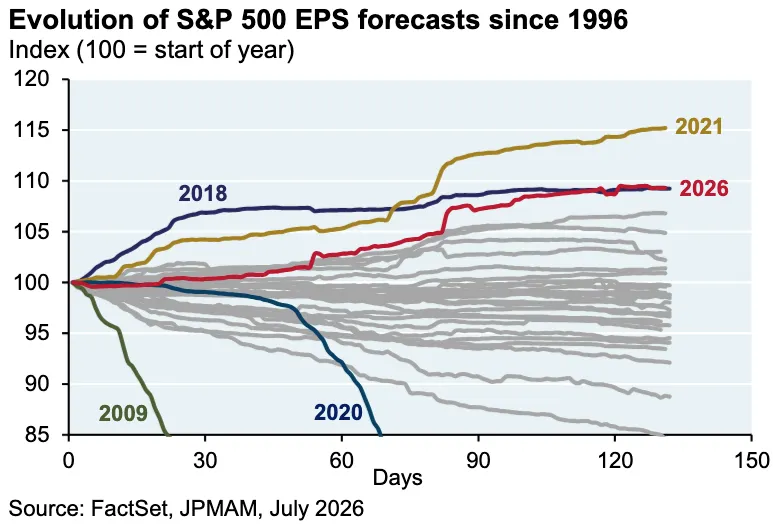
Analysts almost always cut S&P 500 estimates as the year wears on.

In 2026 they've been raising them.

This year's forecast path is tracking near the top of every year since 1996, alongside 2018 and 2021. Revisions this one-sided are rare, and leave little room for error.

Analysts almost always cut S&P 500 estimates as the year wears on.

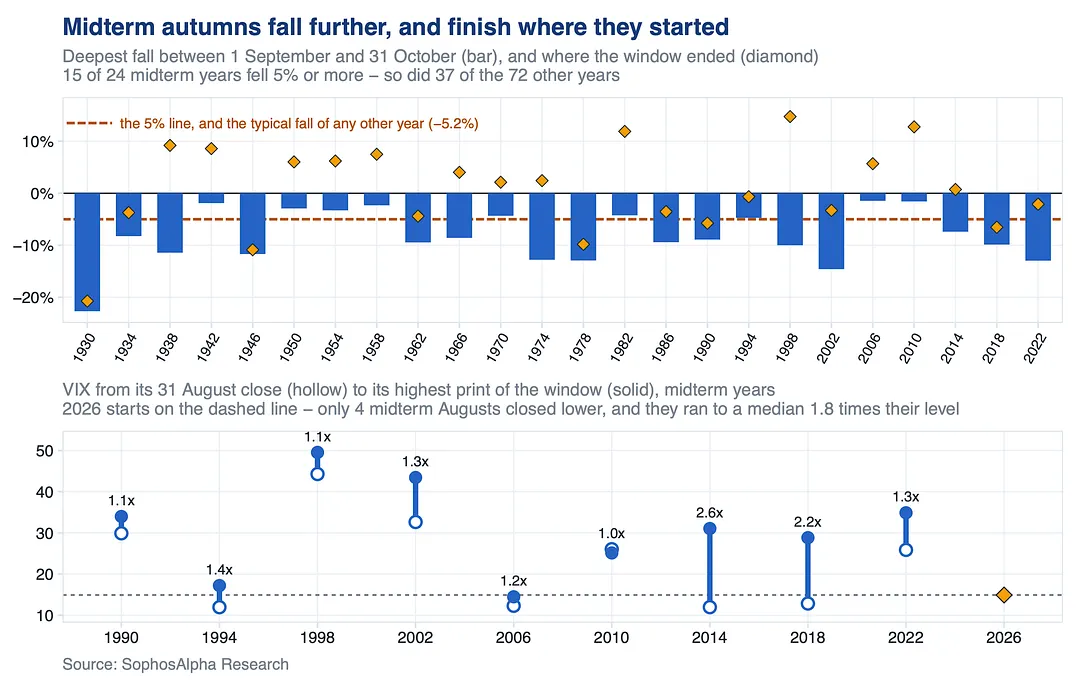
The S&P has dropped 5% or more in September to October in 15 of the 24 midterm years since 1930.

It also happened in 37 of the other 72. The difference is depth, 9% vs 5%, then flat by 31 October.

VIX went in at 14.9. Only four midterm Augusts closed lower, and those ran to a median 1.8x.

The S&P has dropped 5% or more in September to October in 15 of the 24 midterm years since 1930.

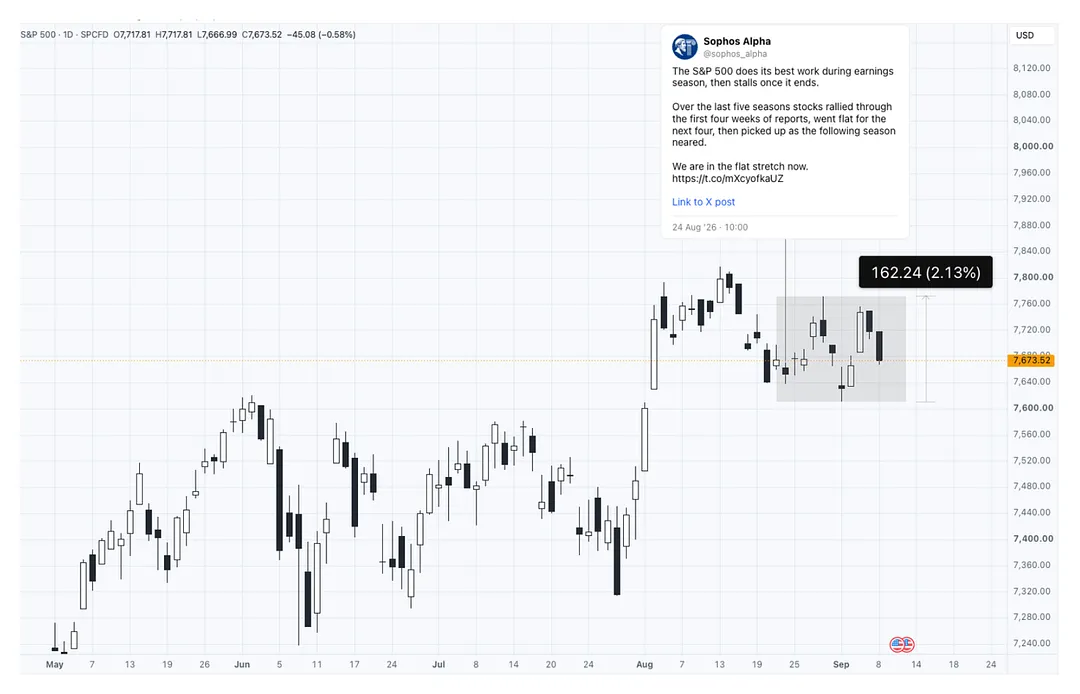
As we wrote two weeks ago, equities have shown a clear pattern of being range-bound in between earnings seasons over the last few quarters.

In keeping with the pattern, the S&P 500 over the last month has chopped in a tight range of just over 2% despite several high-profile catalysts (Jackson Hole, geopolitical escalation, trade escalation, CPI, payrolls).

https://substack.com/@sophosalpha/note/c-321506892

As we wrote two weeks ago, equities have shown a clear pattern of being range-bound in between earnings seasons over the last few quarters.

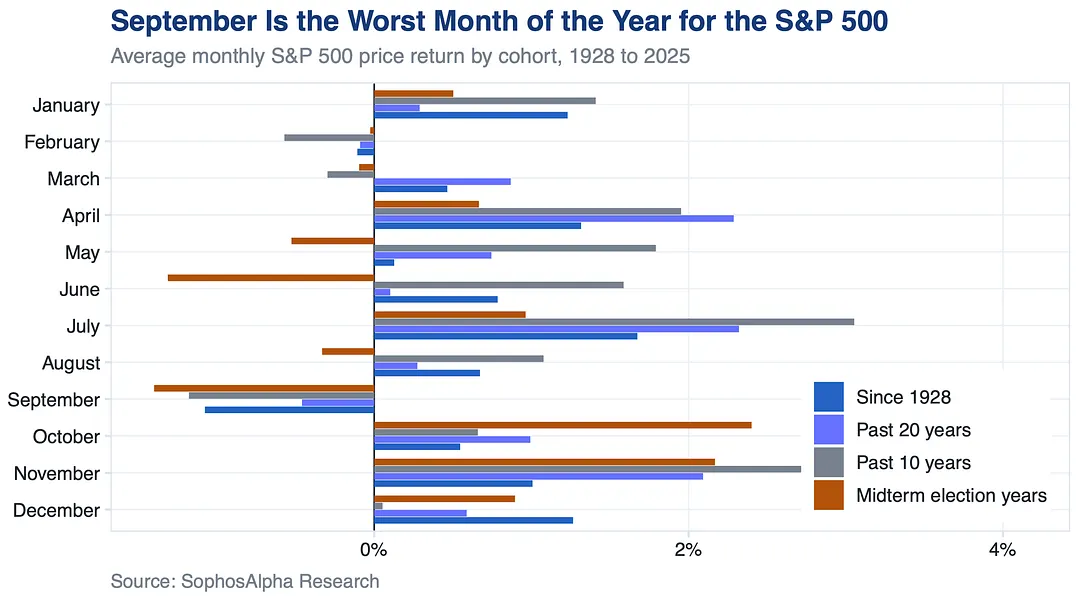
Throughout history and in recent years, the S&P 500 has consistently seen its worst month of the year in September.

Midterm years are tougher, but note that just before and after midterms the market fully recovers. Is that enough to justify lightening up?

Throughout history and in recent years, the S&P 500 has consistently seen its worst month of the year in September.

Midterm years often see a weaker start to H2 for the S&P 500 and a fall into October as summer fades.

After midterms the market tends to be strong regardless. 2026 initially followed the script but markets have been climbing since early August.

Midterm years often see a weaker start to H2 for the S&P 500 and a fall into October as summer fades.

11 notes

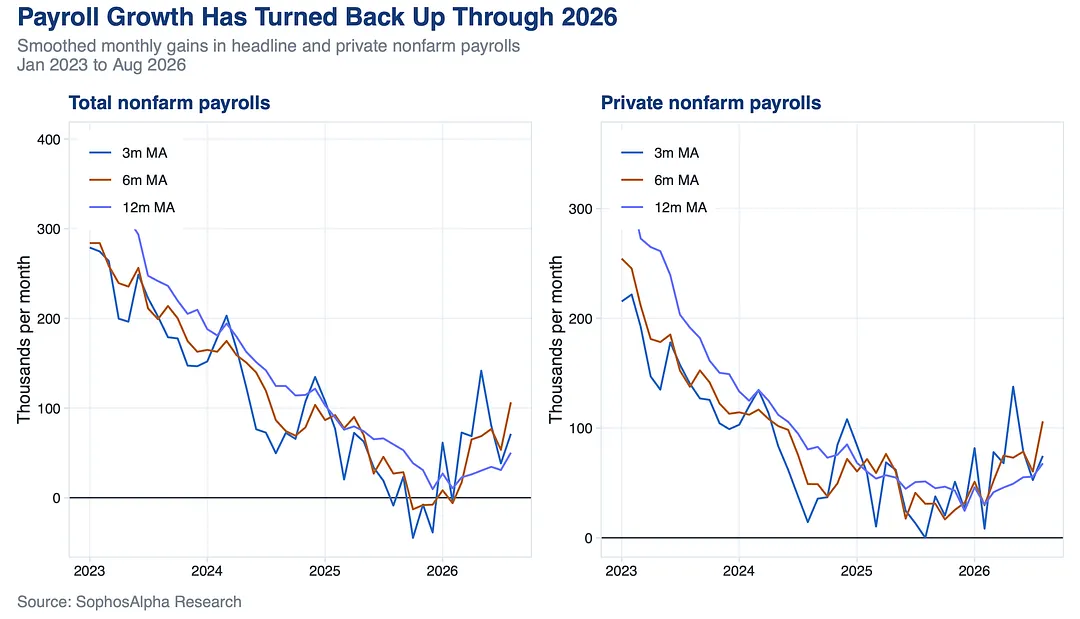
Payrolls did slow in 2025, which encouraged the insurance cuts, but although volatile there are clear signs that they have trended up in 2026.

Payrolls did slow in 2025, which encouraged the insurance cuts, but although volatile there are clear signs that they have trended up in 2026.

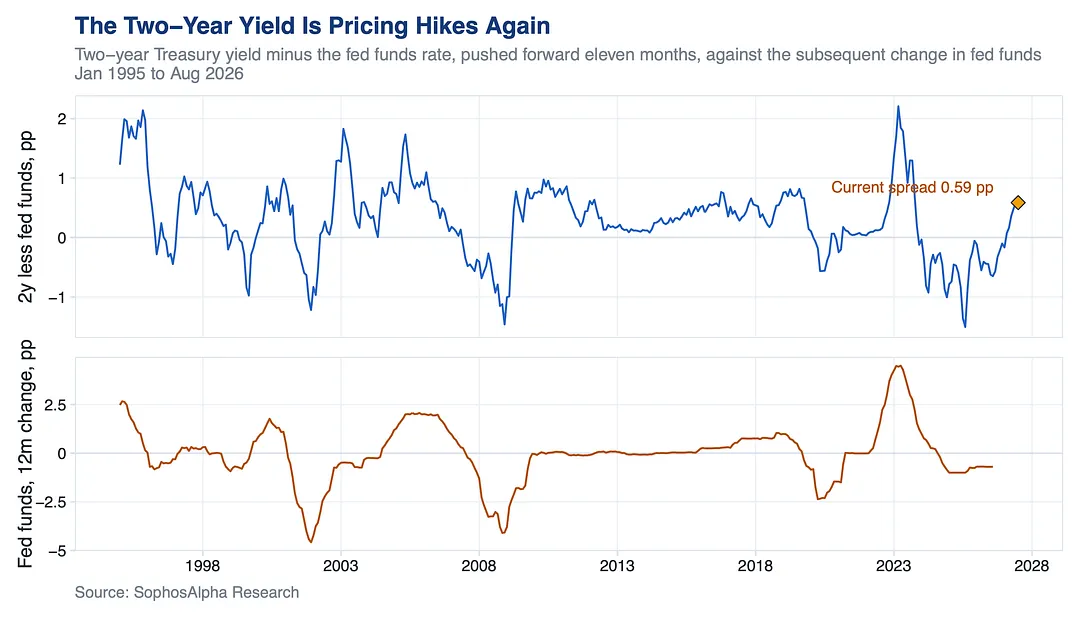
The wide gap between 2y yields and the fed funds rate also predicts rate hikes.

The wide gap between 2y yields and the fed funds rate also predicts rate hikes.

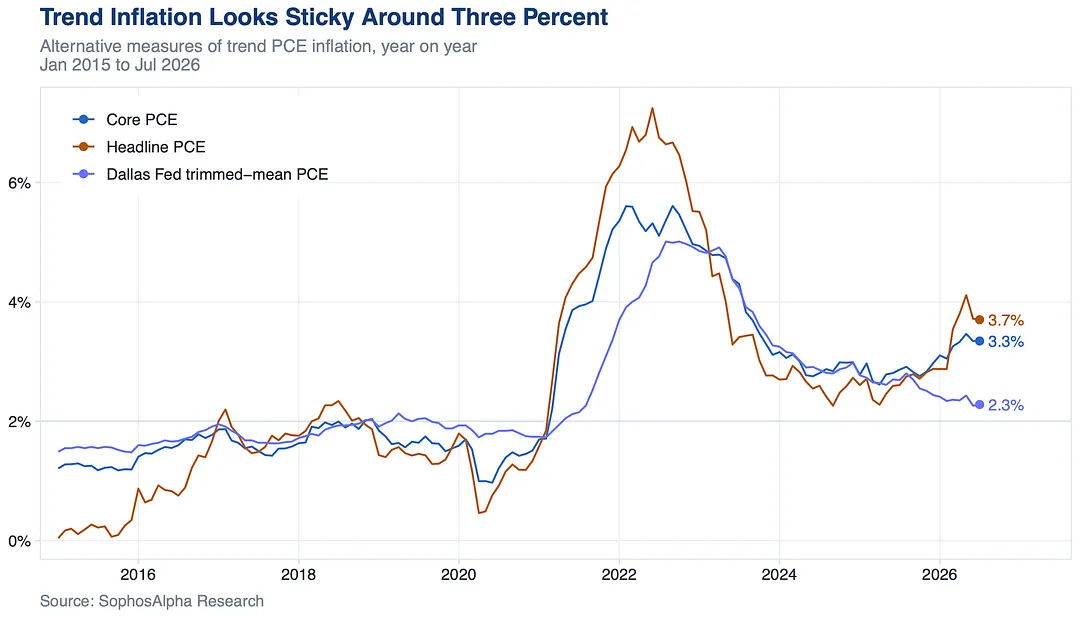
On most measures, trend inflation seems to be sticky at around 3%.

On most measures, trend inflation seems to be sticky at around 3%.

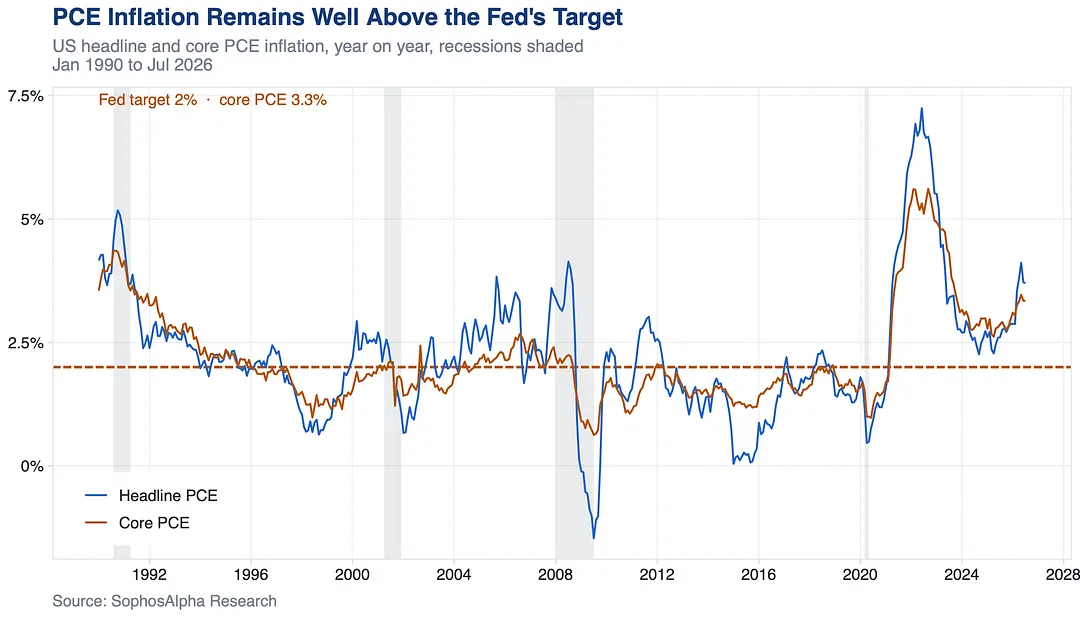
PCE inflation remains elevated far above the Fed's 2% target.

Excluding the pandemic anomaly, core PCE is only 12bps off its 34 year high seen in May.

PCE inflation remains elevated far above the Fed's 2% target.

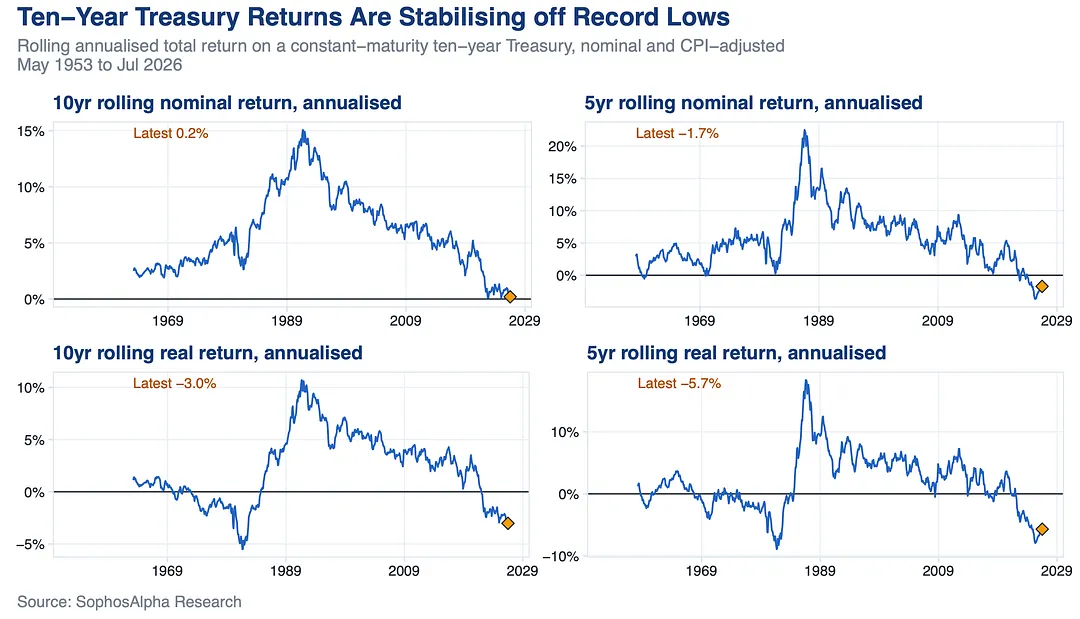
For 10yr Treasury yields, we are still hovering around the worst 5 and 10 year rolling nominal returns on record, but it is clear that even with yields again approaching multi year highs, returns have been stabilising more recently due to the higher coupons.

For 10yr Treasury yields, we are still hovering around the worst 5 and 10 year rolling nominal returns on record, but it is clear that even with yields again approaching multi year highs, returns have been stabilising more recently due to the higher coupons.

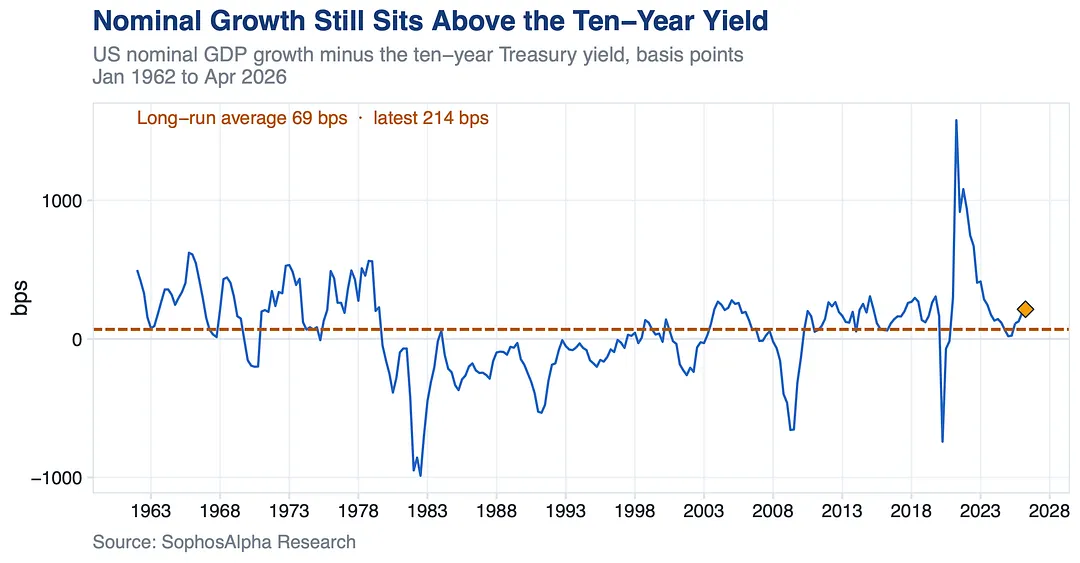
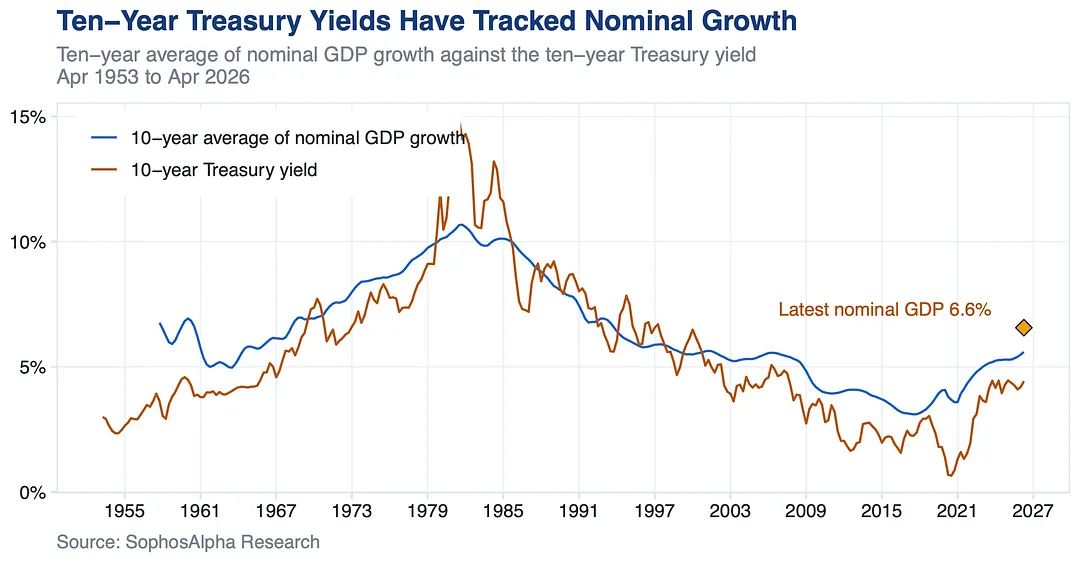
With spot nominal GDP at 6.6% YoY, the current gap to 10yr yields is around 180bps.

Nominal GDP may be inflated by energy prices but overall it is hard to say US yields are too high based on this.

If nominal GDP settles at 5.5% then 4.8% would be historically average.

With spot nominal GDP at 6.6% YoY, the current gap to 10yr yields is around 180bps.

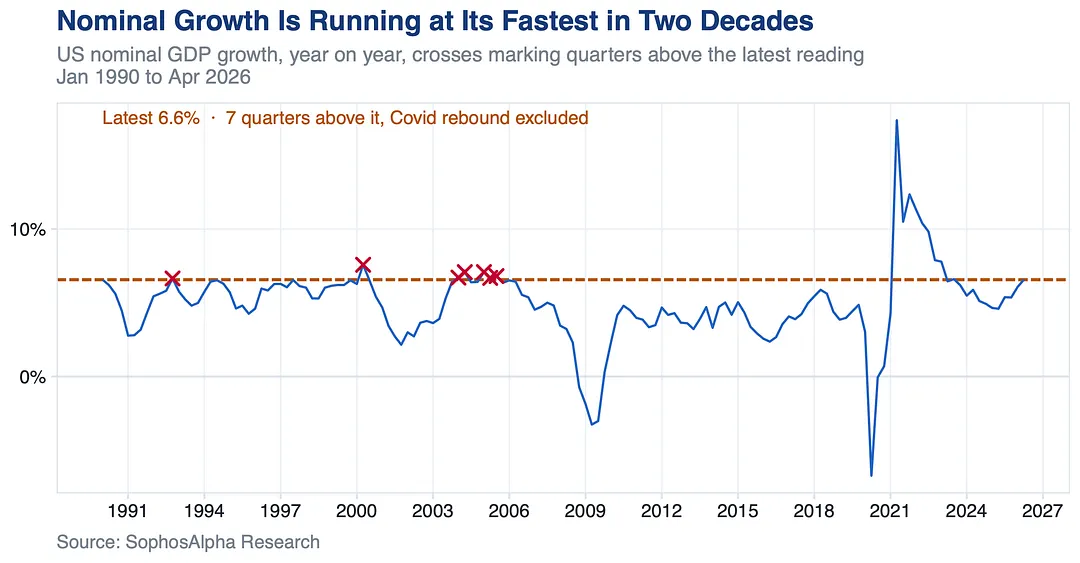
At 6.6%, current YoY US nominal GDP is at the highest YoY rate since 2005 outside of the Covid bounce back period.

So even if not sustainable at these levels, this level of nominal growth has helped push UST yields higher.

At 6.6%, current YoY US nominal GDP is at the highest YoY rate since 2005 outside of the Covid bounce back period.

Since the early 1960s, 10yr UST yields have typically tracked nominal GDP, apart from the late 70s/early 80s when they soared above and the 2010s when they were well below.

10yr average NGDP is c.5.5%, so 4.8% seems broadly fair. But current NGDP is 6.6%. Do we factor that in?

Since the early 1960s, 10yr UST yields have typically tracked nominal GDP, apart from the late 70s/early 80s when they soared above and the 2010s when they were well below.

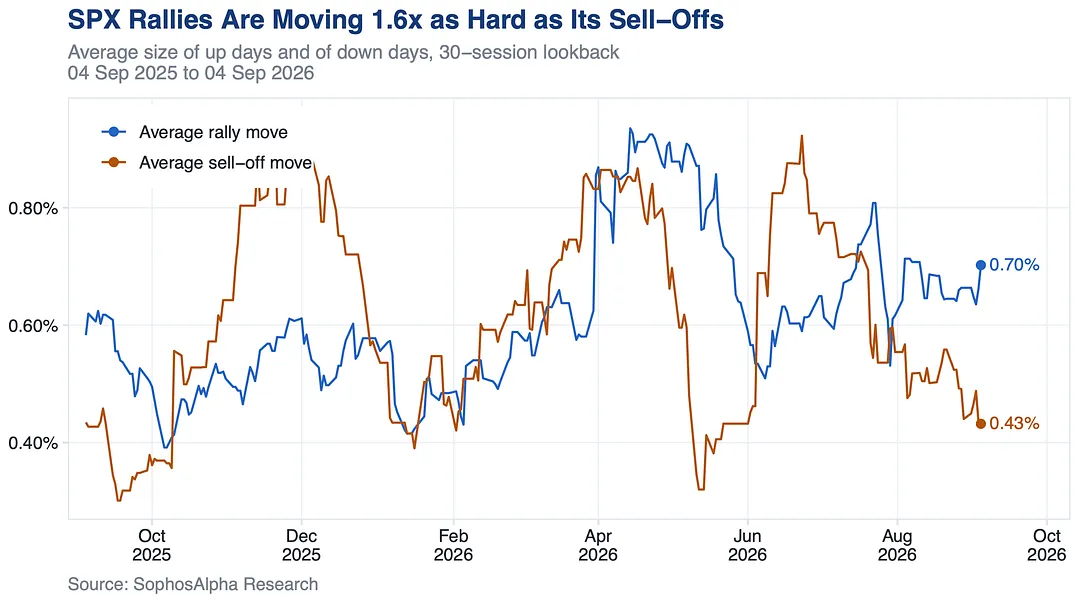
Over the last 30 sessions the average SPX up day moved 0.70%.

The average down day moved 0.43%.

Rallies are running about 1.6 times as violent as sell offs. That is not what a market full on exposure looks like, it is one chasing strength it does not own.

Over the last 30 sessions the average SPX up day moved 0.70%.

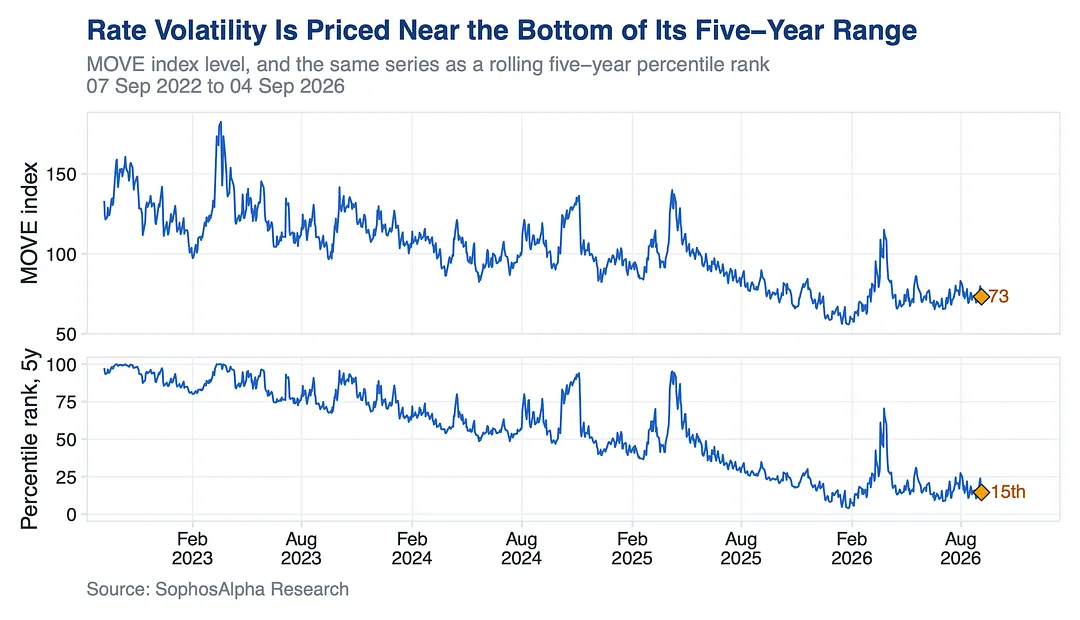
Rate volatility is priced for nothing to happen.

The MOVE index closed Friday at 73, cheaper than roughly 85% of the last five years.

Odd place to sit with the long end back at multi decade average yields and a CPI print landing Friday.

Rate volatility is priced for nothing to happen.

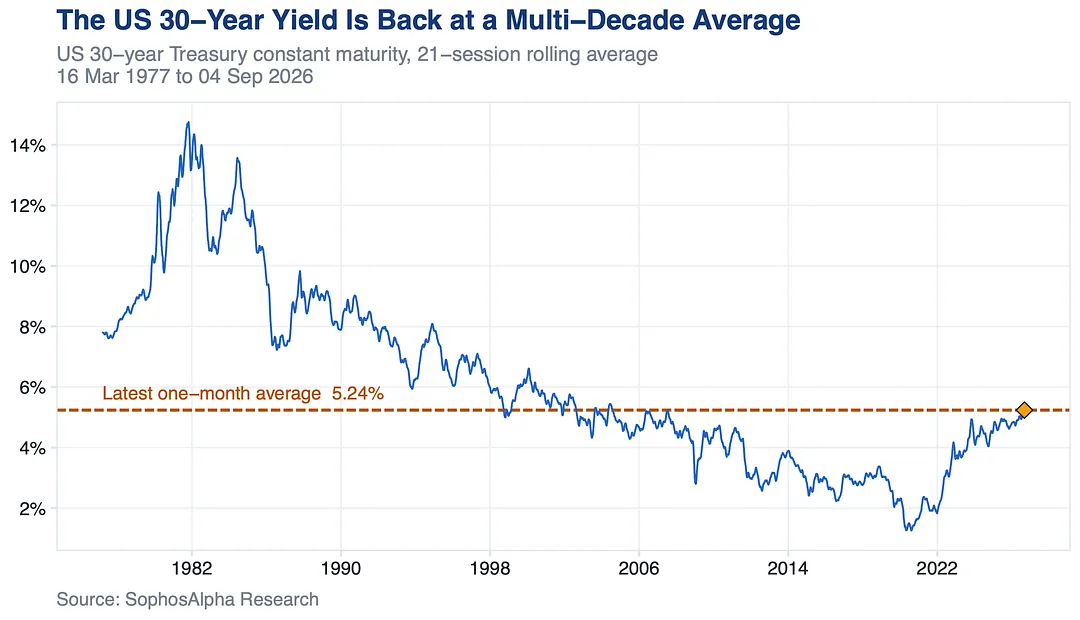
The 30 year Treasury yield has now averaged above 5.2% for a month, only the third time that has happened since 2004.

Sticky inflation, heavy supply and rebuilding term premium can carry it higher with no Fed hike at all. That is the real risk to long duration assets.

The 30 year Treasury yield has now averaged above 5.2% for a month, only the third time that has happened since 2004.

3 notes

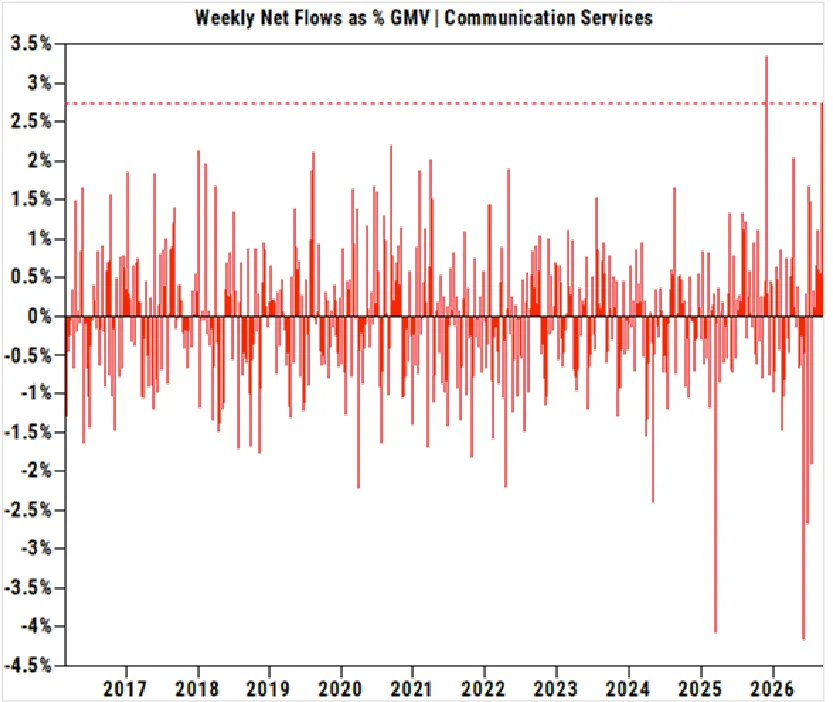
Hedge funds just bought Communication Services at the 2nd fastest weekly pace on record since 2016.

It came from both sides of the book, new longs plus short covering, so this isn't just a squeeze. The only bigger week on record came less than a year ago.

Hedge funds just bought Communication Services at the 2nd fastest weekly pace on record since 2016.

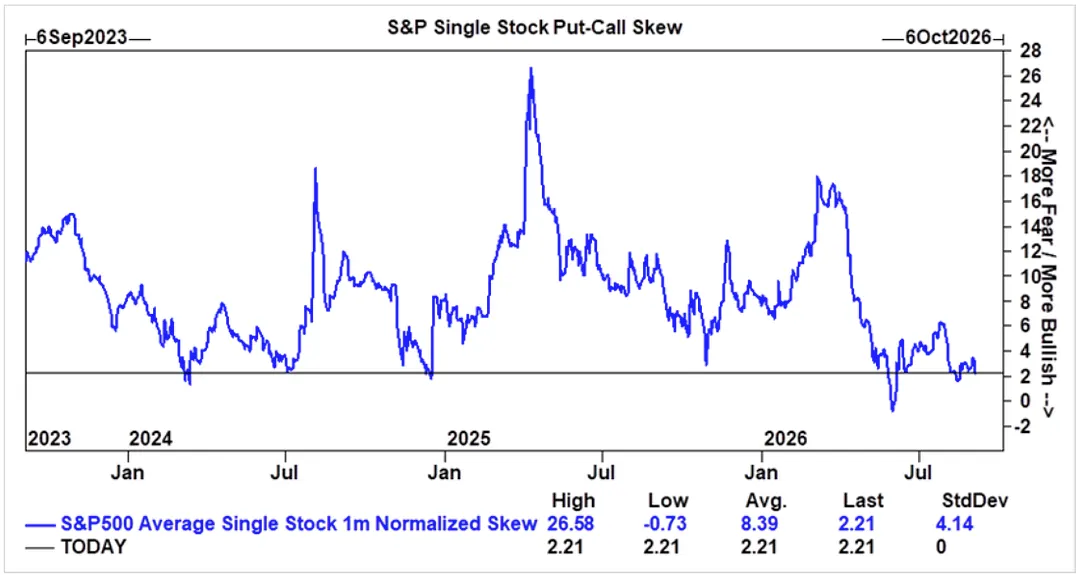
Put-call skew on the average S&P stock is still very flat, near the lows of the last three years.

(Y=axis what it means).

Put-call skew on the average S&P stock is still very flat, near the lows of the last three years.

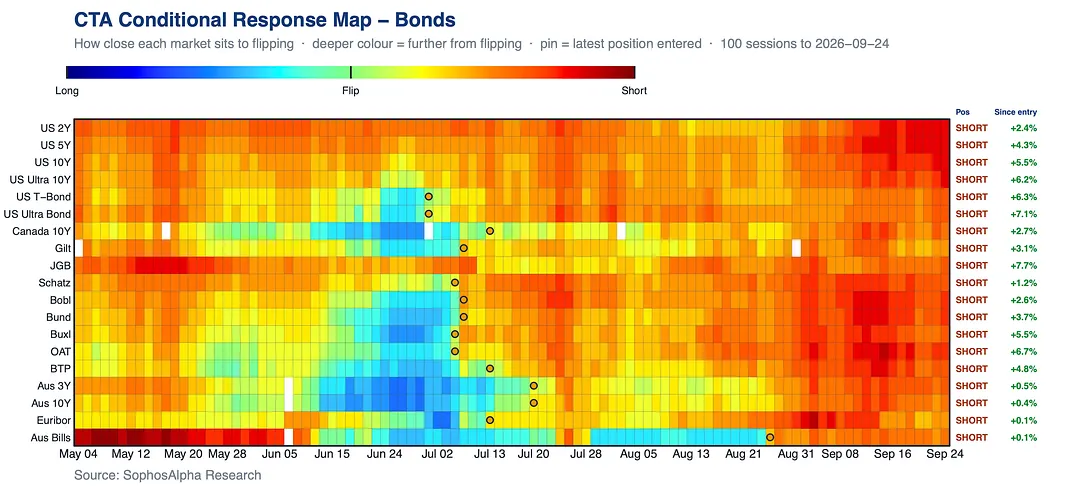
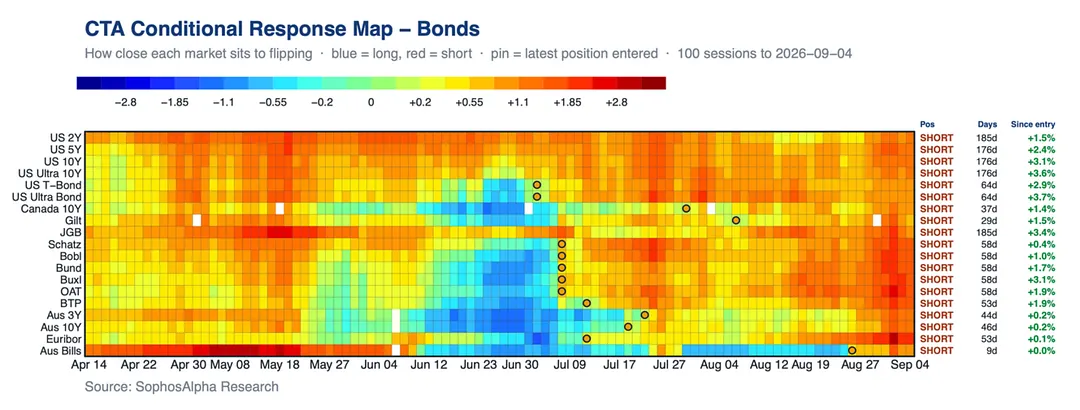
Trend followers have been short the entire global bond complex for months.

Our US 2Y and JGB shorts are 185 days old, the US belly 176, and all 19 markets are green since entry. This decline hasn't been a surprise to systematic money, it's been the trade.

Trend followers have been short the entire global bond complex for months.

one note

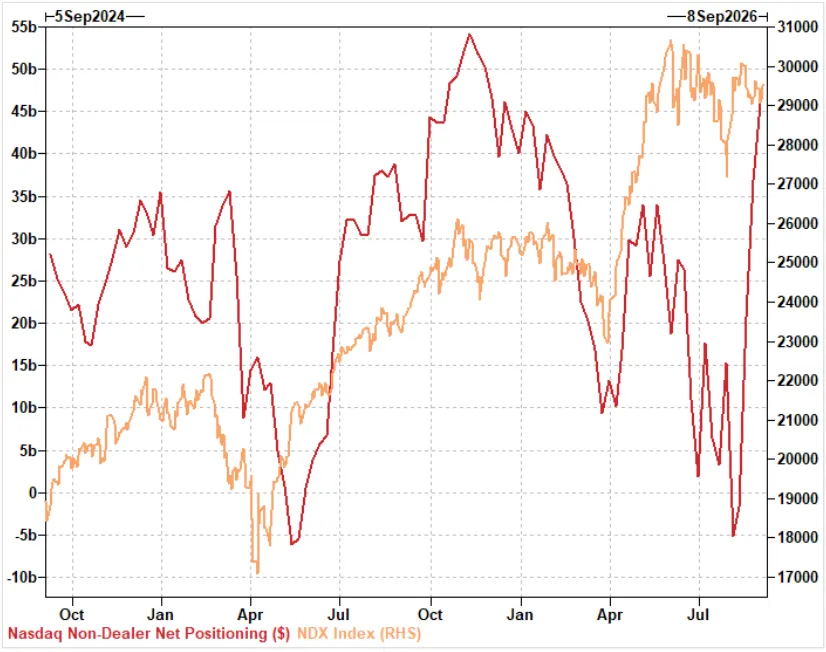
After dipping into negative territory, Nasdaq Non-Dealer net positioning forcefully rebounded during August.

Option market and general hedge unwinds fueled a large portion of the bounce.

Full update on institutional activity will be published on Sunday. Get the latest release in-time by subscribing for FREE: https://sophosalpha.substack.com/subscribe

After dipping into negative territory, Nasdaq Non-Dealer net positioning forcefully rebounded during August.

3 notes

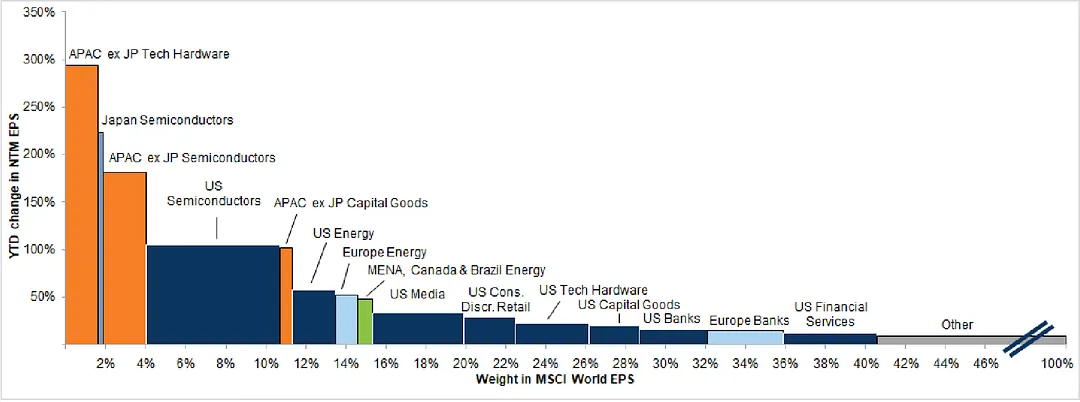
Cyclical parts of the Tech sector have been the main driver behind positive earnings revisions YTD

Cyclical parts of the Tech sector have been the main driver behind positive earnings revisions YTD

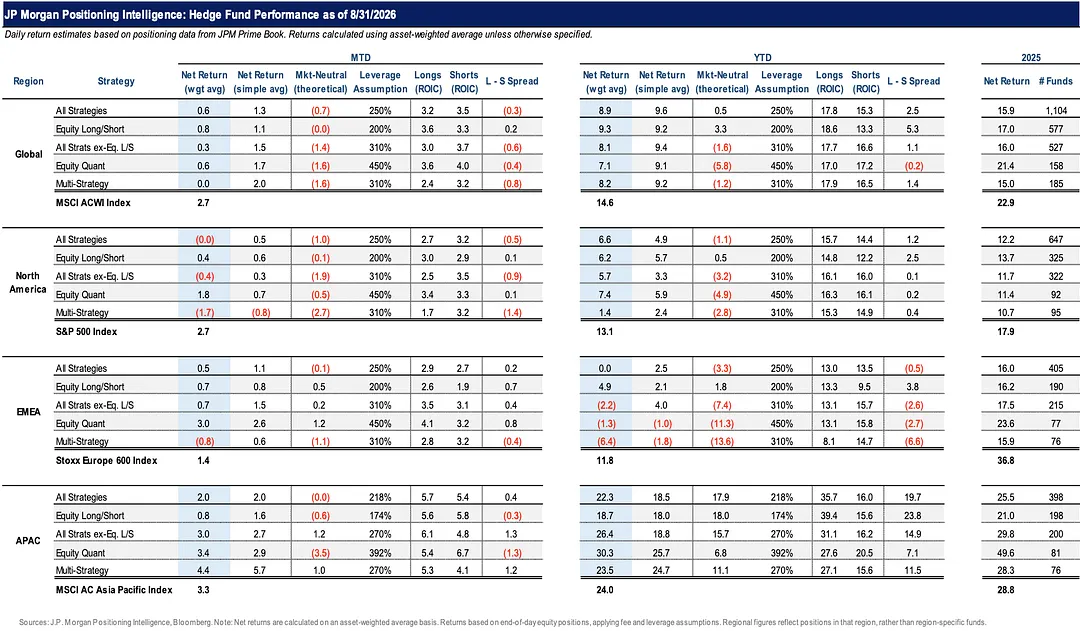
First look at hedge fund performance in August by JPM.

Global funds returned +0.6% while global equities gained +2.7%.

What they made came from beta, not selection. Long-short spreads were negative globally at -0.3%, with North America weakest at -0.5%. Equity L/S was the one bright spot at +0.8%. YTD the gap is wider still, +8.9% vs +14.6%.

Beta is carrying the industry, not the stock picking.

First look at hedge fund performance in August by JPM.

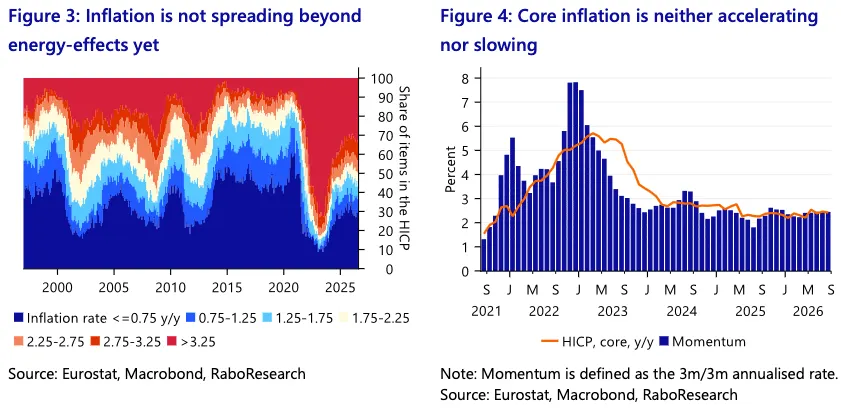
Euro area inflation is about to reaccelerate, but it's an energy story, not an inflation story.

Core is going sideways, the share of items running hot isn't widening, and expectations stay anchored. The ECB's risk isn't the rebound itself, it's how long the energy shock lasts.

Euro area inflation is about to reaccelerate, but it's an energy story, not an inflation story.

6 notes

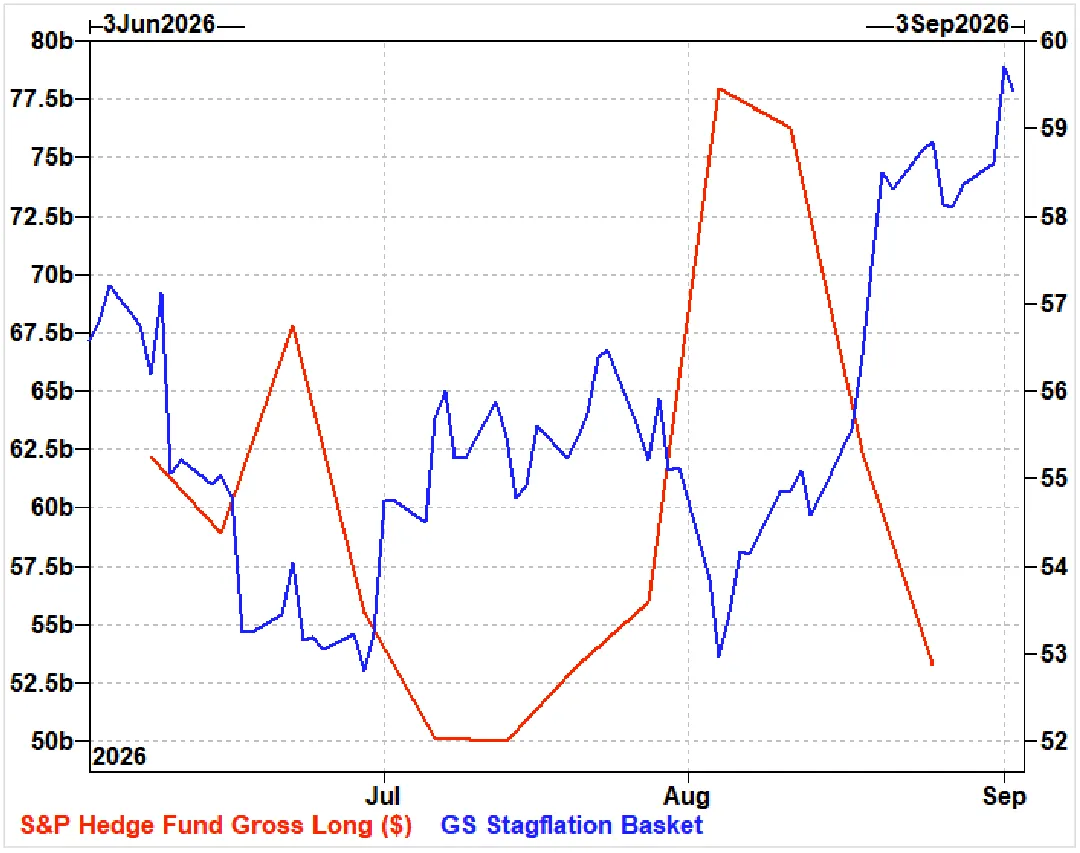
Futures traders aren't selling because the tape looks weak.

They're selling because the macro mix is starting to smell like stagflation.

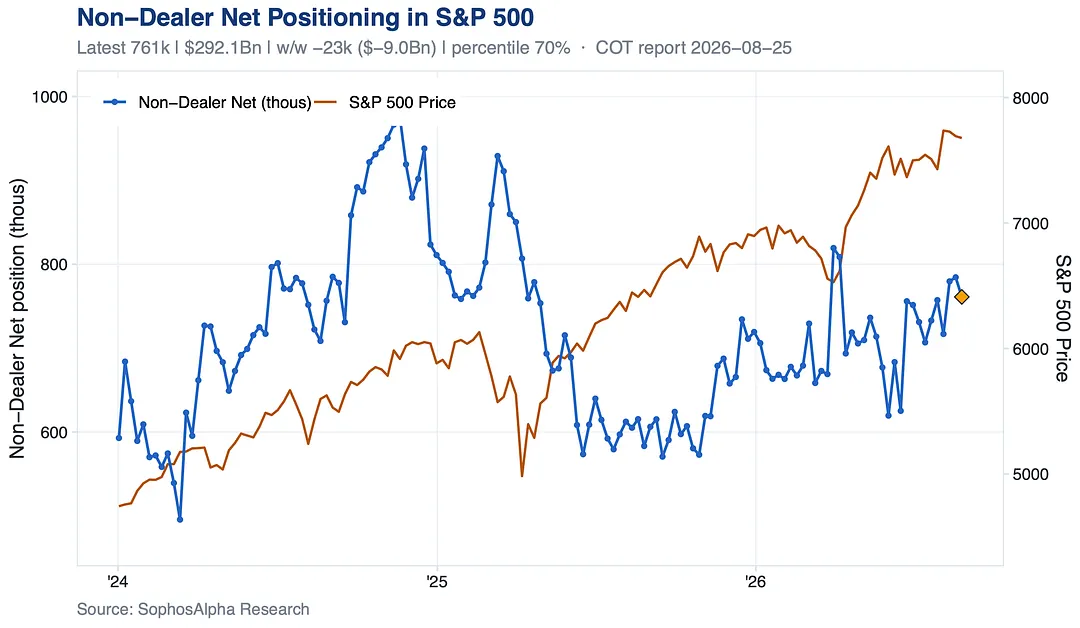
Non-dealers flipped back to net selling in S&P futures in the latest COT, ending a two-week buying streak. New shorts and long liquidation contributed about equally.

Hedge funds have now cut gross longs three weeks running, and each leg lower lines up with the stagflation basket ripping higher.

Price is holding. Positioning is repricing growth vs inflation.

Futures traders aren't selling because the tape looks weak.Futures traders aren't selling because the tape looks weak.

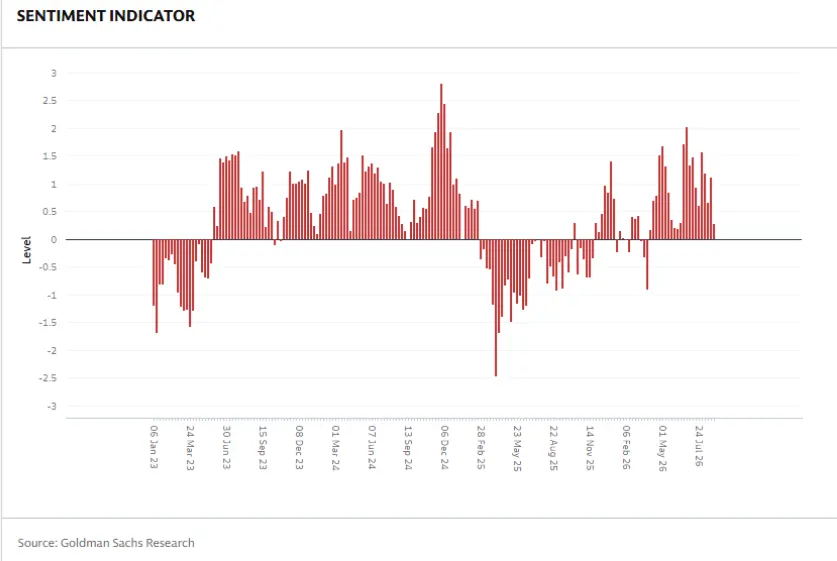
Nobody is chasing this rally.

The GS sentiment indicator has drifted back to neutral after peaking in the spring, even with the index holding near its highs. Fundamental investors are hesitant here. That is not what a fragile tape looks like, it is what a cushion looks like.

Nobody is chasing this rally.

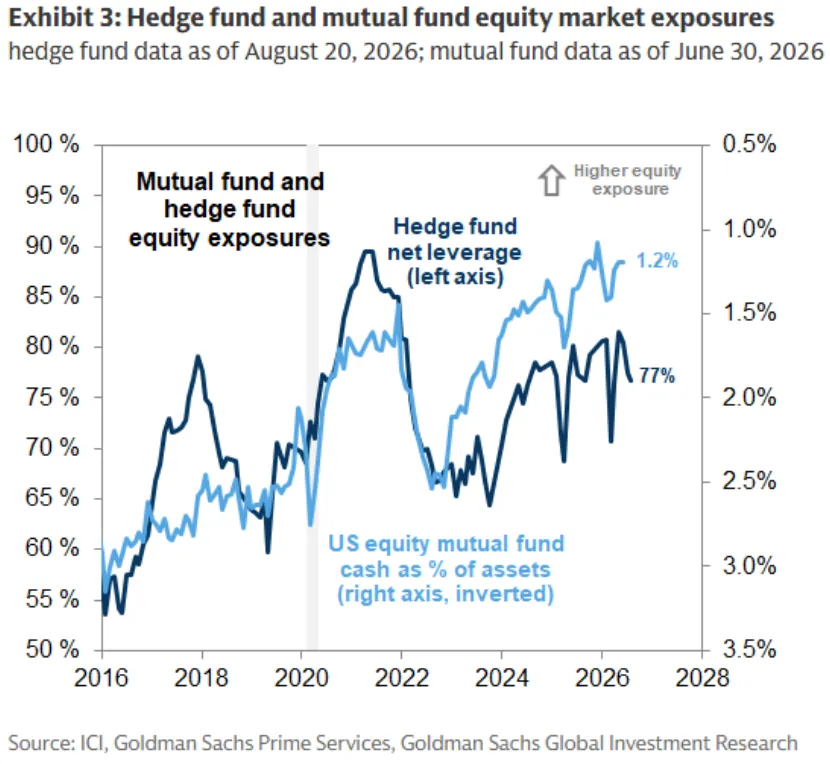
Mutual funds have almost no cash left to deploy.

Hedge funds have barely committed.

Long-only money is close to fully invested, while hedge fund net exposure sits near the low end of the past year. One crowd has nothing left to buy. The other has all the room.

Mutual funds have almost no cash left to deploy.

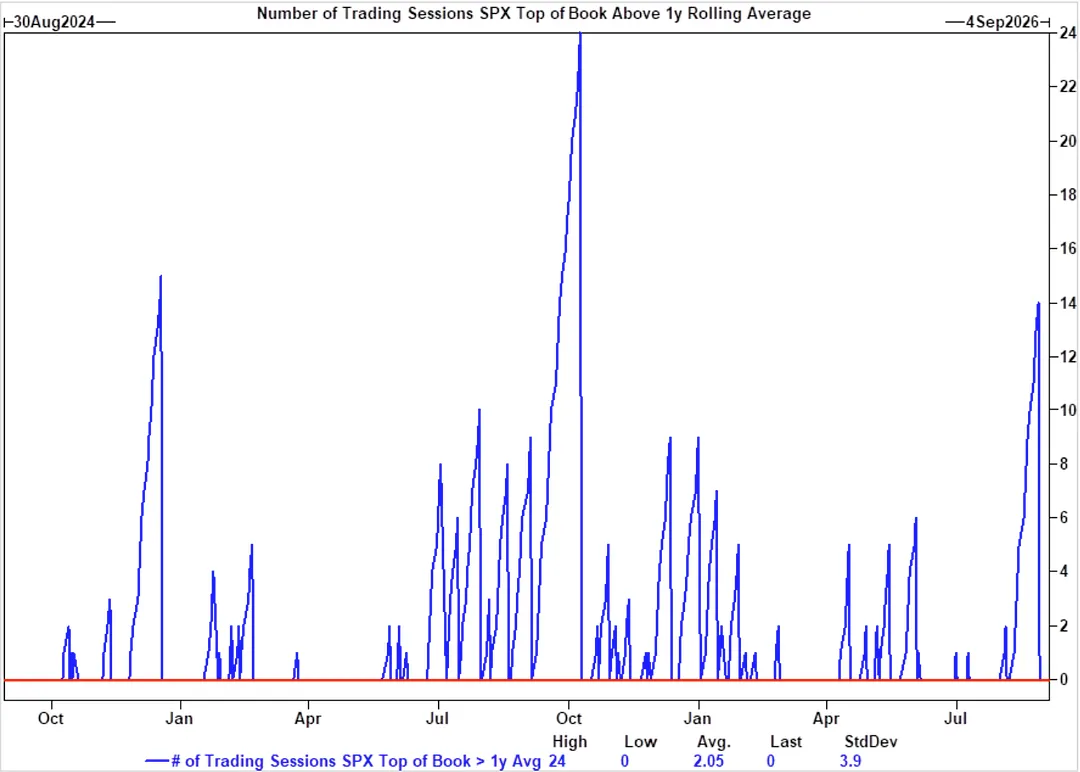
The dog days arrived, but the order book did not thin with them.

S&P top of book has held up through the late summer stretch, and last Friday was the first session in almost three weeks that depth fell below its 1y rolling average. At $11.12mm as of last week's close, the ability to transfer risk remains robust, though we expect a moderate weakening into the official end of summer.

The dog days arrived, but the order book did not thin with them.

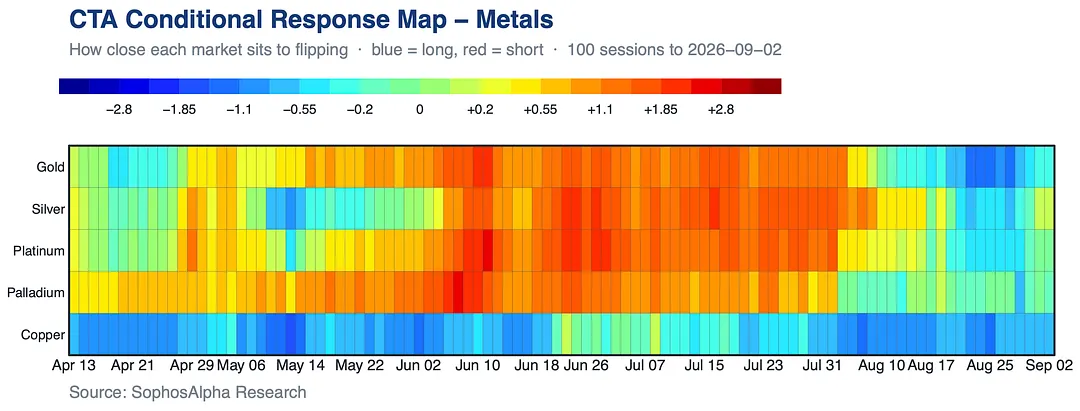
Gold has been paying trend followers.

Our systematic trend following portfolio has been adding to gold longs since start of August, when momentum-driven conditions turned meaningfully better. Platinum moved the same way and copper stayed long throughout. Silver and palladium sit closest to the flip.

Gold has been paying trend followers.

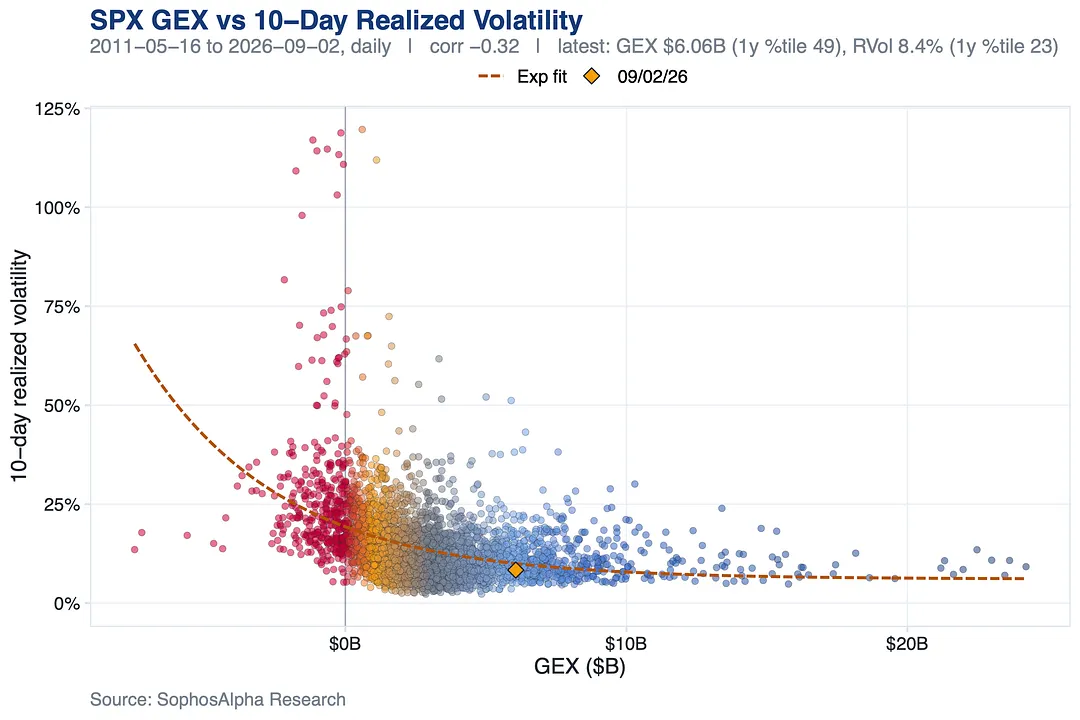
Despite the pullback on equities, dealer gamma remains positive, a regime that historically damps realized vol and gives the index a mechanical bid on dips.

Gamma is mid-range versus the past year though, so treat it as a cushion, not a floor.

Despite the pullback on equities, dealer gamma remains positive, a regime that historically damps realized vol and gives the index a mechanical bid on dips.

11 notes

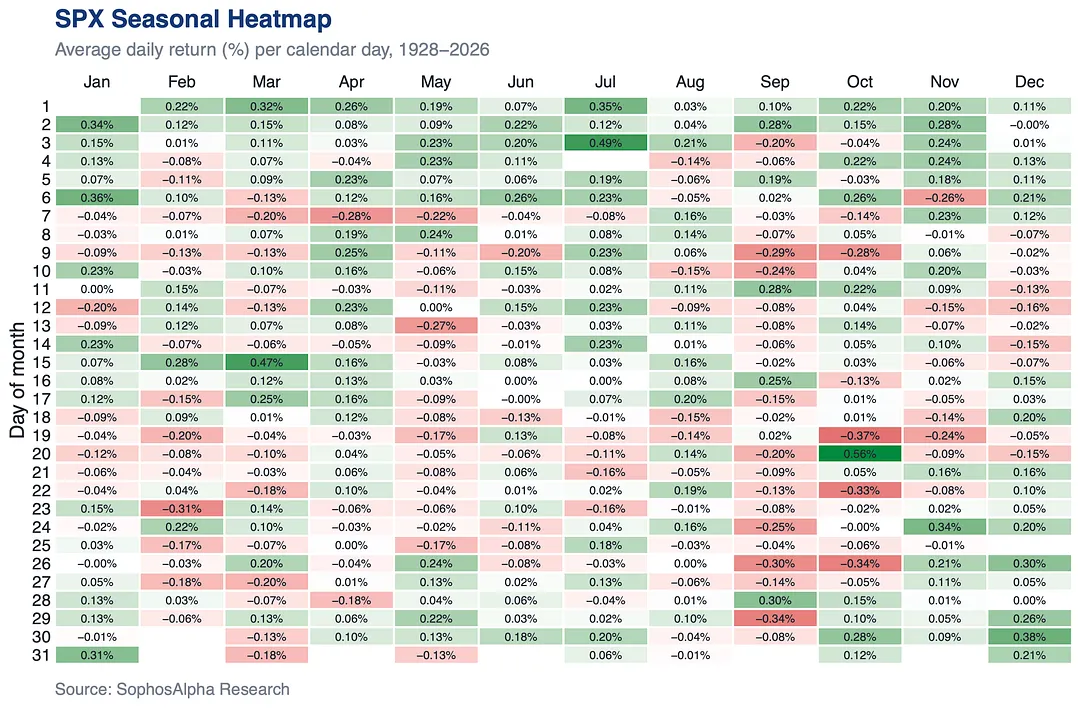
SPX Seasonals Heatmap

Average daily return for every calendar day of the year, 1928 to 2026.

We post dozens of charts like this in our daily notes, subscribe for FREE.👉 https://sophosalpha.substack.com/subscribe

SPX Seasonals Heatmap

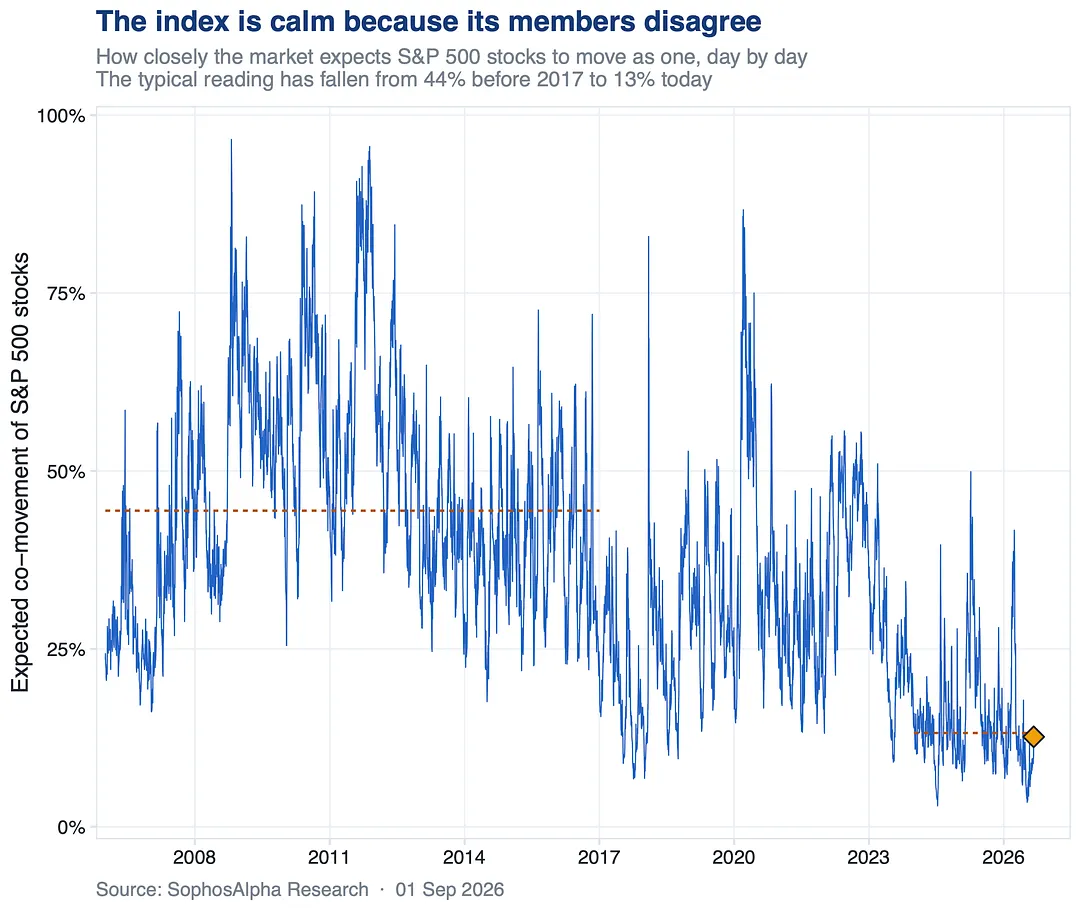
The S&P 500 looks calm because its members disagree, not because nothing is happening.

How closely index stocks are expected to move together has fallen from a typical 44% before 2017 to 13% today. The index cancels itself out, until it stops.

The S&P 500 looks calm because its members disagree, not because nothing is happening.

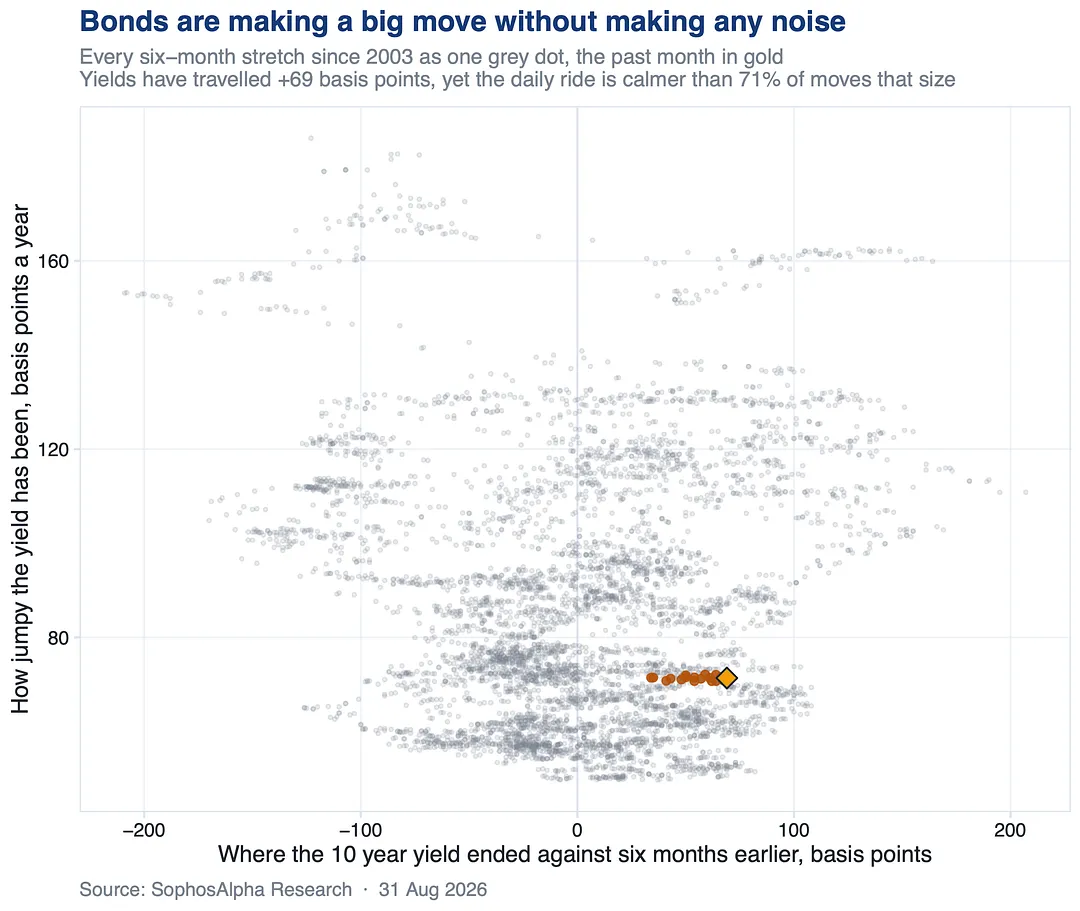
The 10 year yield has climbed 69 basis points in six months and almost nobody noticed.

Day to day it has been calmer than 71% of moves that size since 2003. Big moves usually come with a rough ride. This one arrived as a slow grind.

The 10 year yield has climbed 69 basis points in six months and almost nobody noticed.

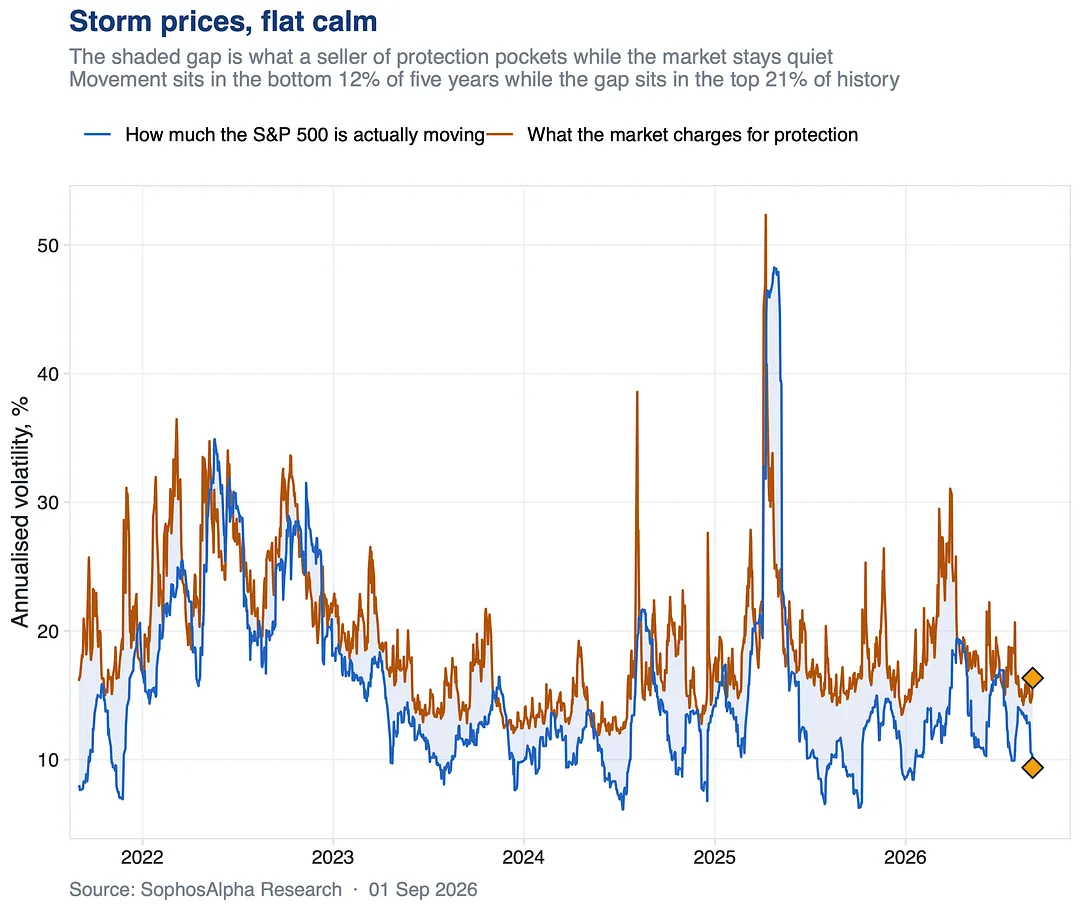
You are paying storm prices for a flat calm.

The S&P 500's day to day swings are in the calmest 12% of five years, yet protection is still priced at 16. That gap sits in the top fifth of history, and all of it goes to whoever sold you the hedge.

You are paying storm prices for a flat calm.

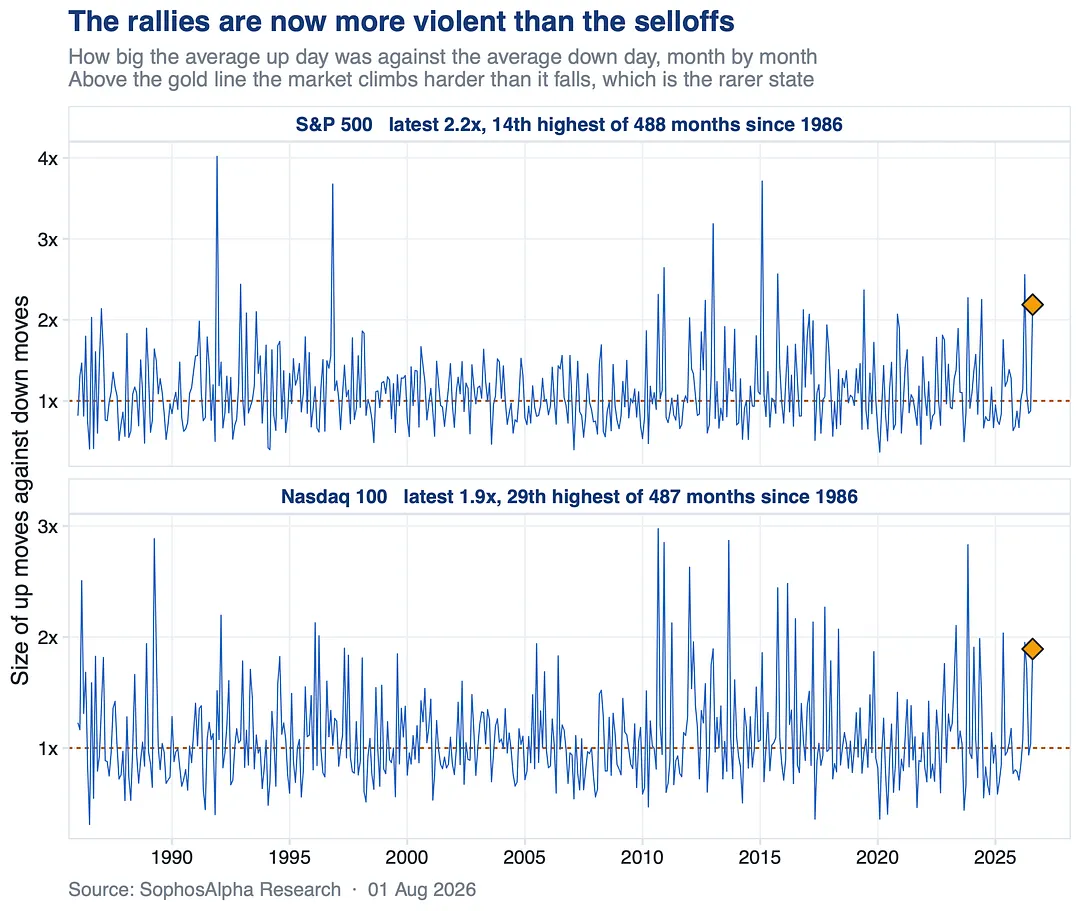
August was twice as violent going up as going down.

The S&P 500 moved 2.2x harder on its up days than its down days, the 14th highest reading in 488 months since 1986. The volatility now lives in the melt ups, not the selloffs.

August was twice as violent going up as going down.

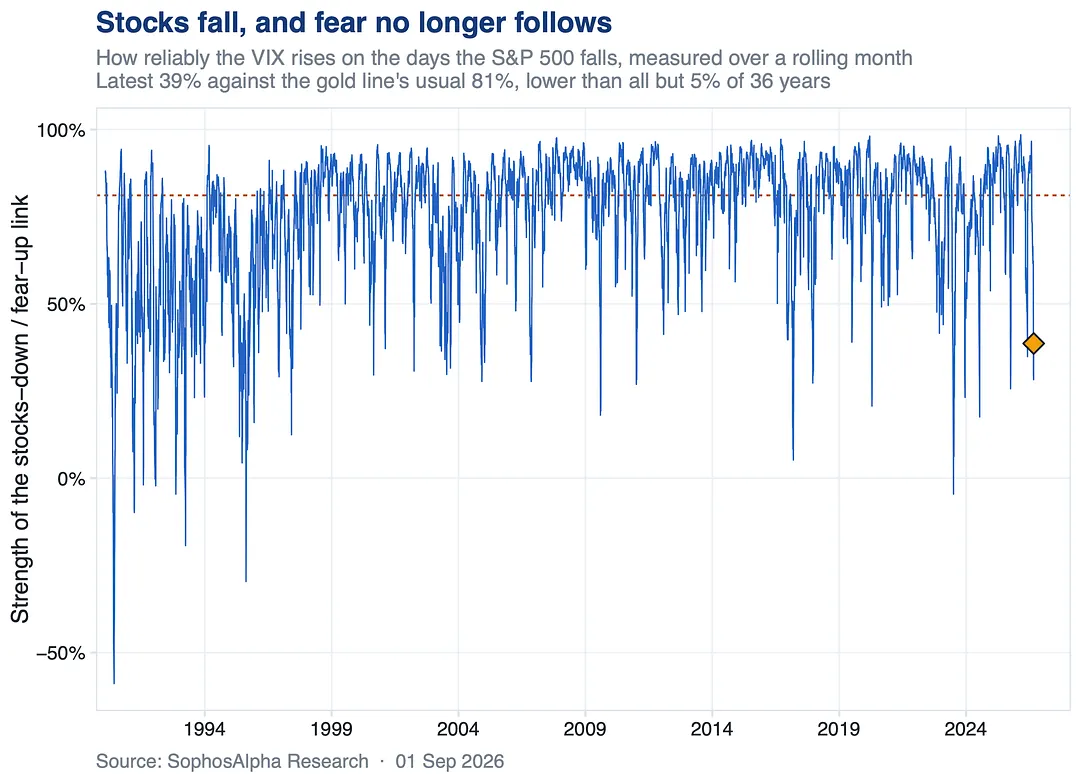
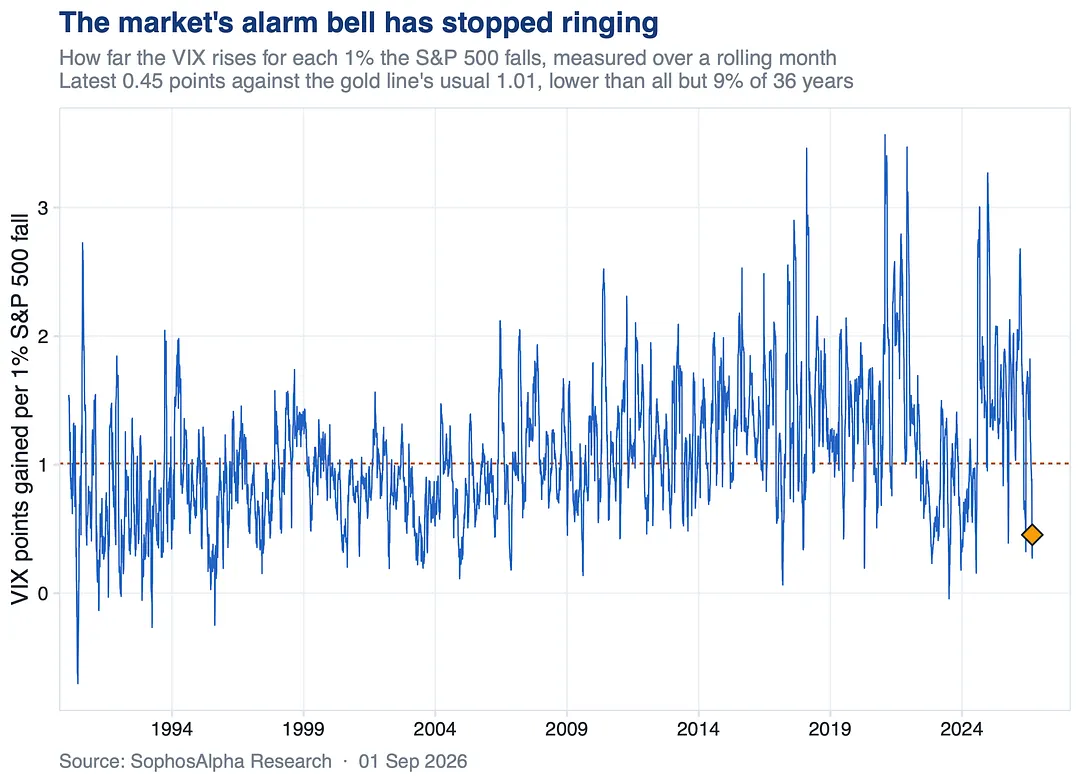
Stocks fall and fear no longer follows.

The link between S&P 500 down days and a rising VIX normally runs near 81%. Over the past month it collapsed to 39%, looser than all but 5% of the last 36 years. The alarm system went quiet. The risk did not leave.

Stocks fall and fear no longer follows.

The VIX has stopped doing its job.

For 36 years it rose about 1 point for every 1% the S&P 500 fell. Right now it manages 0.45. Only 9% of history has seen a weaker reaction. Protection looks cheap because it has quietly stopped protecting.

The VIX has stopped doing its job.

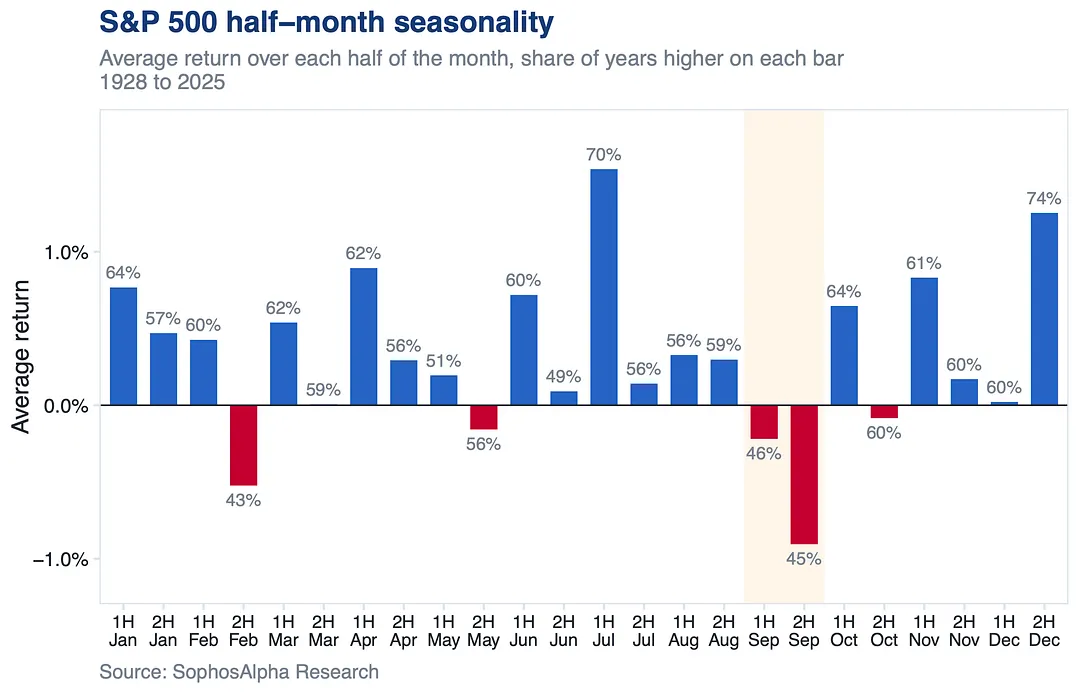
September is not weak all the way through.

Since 1928 the back half of the month has averaged 0.91% negative, the weakest two week stretch of the year, and has been higher in only 45% of years. The first half is barely negative. That window opens in two weeks.

September is not weak all the way through.

Earnings are largely behind us.

What follows is a very different catalyst calendar: NFP Sep 4, PPI Sep 10, CPI Sep 11, FOMC Sep 16.

Unlike earnings, that is a far more two sided set. After a season dominated by positive surprises, the right tail is less obvious.

Earnings are largely behind us.

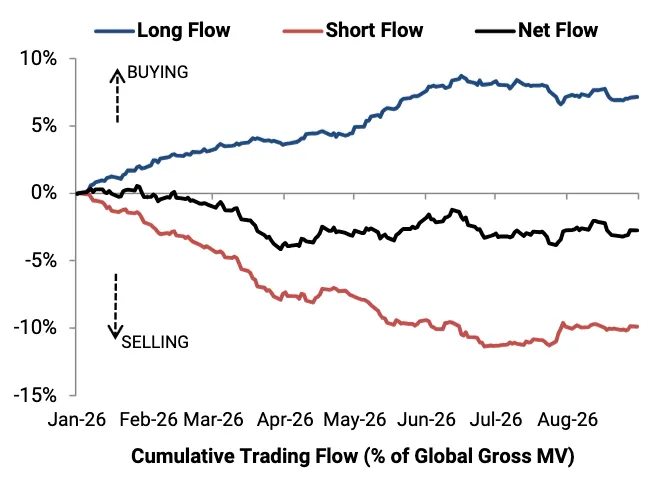
Hedge funds spent August cancelling themselves out.

Long buys were roughly offset by short sales, leaving the book marginally net bought with overall dollar flows muted.

Gross positioning on both sides is large, but cumulative net flow has barely moved since the spring.

Hedge funds spent August cancelling themselves out.

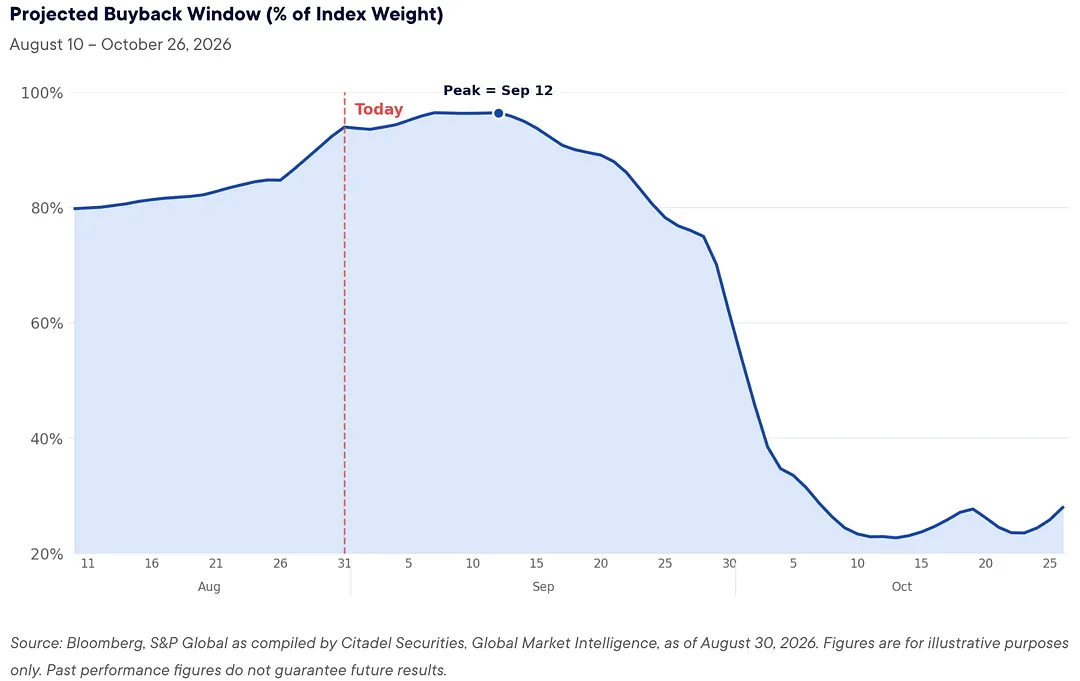
The Corporate Bid Begins to Slow

The buyback window is at its widest around September 12. From there an increasing share of companies enter pre earnings blackout ahead of Q3 reporting, and one of the market's largest and most consistent sources of structural demand gets progressively smaller as the month advances.

The Corporate Bid Begins to Slow

6 notes

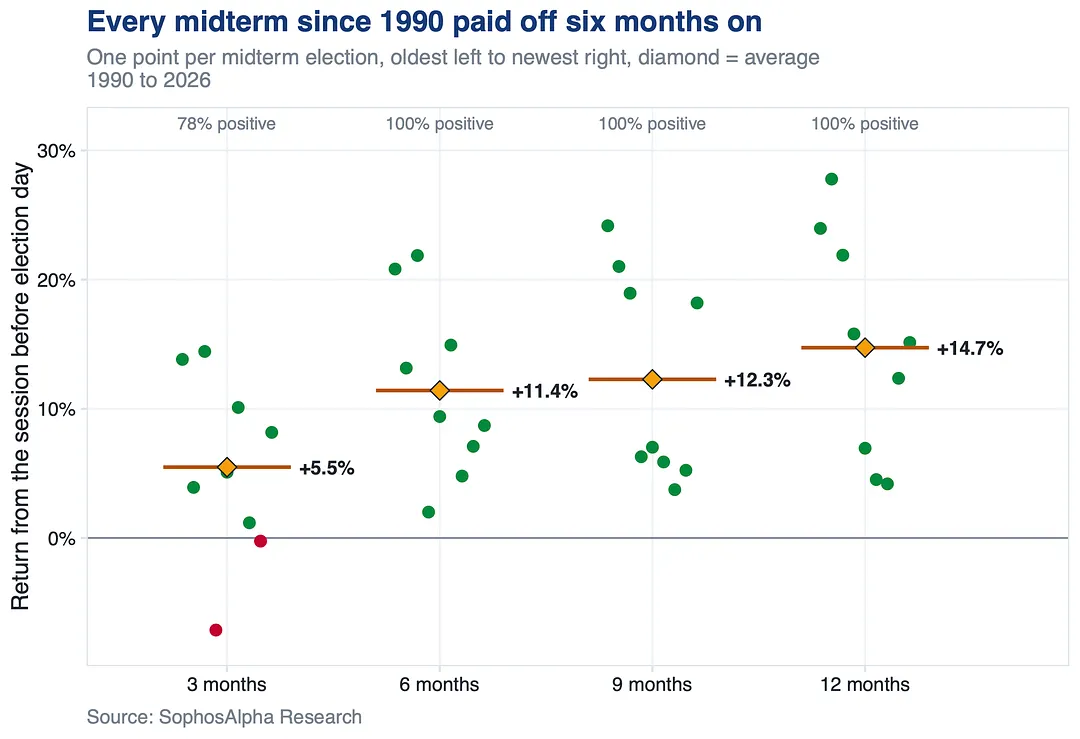
Nine midterm elections since 1990.

Buying the SPX on election day and holding: three months later you were up 7 times out of 9 (+5.5% average), six months 9 of 9 (+11.4%), nine months 9 of 9 (+12.3%), twelve months 9 of 9 (+14.7%).

Nine midterm elections since 1990.

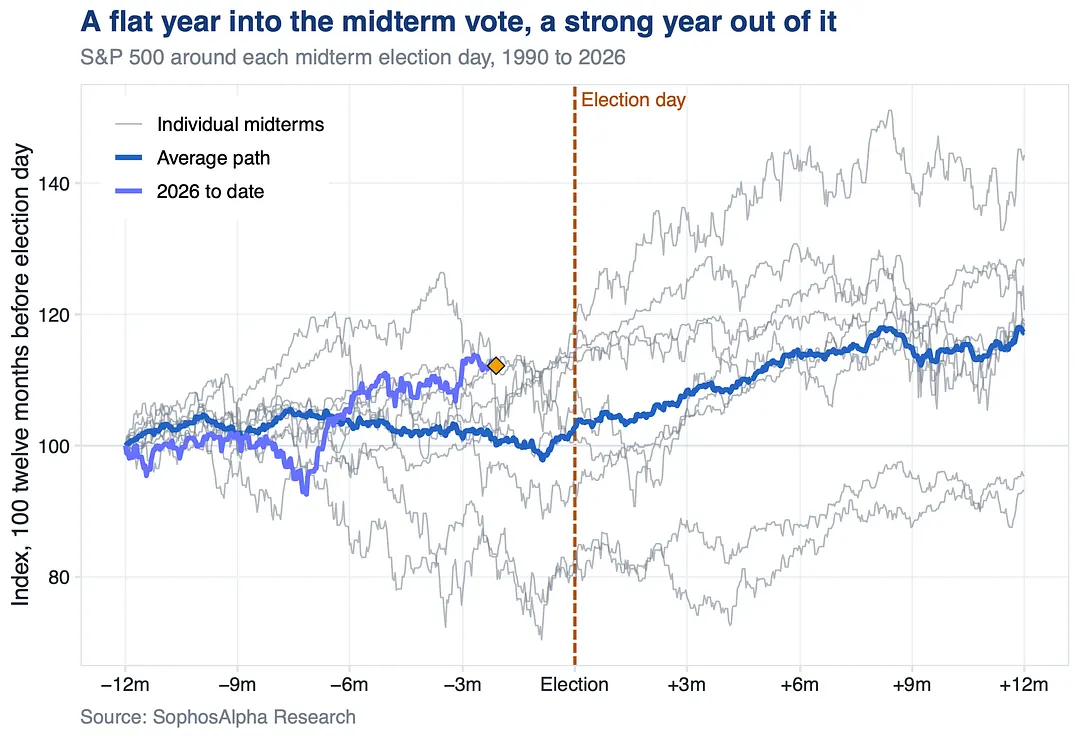
The SPX around every midterm election day since 1990.

The average path is flat for the twelve months into the vote, up just 2.8%, then gains 14.1% in the twelve months after it. 2026 is running well ahead of that, up 12.2% at the same point in the cycle.

The SPX around every midterm election day since 1990.

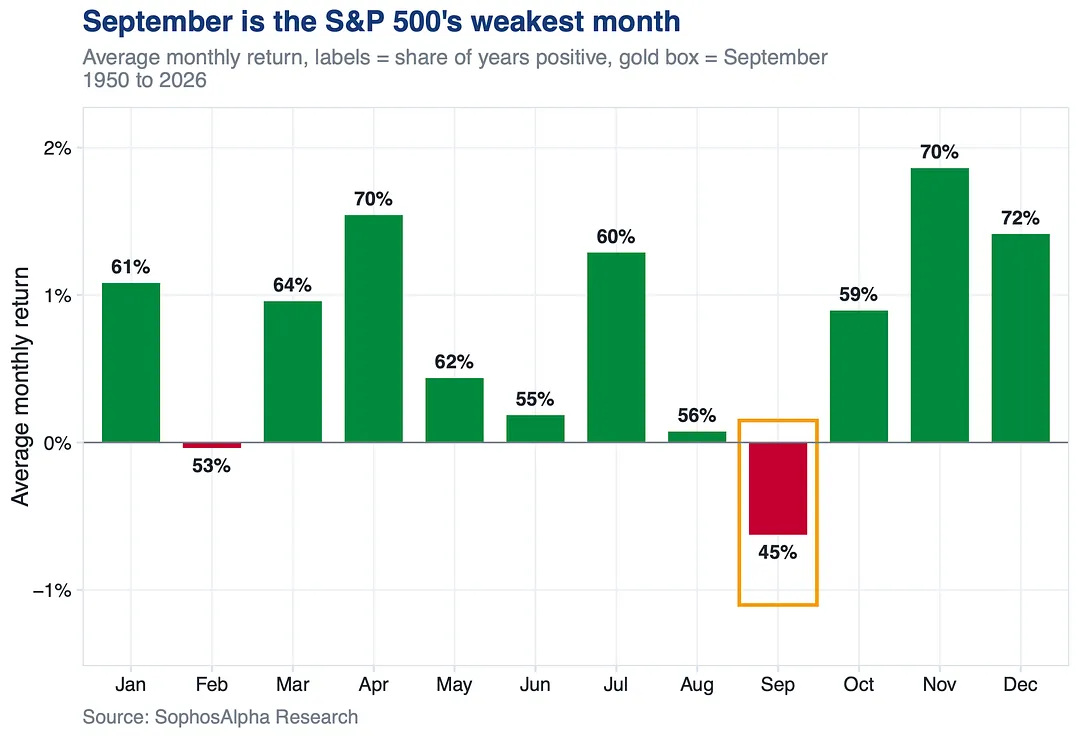
September screens as the worst performing month for the SPX followed by Q4 being the strongest quarter of the year.

Seasonal moves may be exacerbated by midterm election seasonality, which tends to be soft into the election and then strongly positive after it.

September screens as the worst performing month for the SPX followed by Q4 being the strongest quarter of the year.

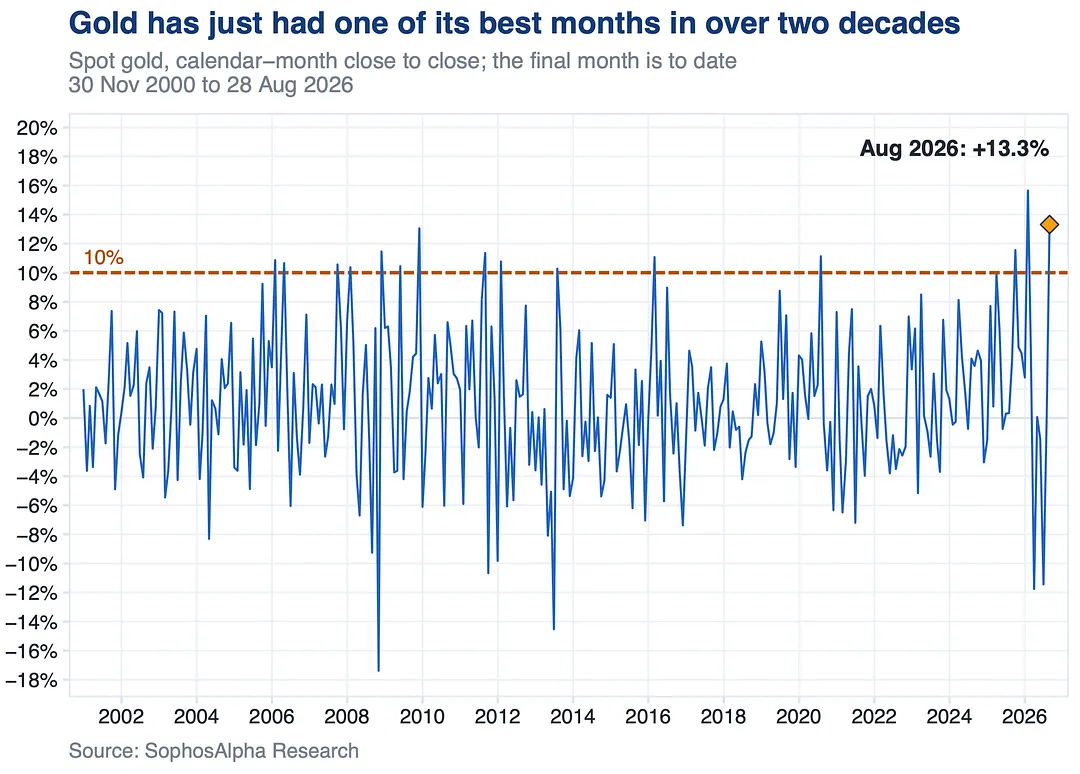
Gold has just had one of its best months in over two decades.

+13.3% in August, one of a handful of 10%+ months since 2000, and speculative demand hit a nominal record along the way.

Gold has just had one of its best months in over two decades.

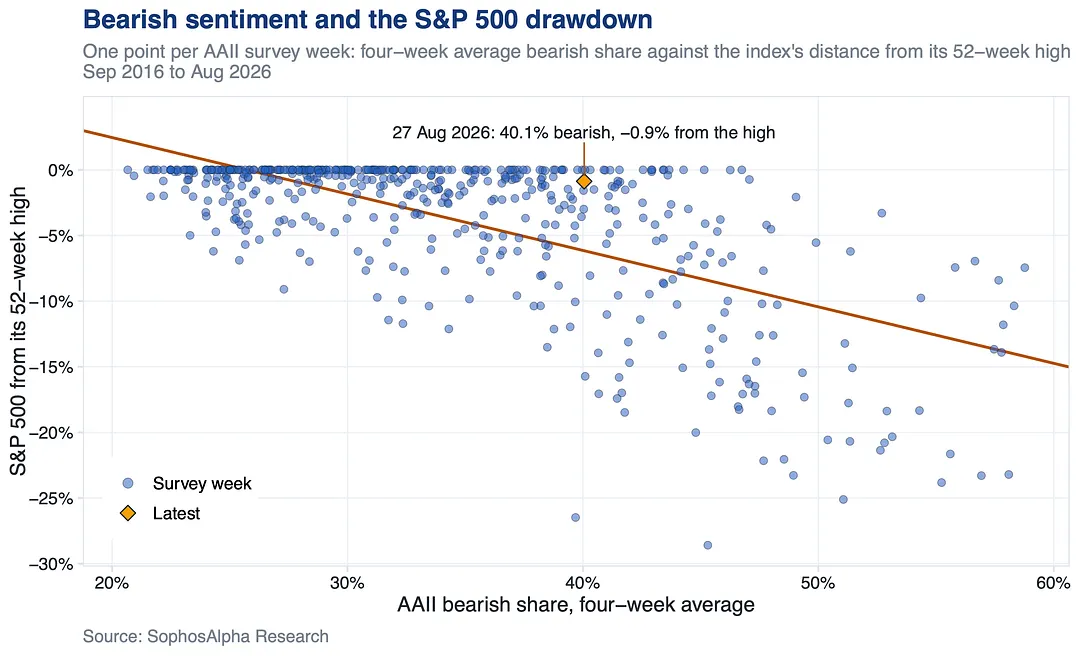
Investors are as bearish as they usually get after a 10% selloff, except there hasn't been one.

The bearish share has averaged above 40% for four weeks, a level that has coincided with the S&P sitting 7 to 10% off its highs. Today it is less than 1% away.

Investors are as bearish as they usually get after a 10% selloff, except there hasn't been one.

Equity bull markets tend to end with either a hiking cycle or a recession.

Currently, a recession is highly unlikely to manifest over the next few quarters. What is unclear is if the Fed hikes, and what the scale and length of the hiking cycle would be.

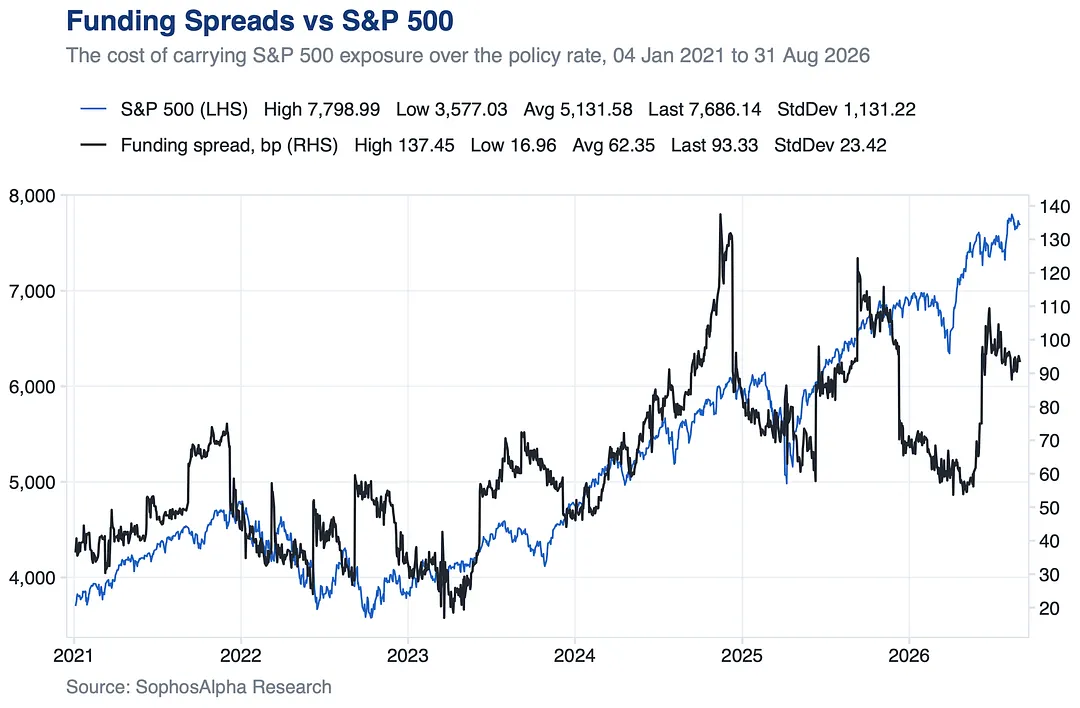
Meanwhile, professional investors have not been chasing this last leg higher.

The cost of carrying S&P 500 exposure, which reflects how much leveraged longs are paying dealers to hold their positions, spiked into the July rally and has been easing since, even as the index printed fresh highs in August.

Equity bull markets tend to end with either a hiking cycle or a recession.

Earlier, August 2026Later, October 2026