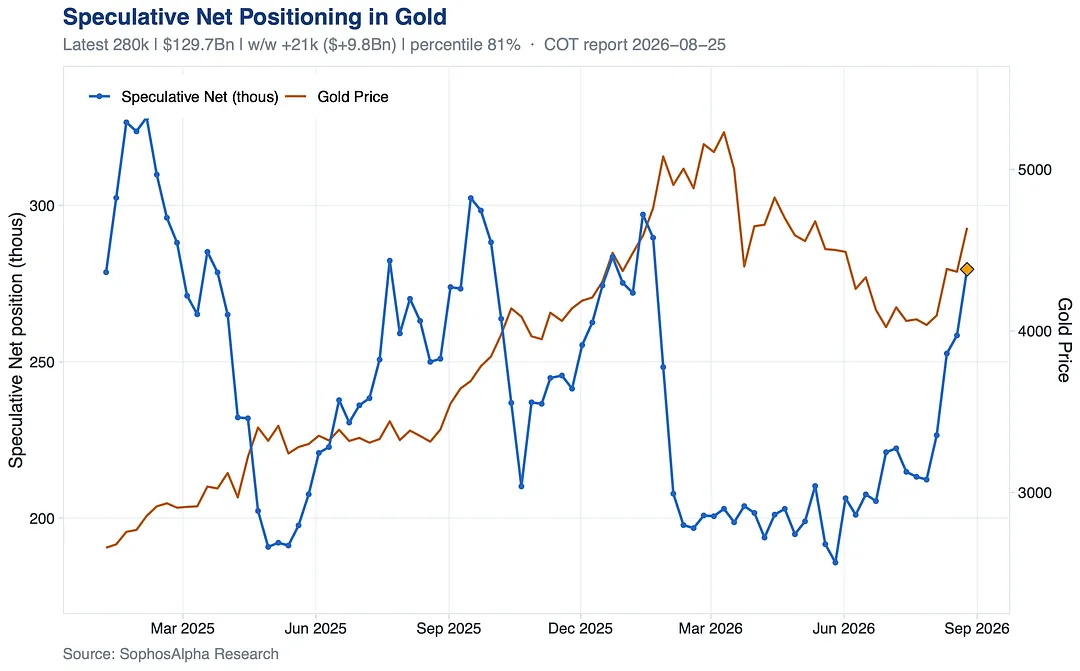
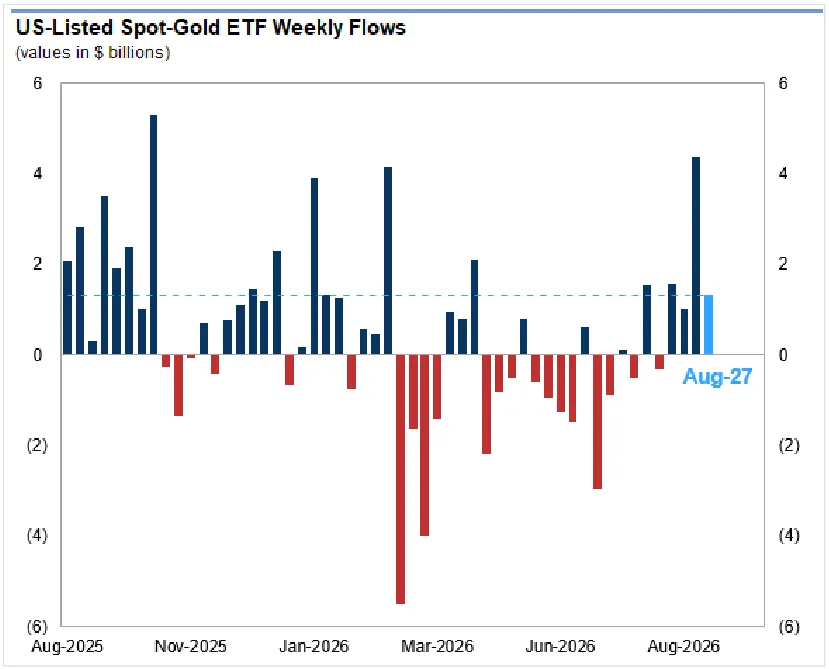
Substantial speculative GOLD buying surrounding the announcement of Treasury market intervention, extending a run of purchases that began with the July FOMC.
Then Jackson Hole turned hawkish, real rates rose, gold dropped sharply.
The desk notes of Sophos Alpha, an independent quantitative research desk. Daily market notes across many topics, including CTAs, risk parity, vol control and other systematic funds, hedge fund activity and investor sentiment, dealer gamma and liquidity, volatility and tail risk, in equities, rates, currencies and commodities.
95 notes
4 notes
Then Jackson Hole turned hawkish, real rates rose, gold dropped sharply.
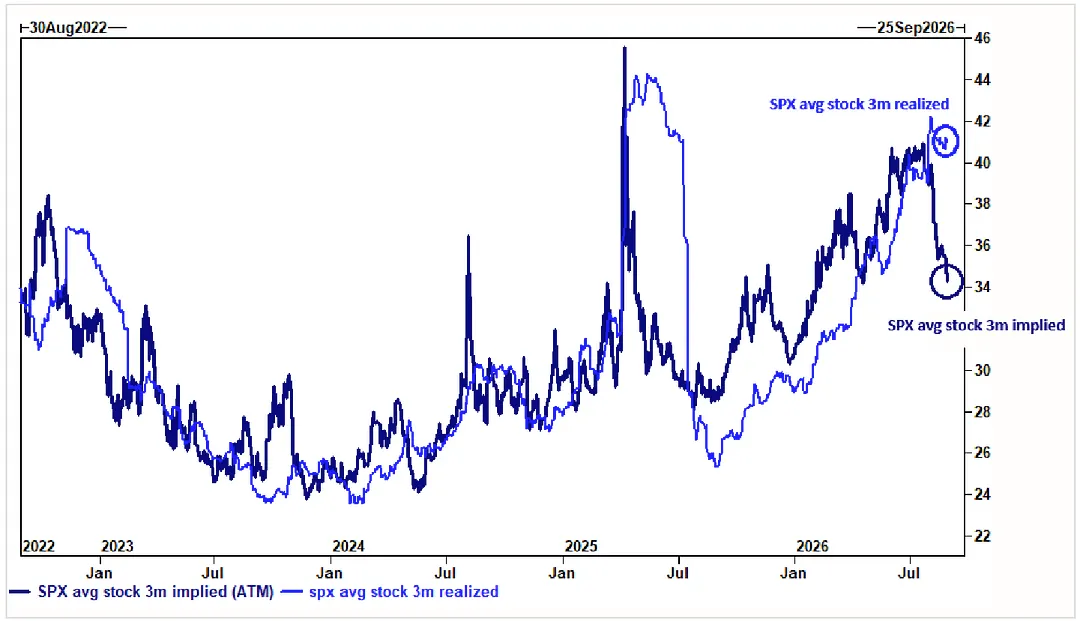
3m implied near 34, 3m realized around 41.
That negative vol premium has shown up maybe once in four years, and a third of the index has implieds near six month lows. This is when you own vol.
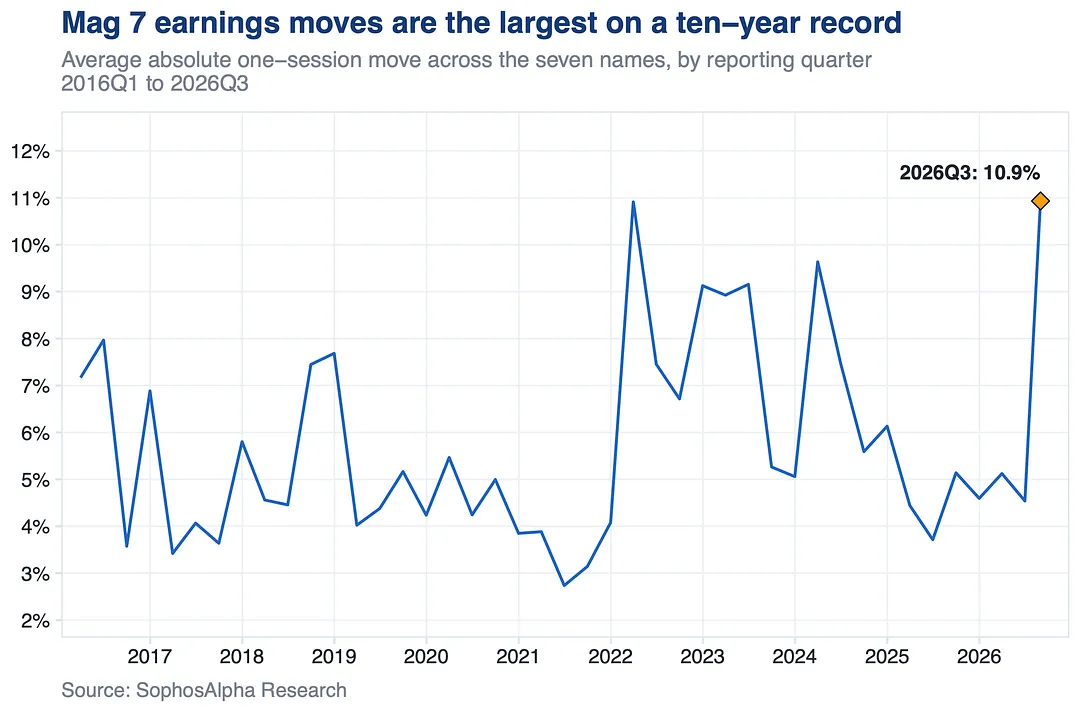
Three of the seven swung double digits in a single session, while the VIX sat under 16.
Index vol is asleep. The biggest names in the world are not.
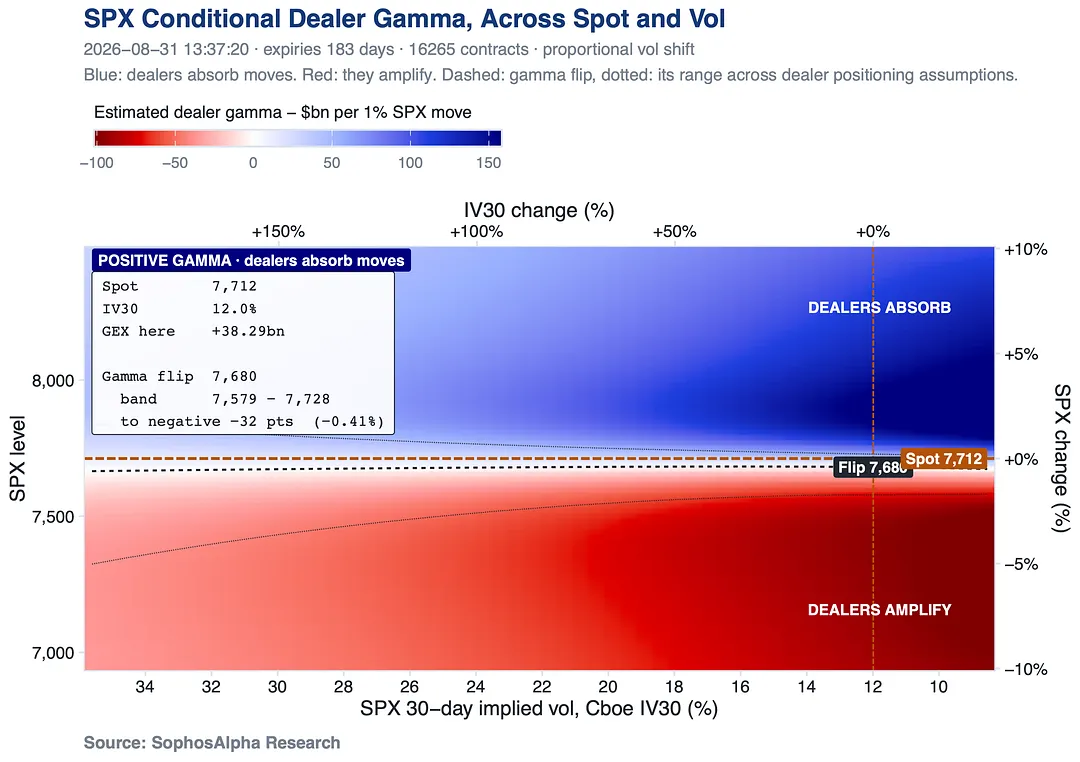
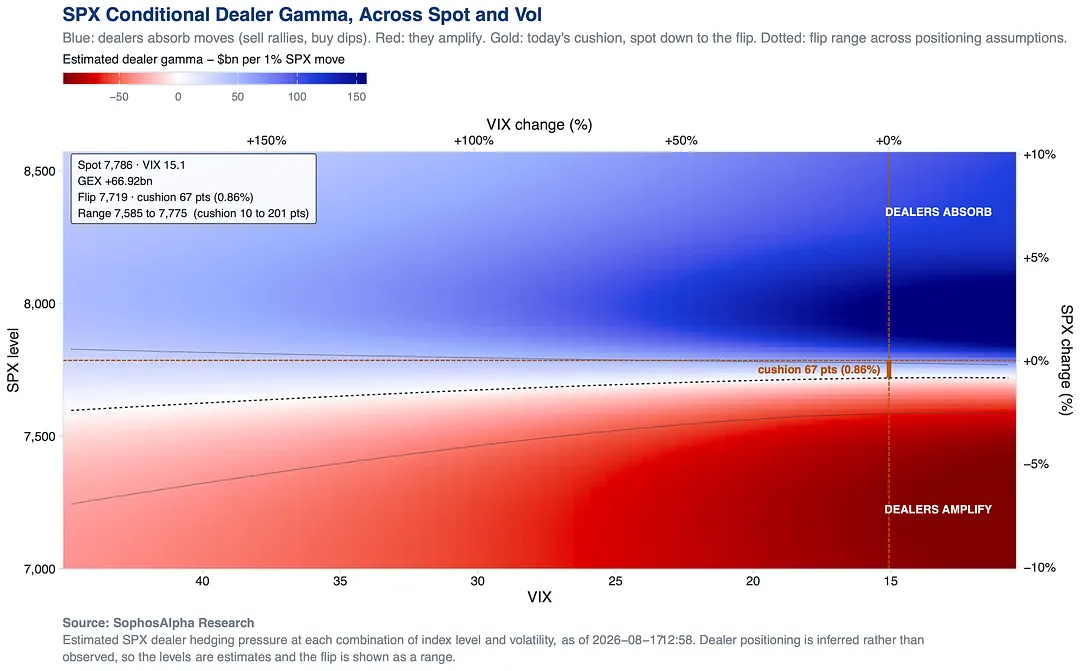
Dealers are absorbing moves rather than amplifying them, but the cushion is thin: the flip sits roughly 32 points under spot, 0.4%. And it barely shifts as vol rises, so this regime ends on price, not on a vol spike.
3 notes
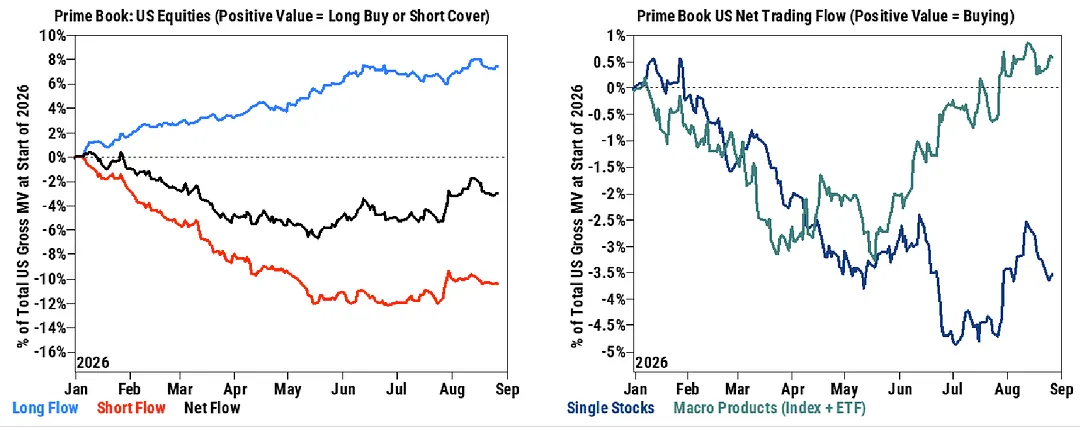
They covered shorts in index and ETF products while shorting single stocks at a much faster pace than they bought. Every defensive sector was sold, the most since April 2025.
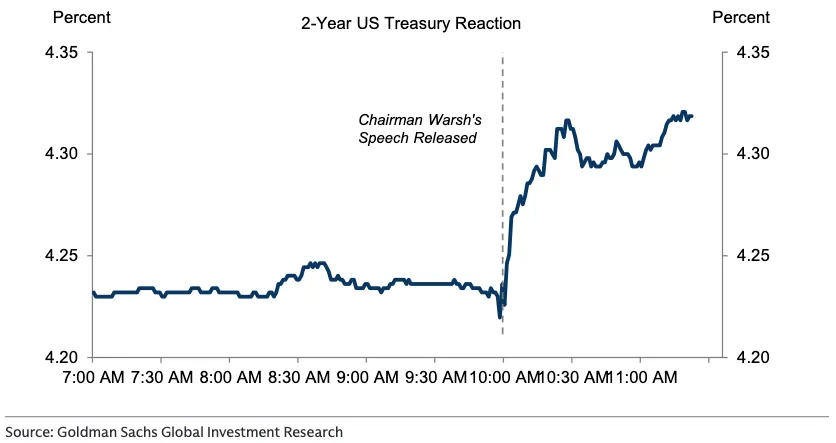
September hike odds went from roughly 30% to just above 50% in minutes. August CPI and PPI just became the most important prints on the calendar.
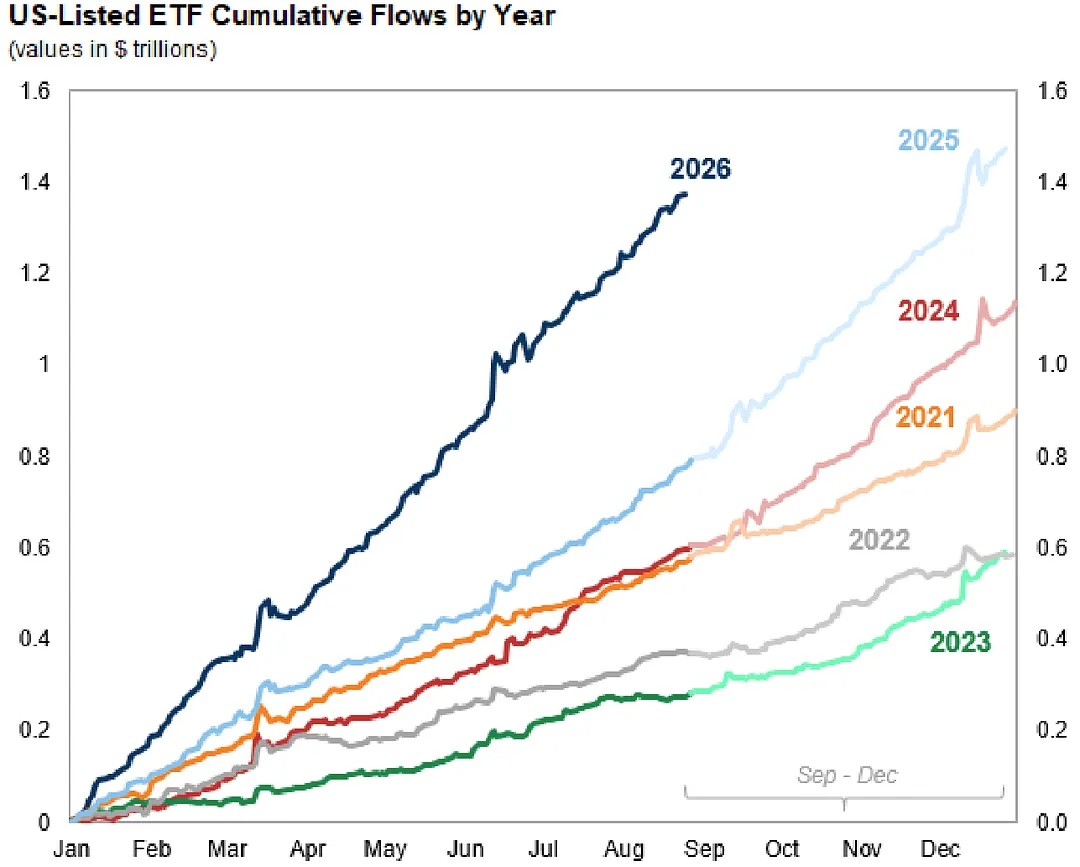
2026 is running above all of them, and it isn't close.
Money has come in at a record clip since January, with the seasonally strongest months still ahead and a record wave of new products hitting the market.
2 notes
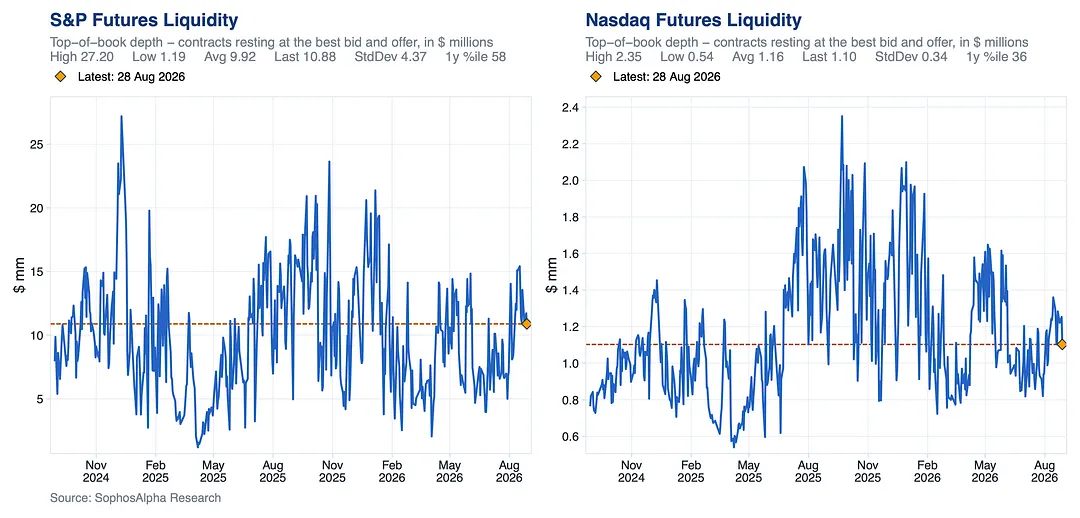
Consistent with market makers pulling size ahead of Warsh's first Jackson Hole keynote.
3 notes
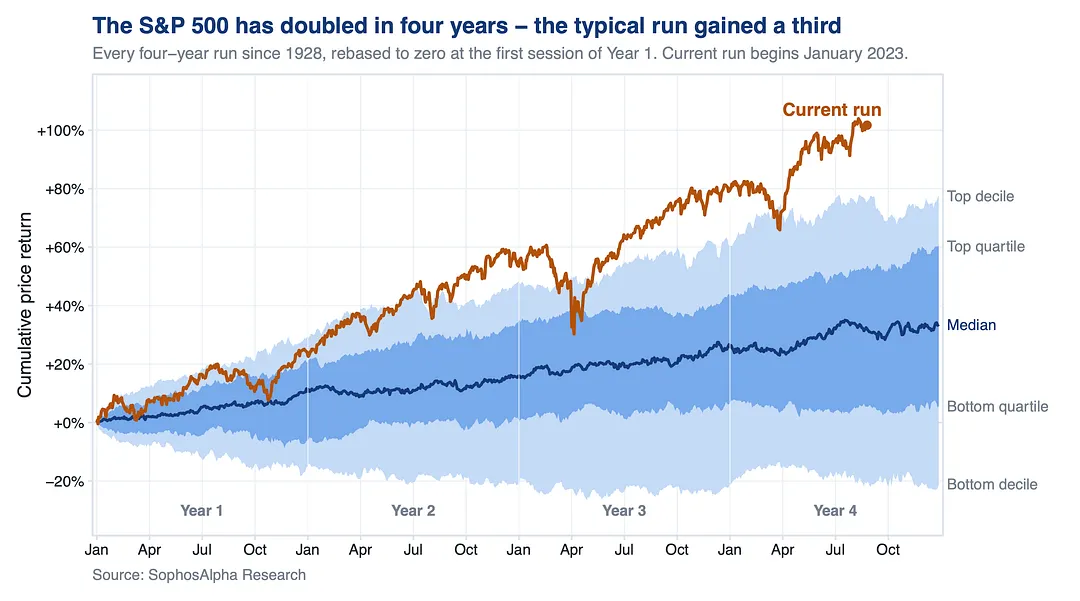
Four years of that adds up to a lot. The index has doubled since January 2023.
The median four year run since 1928 gained a third.
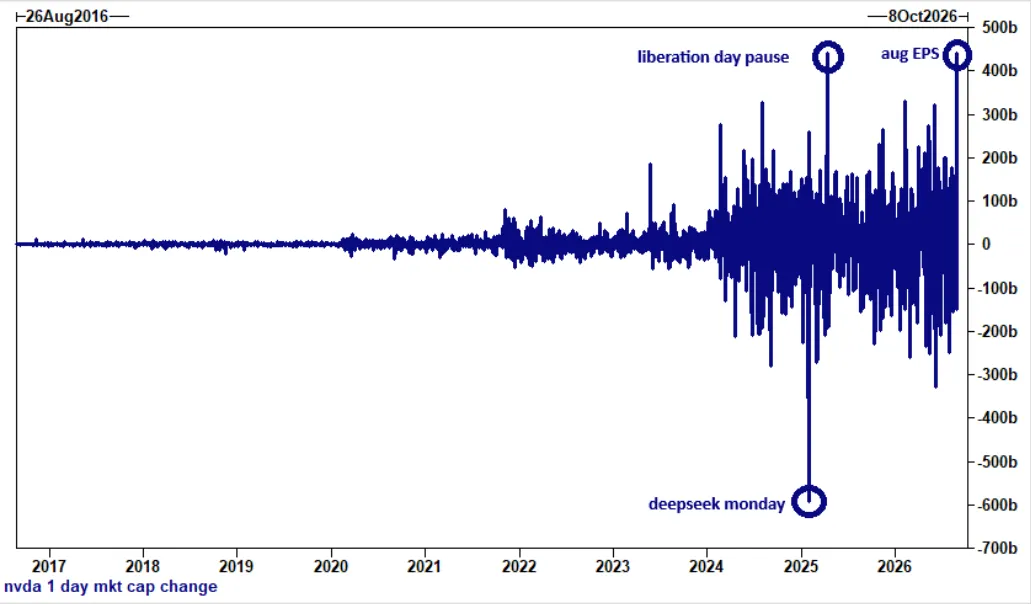
+$440bn mkt cap increase — second largest for $NVDA ever and one of the top of any company (ever).
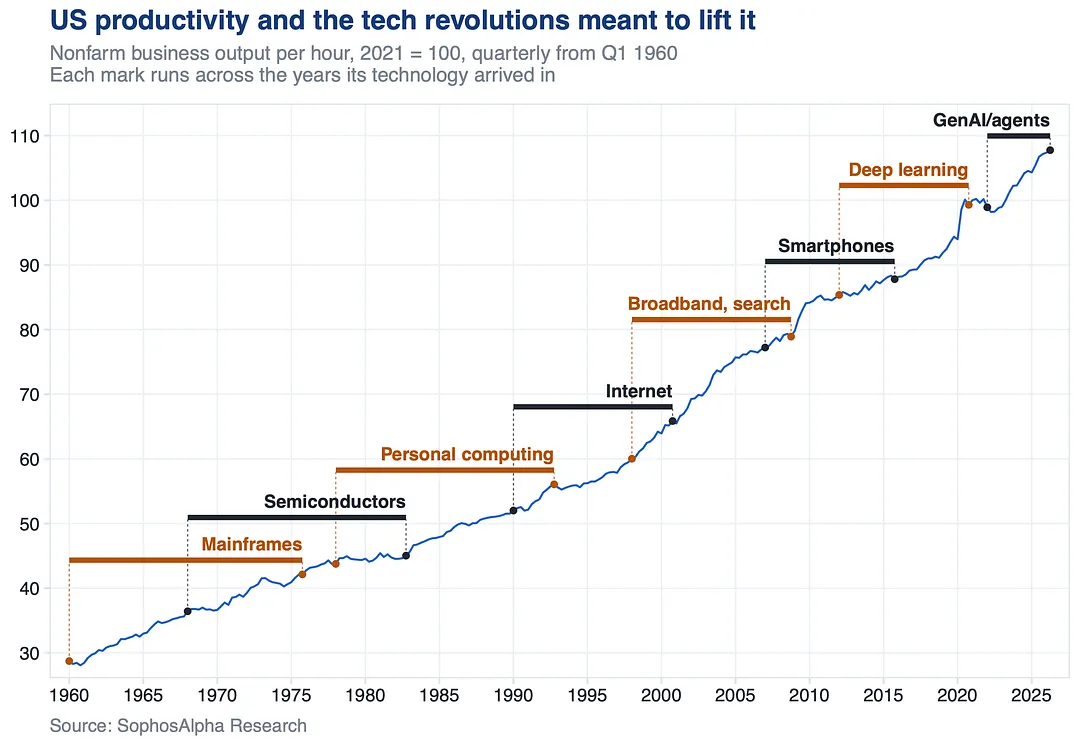
Semiconductors, personal computing and smartphones each fell in the three slowest stretches of US productivity growth since 1960. Costs come first, results arrive much later.
10 notes
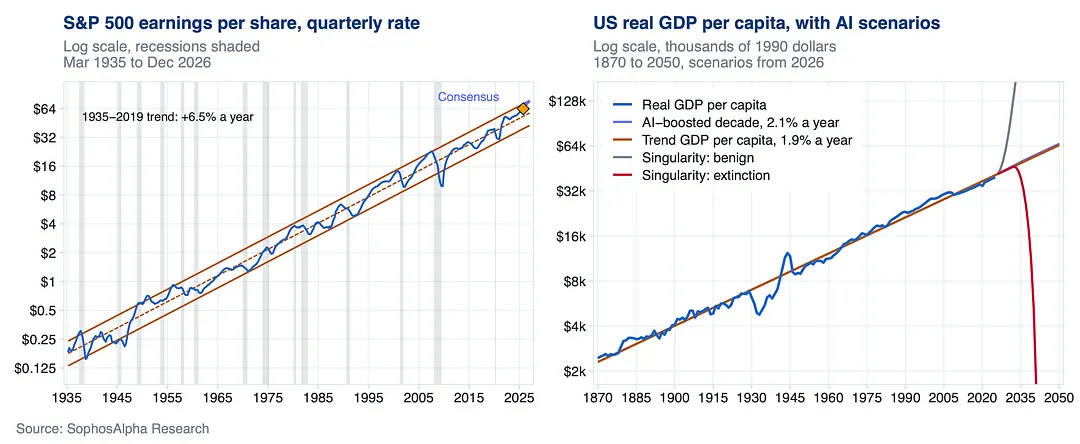
US real GDP per capita has compounded at 1.9% a year since 1870, and even an AI boosted decade at 2.1% barely shows up. Some are considering more extreme scenarios this time, from utopia to extinction.
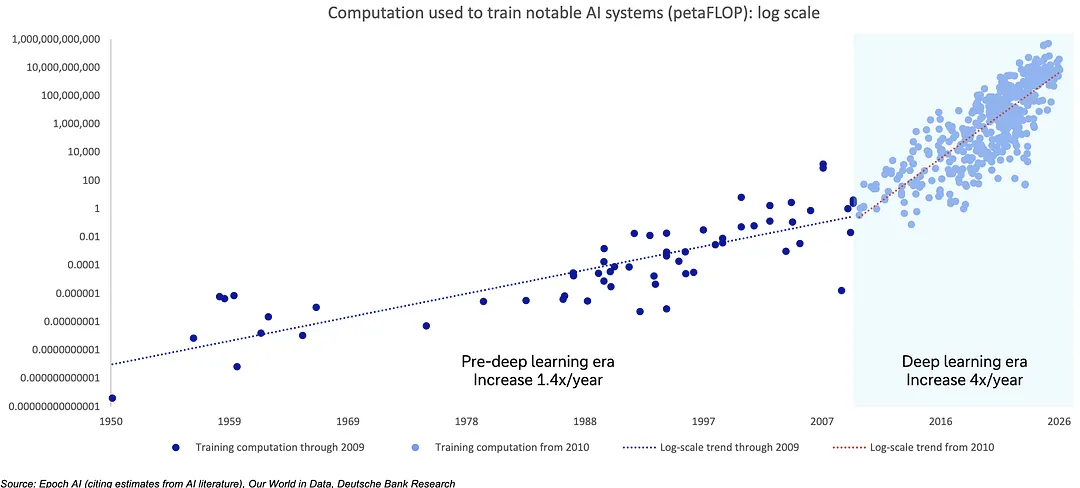
Moore's law manages 1.4x.
That slower rate, the 18-24 month doubling everyone anchors to, is exactly what notable AI systems ran at before deep learning. Since 2010 it is 4x, because systems, memory and algorithms are all improving at once.
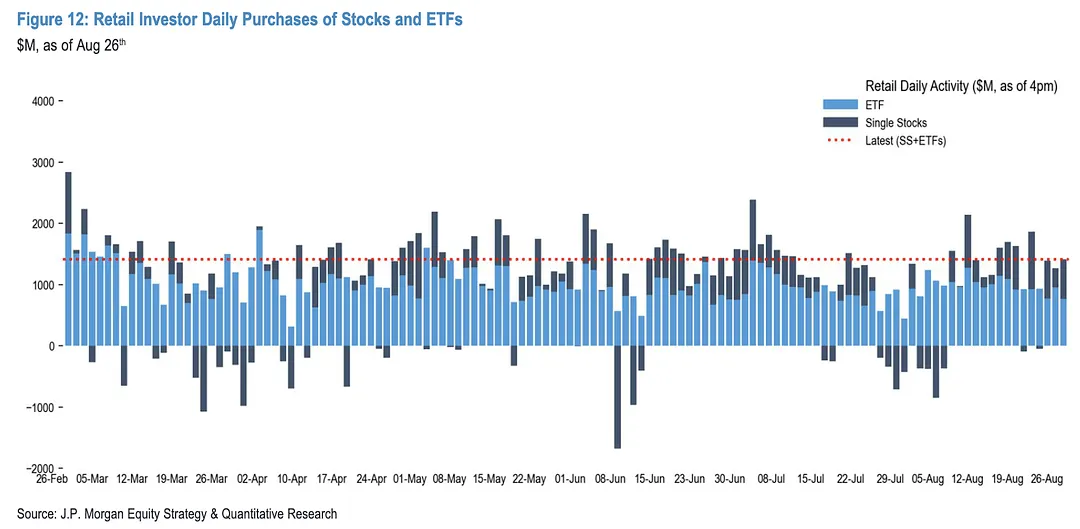
Total buying landed right on its twelve month average again this week. Underneath, the split is stretched. Measured against their own histories, ETF demand is near the bottom of its range while single stock buying is running hot. The mix changed, the headline did not.
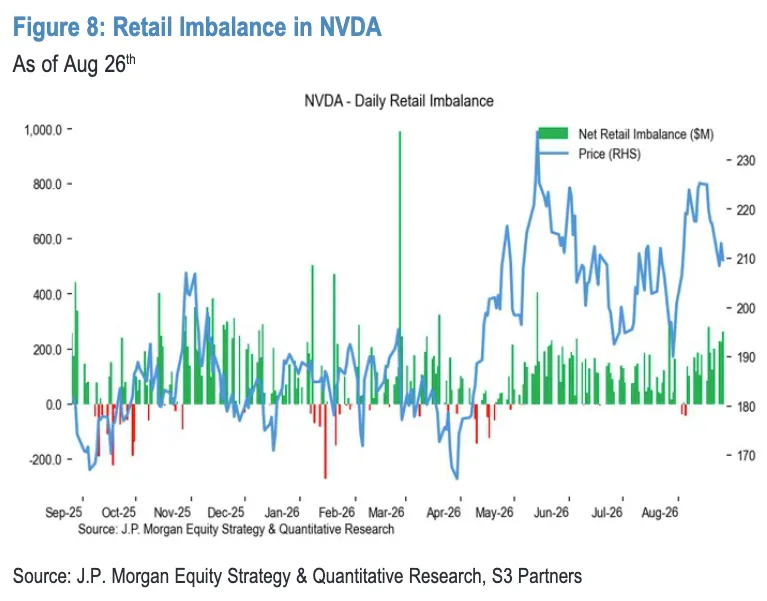
Daily net retail imbalance ran steadily positive for weeks with no unusual buildup ahead of the report. Heading into the biggest print of the season, there was simply no evidence of chasing.
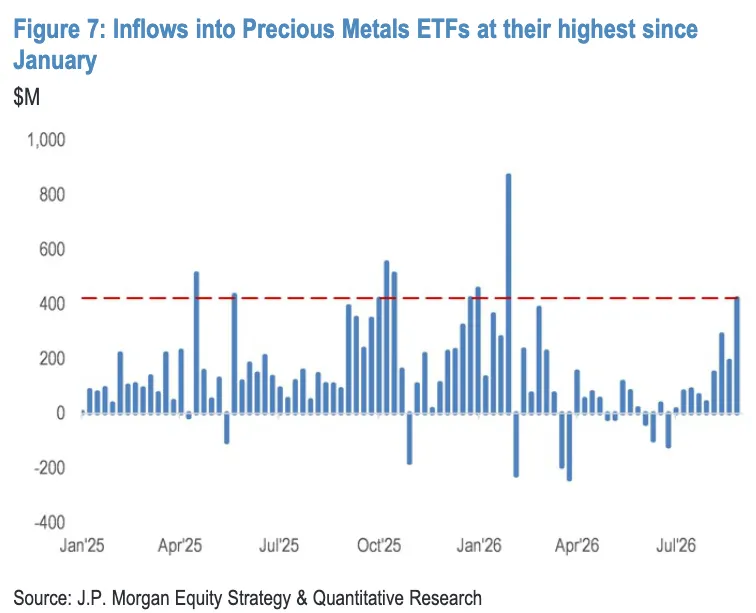
Precious metals inflows hit their strongest level since January and were one of the only categories in the green all week. When one sleeve is the sole exception, that is a choice, not a rounding error.
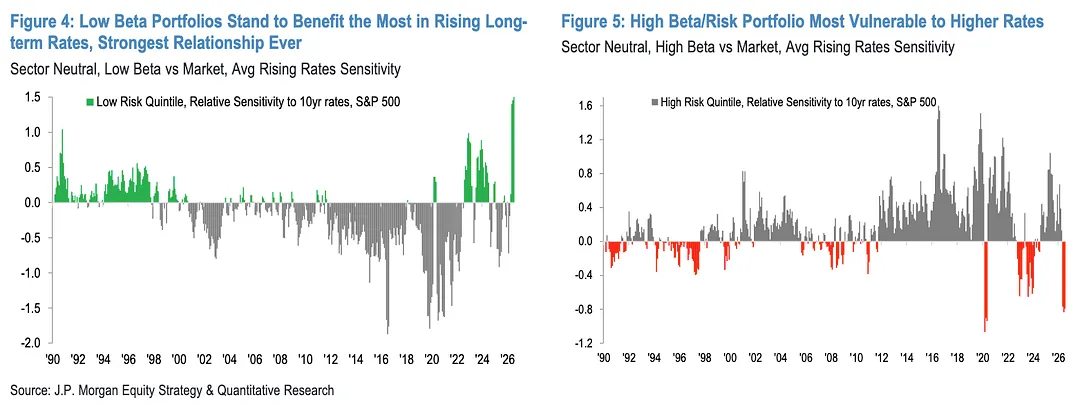
Low beta stocks have never been this positively sensitive to rising long term yields.
The relationship flipped over the past few years and now sits at the strongest reading on record. If yields keep grinding higher, the boring stuff is the relative winner.
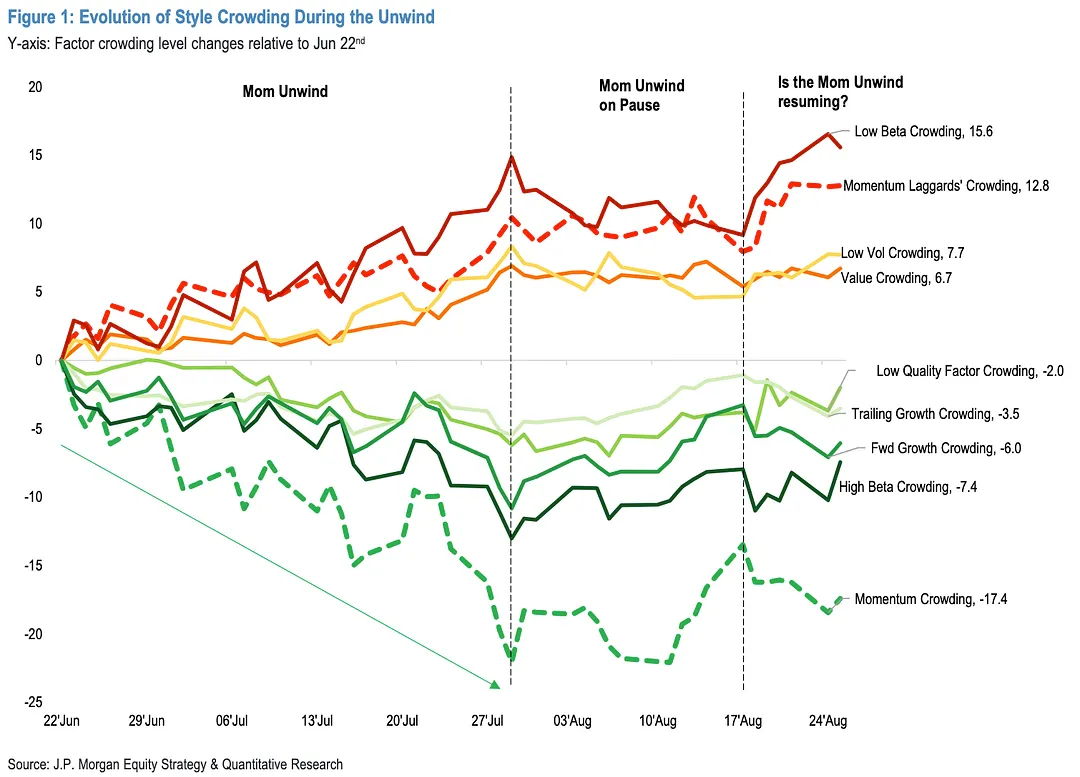
Low beta is now the most crowded style since this unwind began, with momentum laggards right behind it. Momentum itself keeps de-crowding.
Defensive positioning stops being defensive once it becomes the consensus trade.
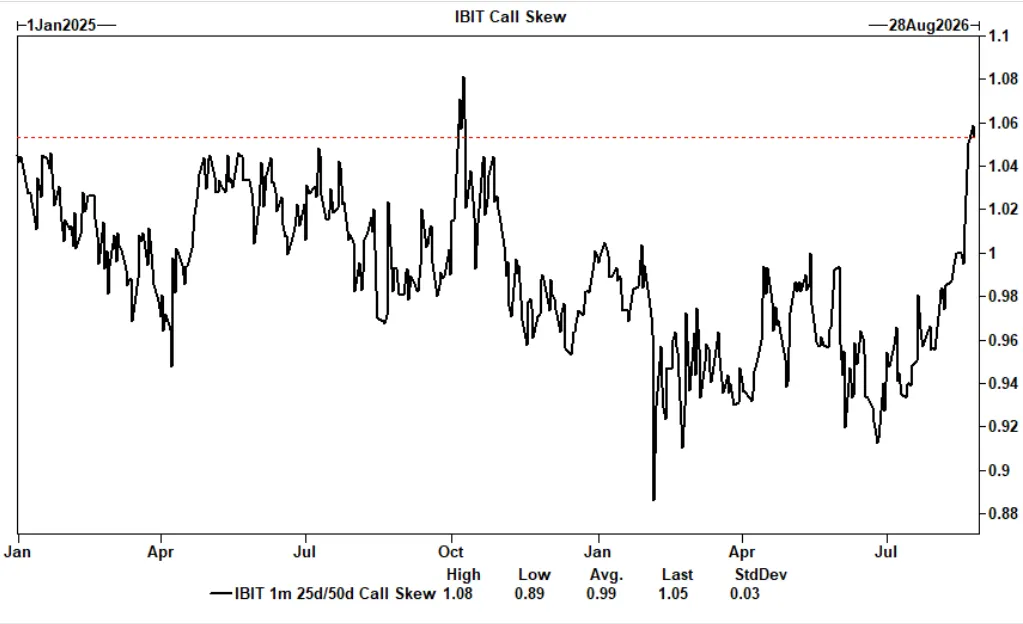
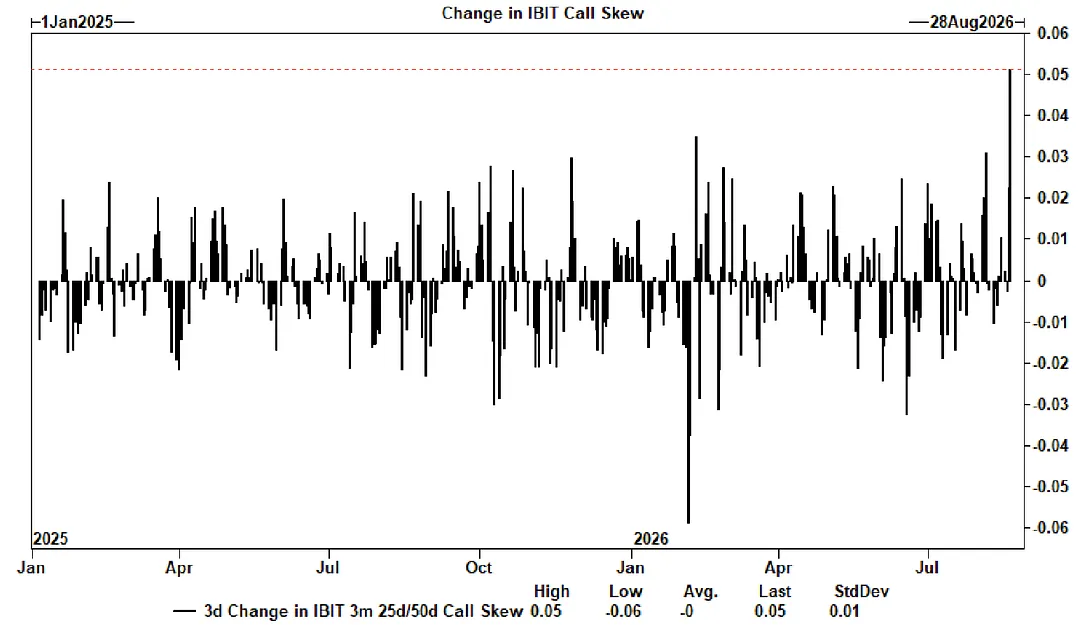
That flood of demand for upside calls has pushed short term call skew to one of its most extreme readings since the ETF launched.
In plain terms, options traders are paying up in a big way to bet on more upside in bitcoin right now. Worth watching whether that positioning gets validated or unwinds.
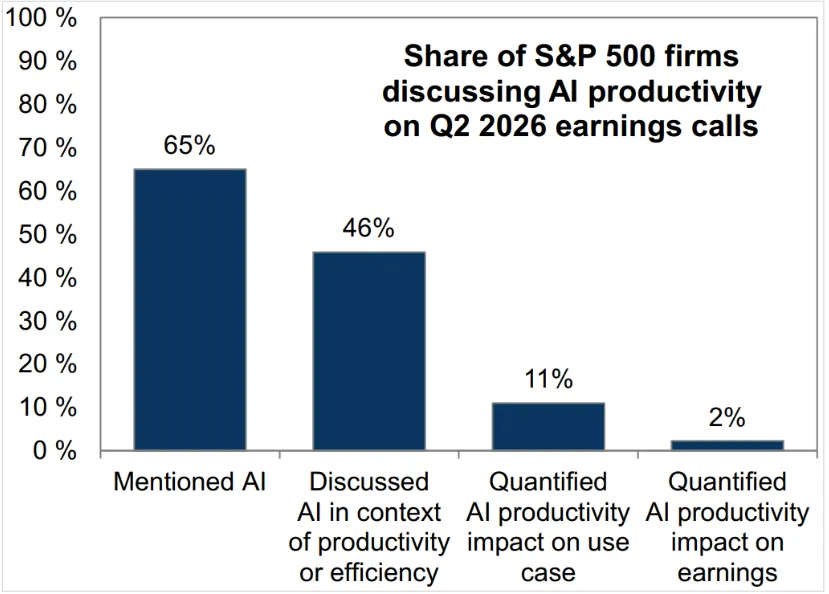
The rest of the index is actually putting up solid numbers too, especially given how sluggish the broader economy has been. But leaning this hard on one corner of the market only works if that AI spending eventually shows up as real returns.
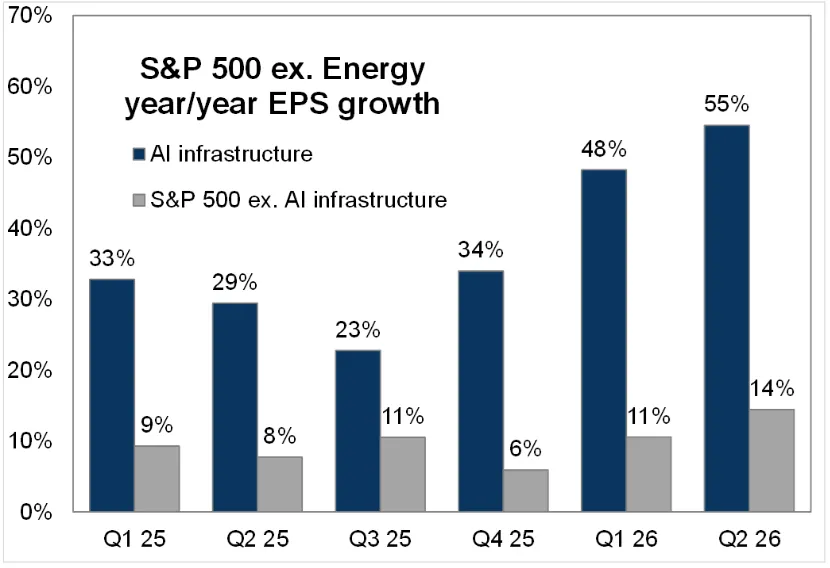
Almost none of them could actually show it showing up in the numbers yet. That gap between the AI narrative and AI proof keeps widening.
Markets have been happy to run on the story so far, but the burden of proof on returns only gets heavier from here, and a strong economy won't buy that patience forever.
3 notes
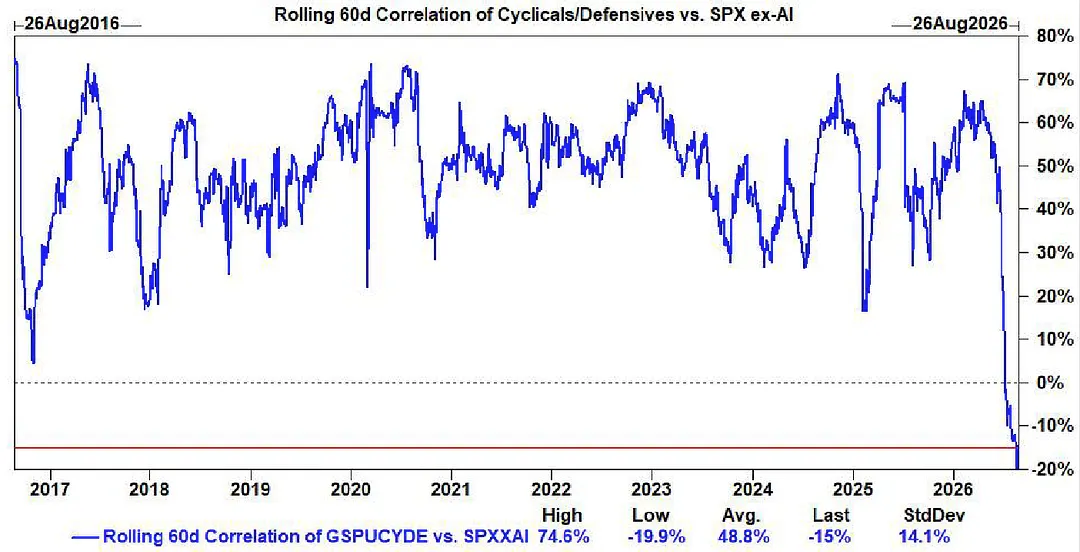
The 60-day correlation between Cyclicals/Defensives and SPX ex-AI has collapsed to negative levels.
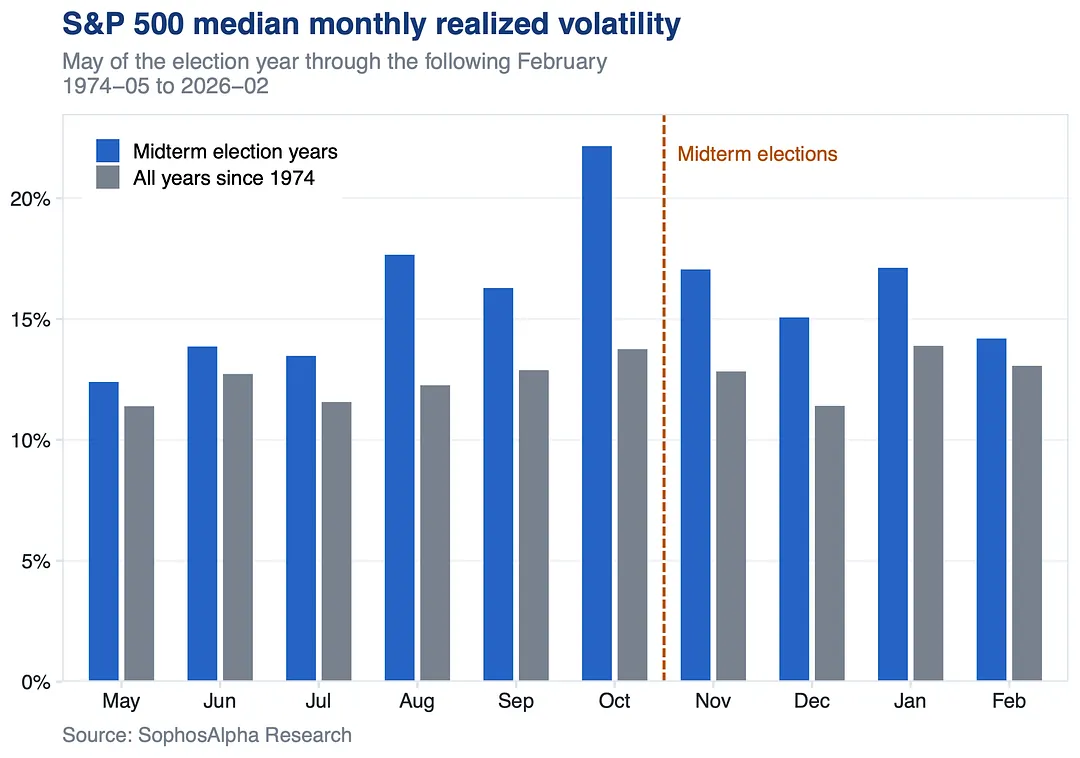
October and November are the most volatile months of the year for the S&P 500, and in midterm election years they run hotter still. The whole stretch from May into February sits above normal. 2026 is a midterm year.
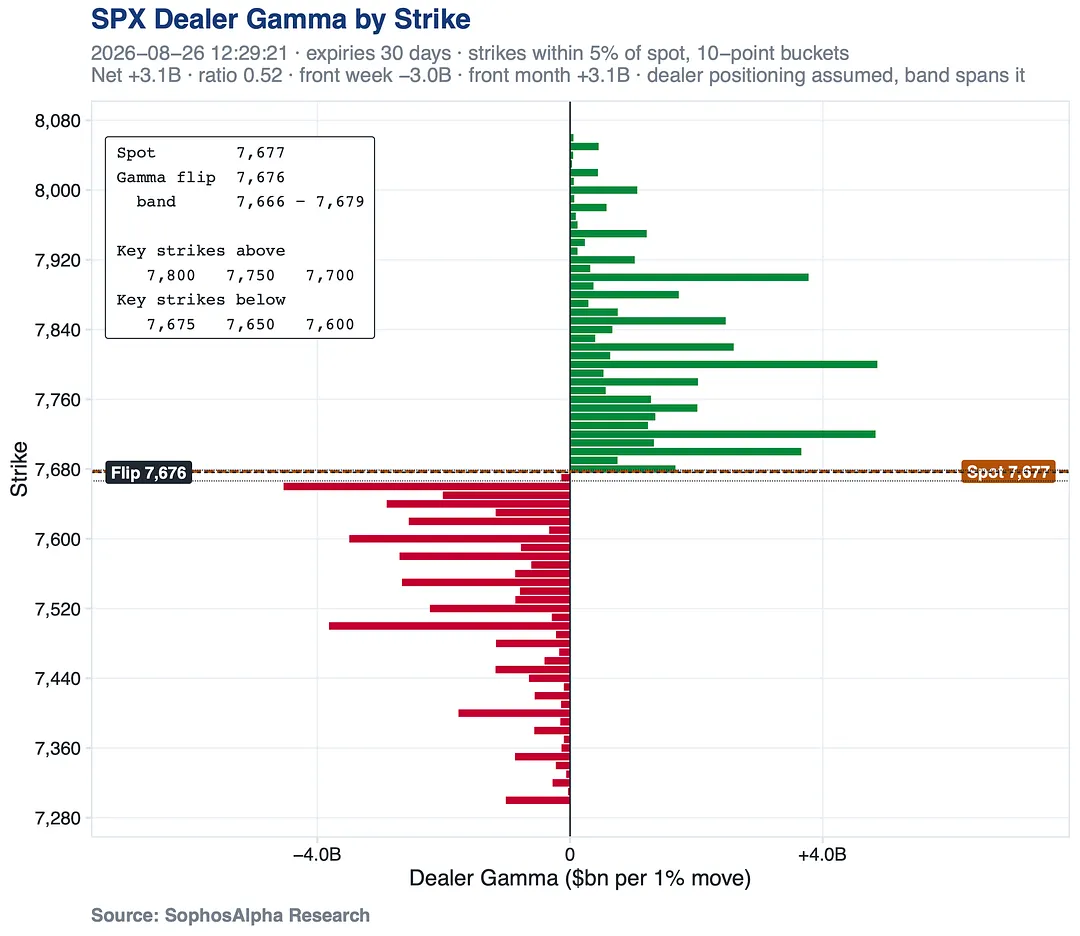
Gamma near spot is razor thin, with front week gamma already negative even as front month holds positive. $NVDA earnings hit after the close, thin gamma here means less dampening on the move.
7 notes
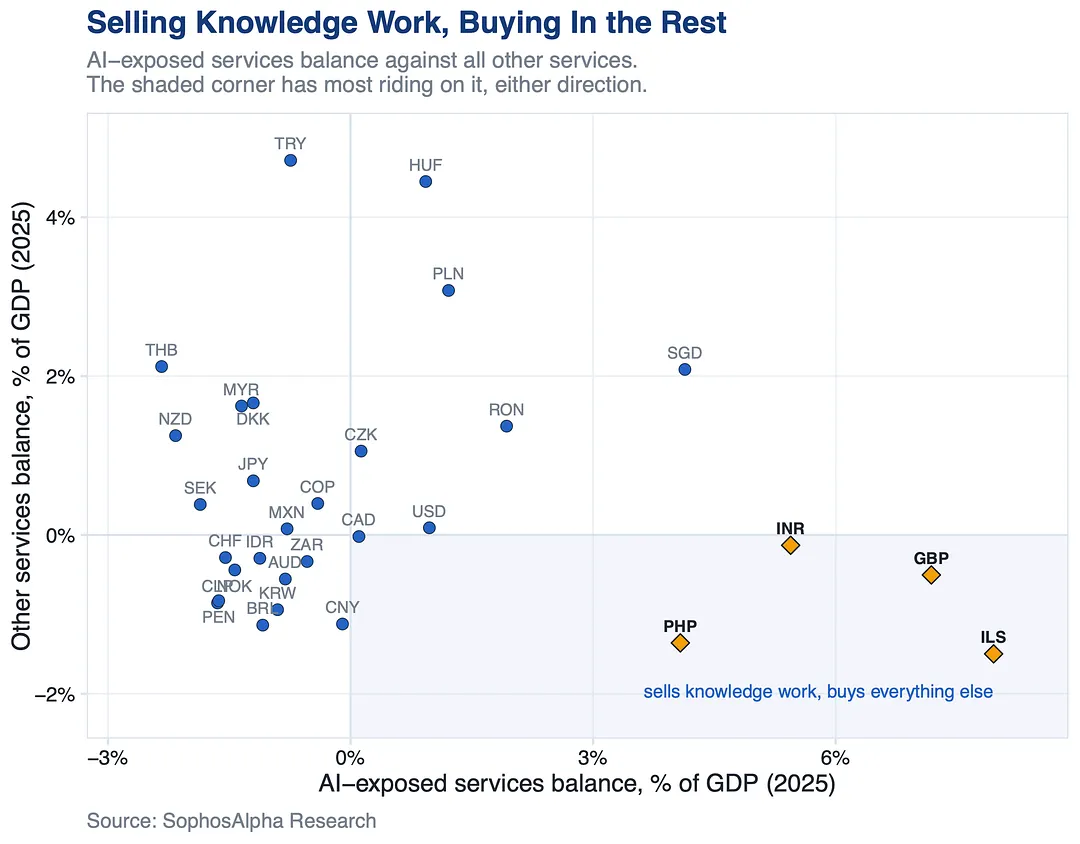
ILS, GBP, PHP and INR sit deepest in that corner, running surpluses in the services AI touches and deficits everywhere else. Tourism exporters TRY, THB and NZD sit at the opposite end.
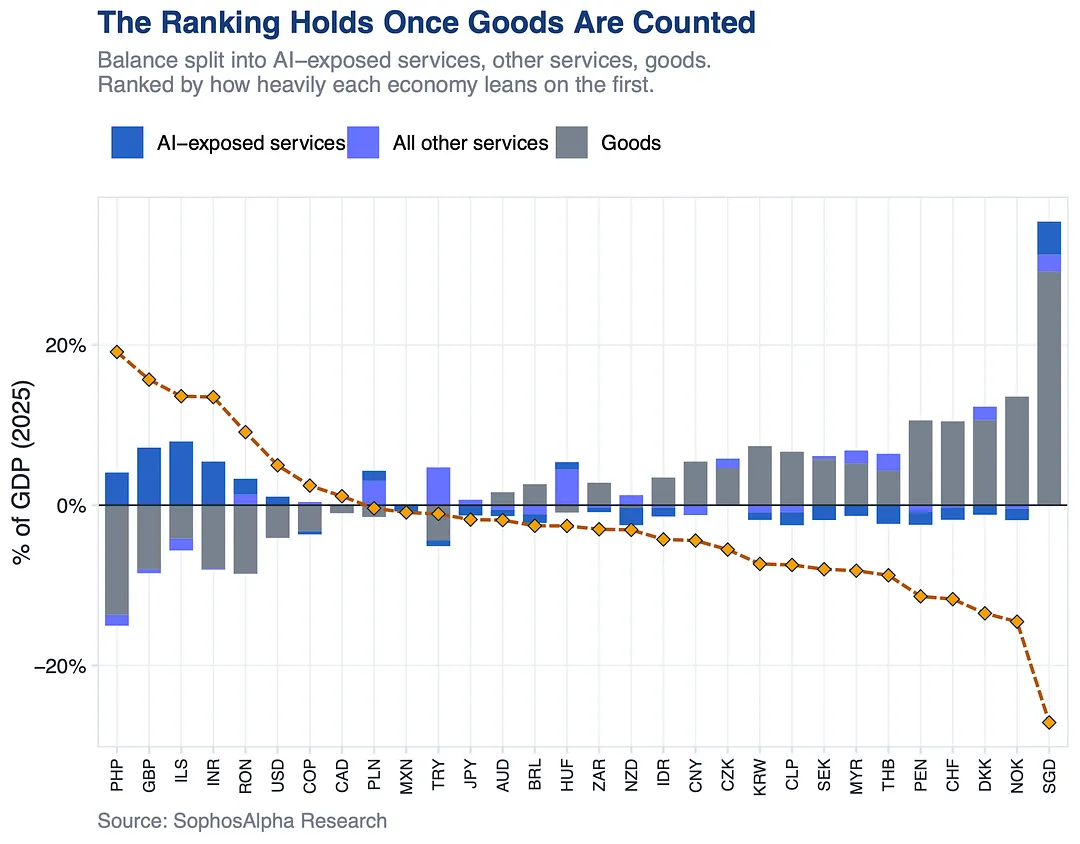
Goods do not rescue the names at the top. Net those service exports against all other services, then against goods, and the same four remain: PHP, GBP, ILS and INR.
NOK and SGD sit at the other end, the first funded by oil, the second by a goods surplus that swamps everything else.
The ranking assumes AI hits services rather than goods, which robotics may eventually blur.
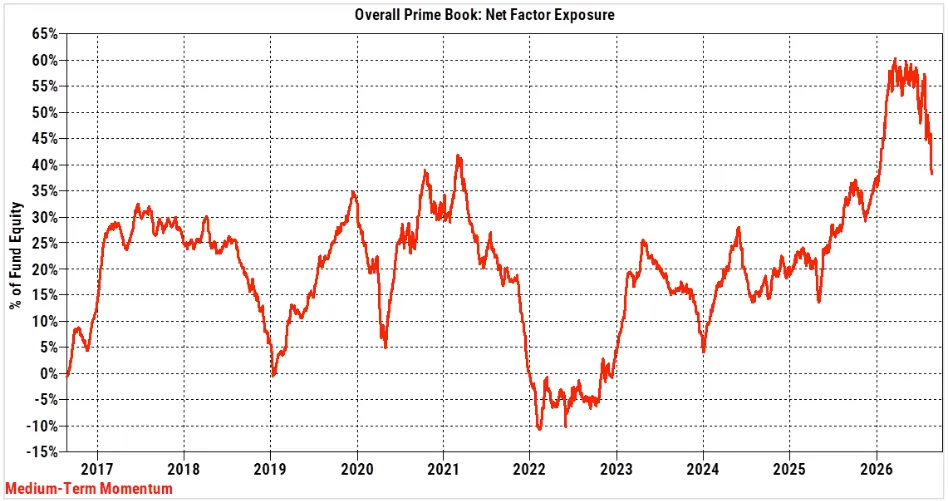
Goldman sachs’s clients levered into the factor as it worked, and that crowding has just been cut back sharply.
Structurally high exposure can persist while the AI buildout holds, but the path gets far more volatile.
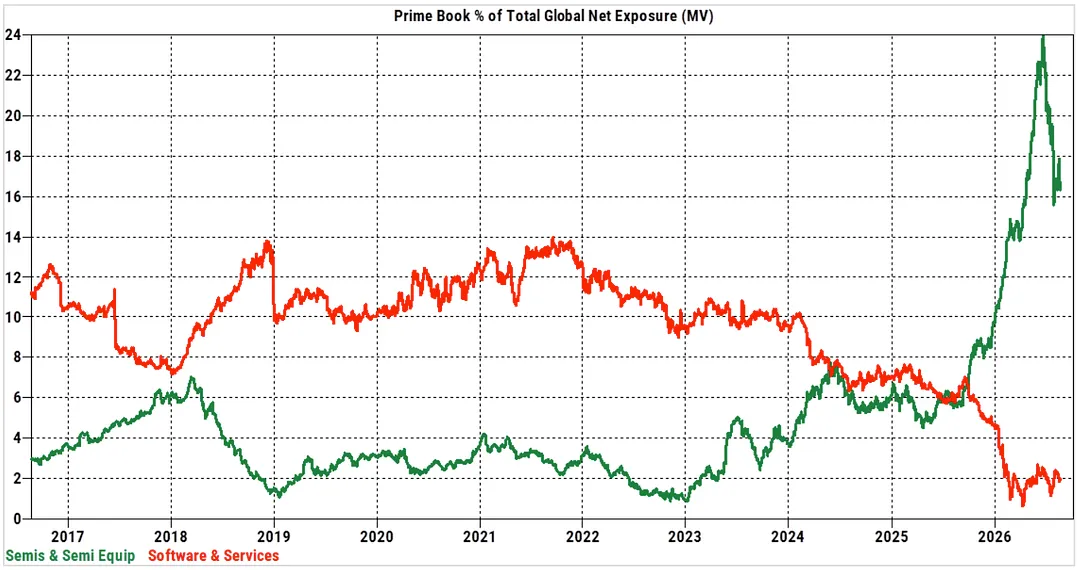
That inverse went into overdrive last year on the AI enablers vs disrupted trade, semis at the top of their ten year range, software at the bottom.
The fever has since broken, but the wedge likely stays structurally wide.
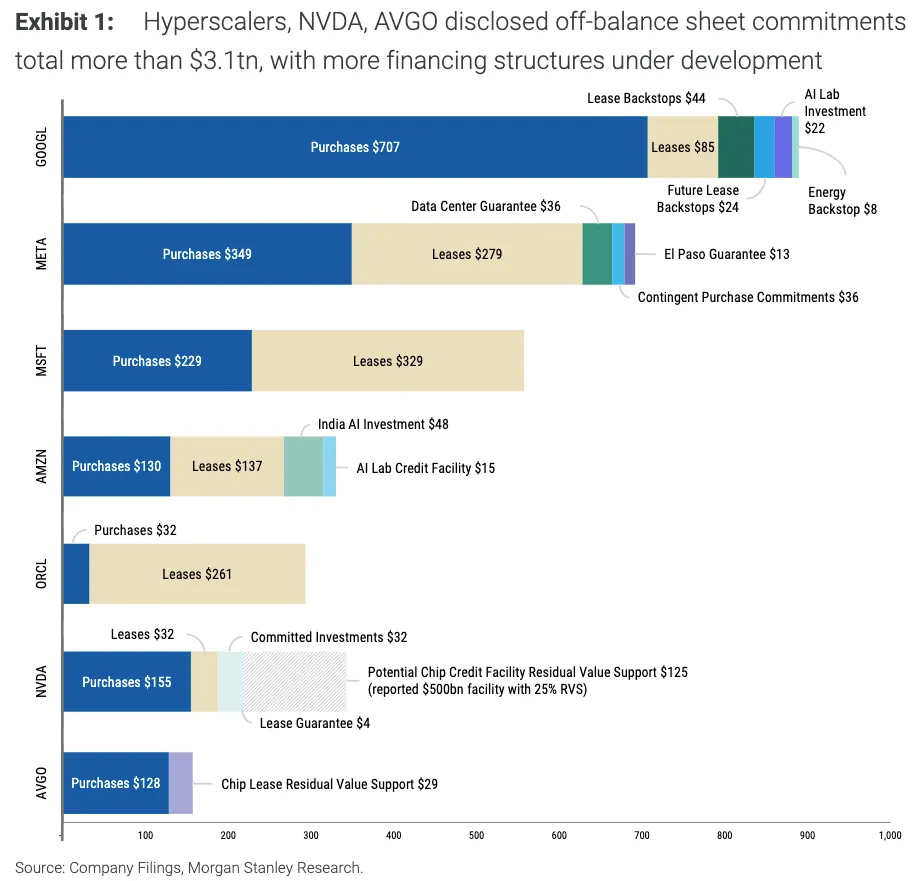
The gap is being plugged off balance sheet: leases, debt, guarantees. Total disclosed commitments from Big Tech + NVDA + AVGO now top $3.1tn.
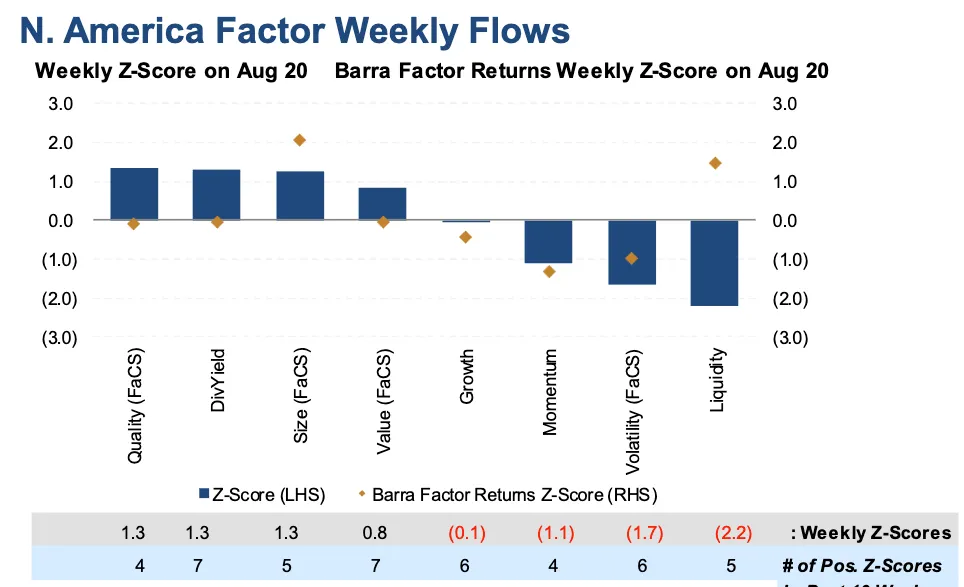
This week brought buying in quality companies, steady dividend payers and larger caps, the names investors reach for when they want to play it safe.
On the other side, momentum, volatility and less-liquid names got sold. A defensive shift after a rough stretch for momentum.
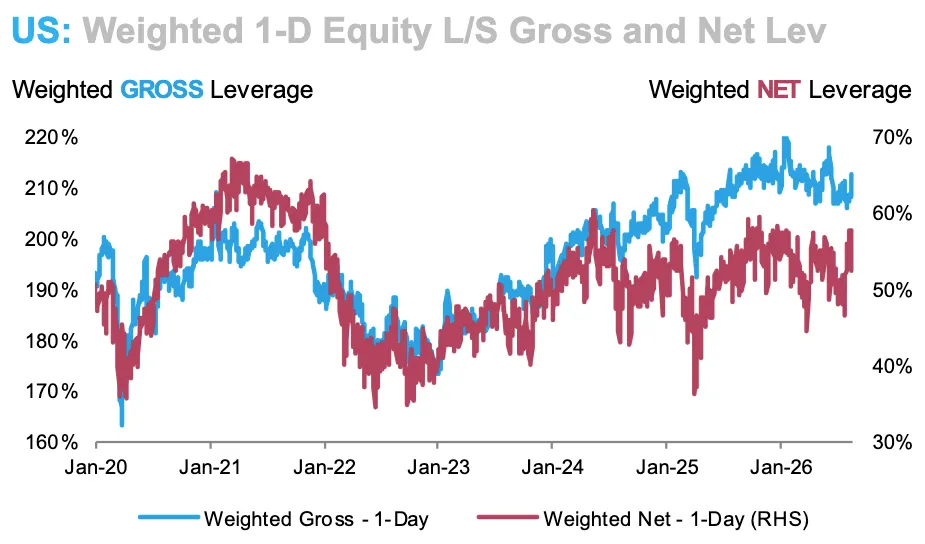
Gross leverage, total long and short exposure, sits near its highest level since 2010.
Net leverage, the lean toward being long, just posted one of its sharpest weekly drops in over a decade. Funds are trading more, betting less.
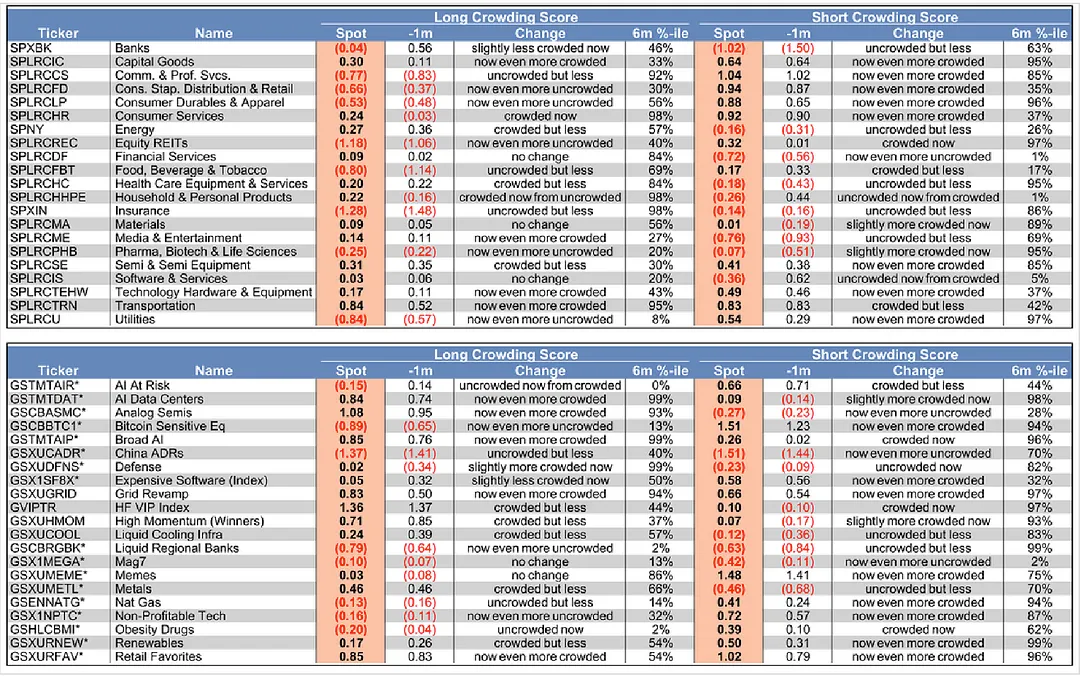
Goldman's prime brokerage data shows longs piling into Household & Personal Products, with crowding jumping to a 6-month high, while shorts covered at the same time, crowding falling to a 6-month low.
That two-way move, longs building as shorts unwind, is rare and reads bullish.
8 notes
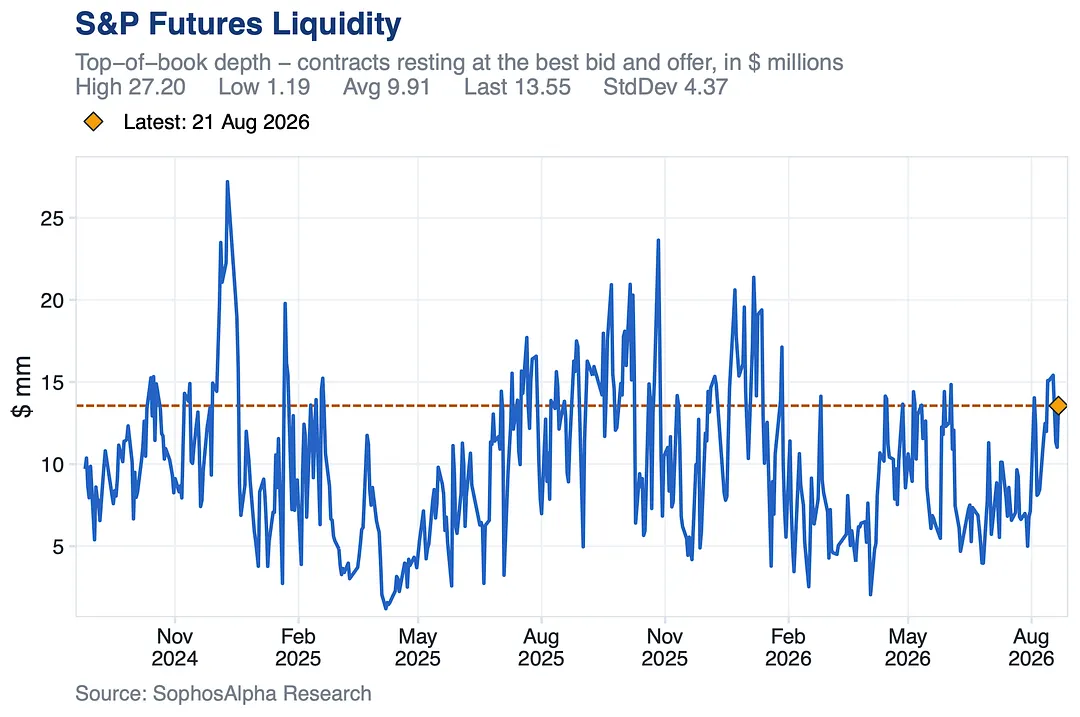
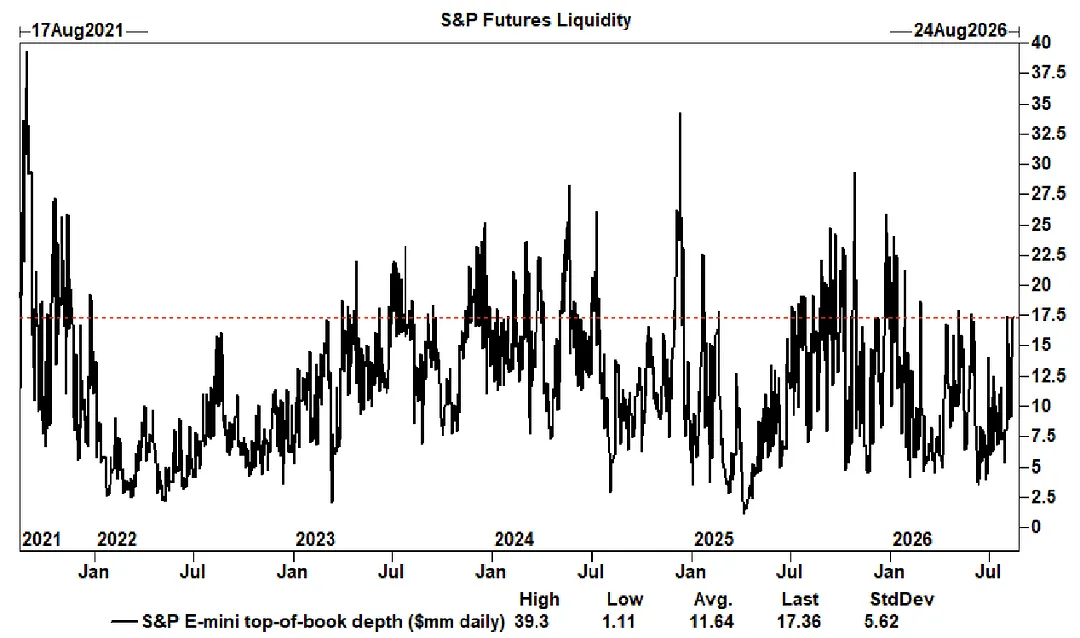
Depth at the best bid and offer is running well above its two year average, a world away from the thin conditions at the start of the month.
It matters more than it sounds.
A deep book means risk changes hands fast without dragging price. Size gets absorbed rather than amplified, and that cushions the market when flow shows up.
Conditions are nowhere near stressed.
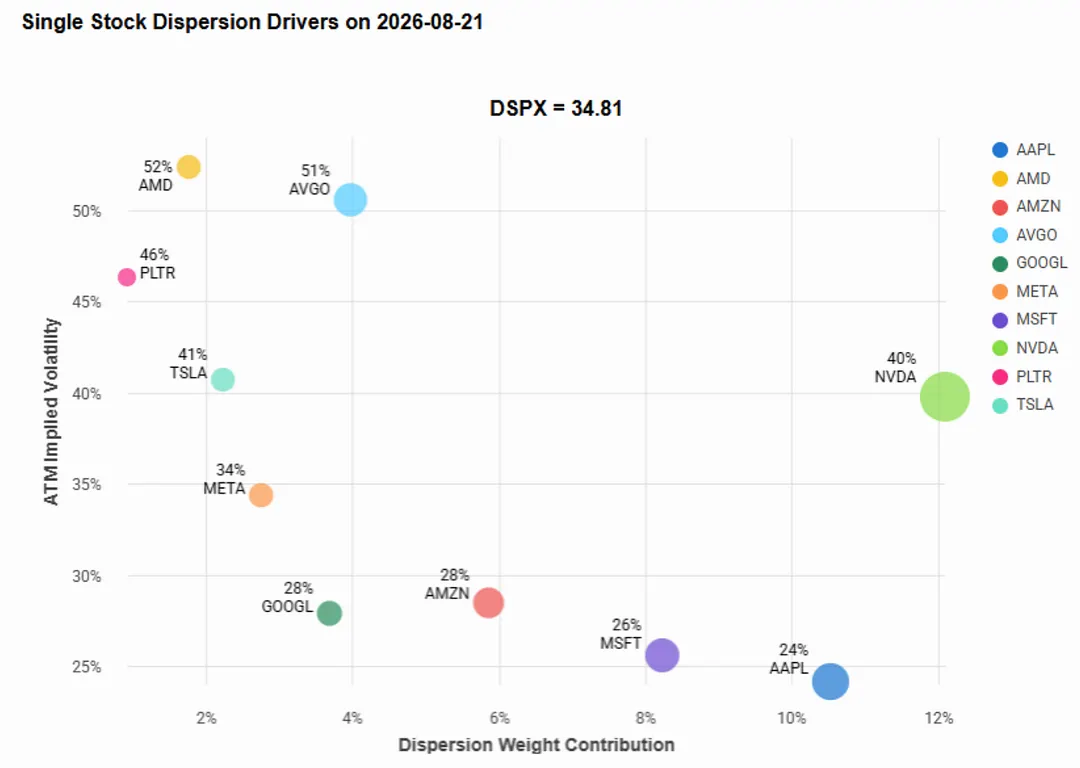
Into Wednesday's earnings, options price a 6.5-7% move with put skew leaning bearish.(cboe)
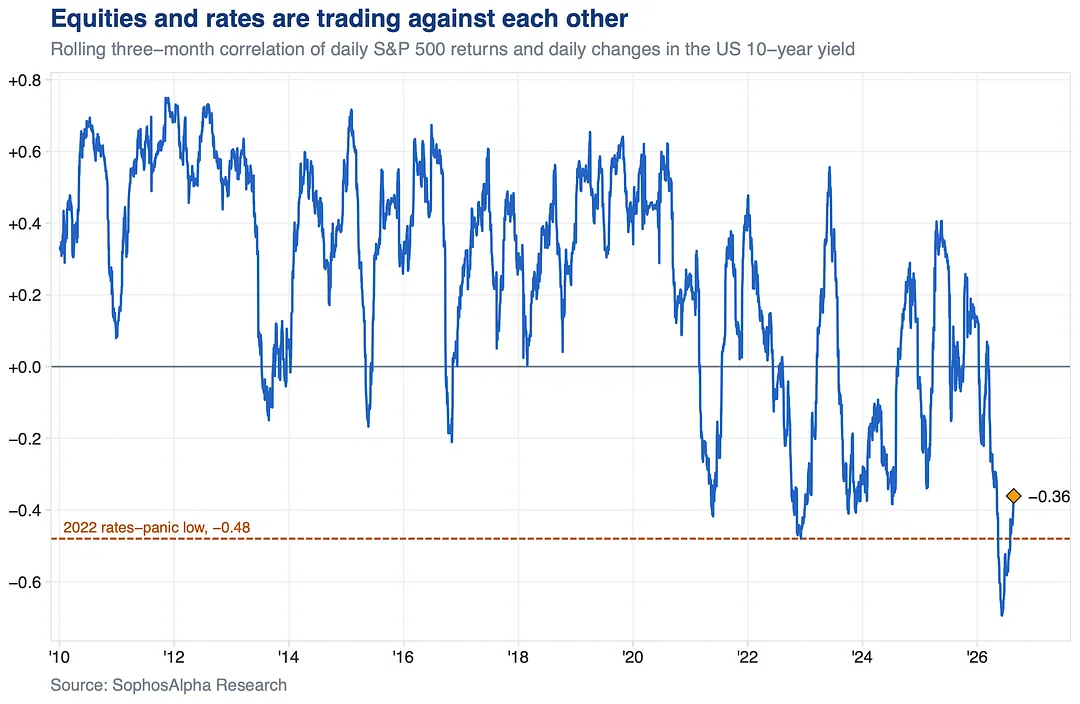
Daily moves in the S&P 500 and the 10y yield are running about as negatively correlated as they ever have. Yields tick up, stocks sell off, and back again.
That is why the tape feels so rate obsessed.
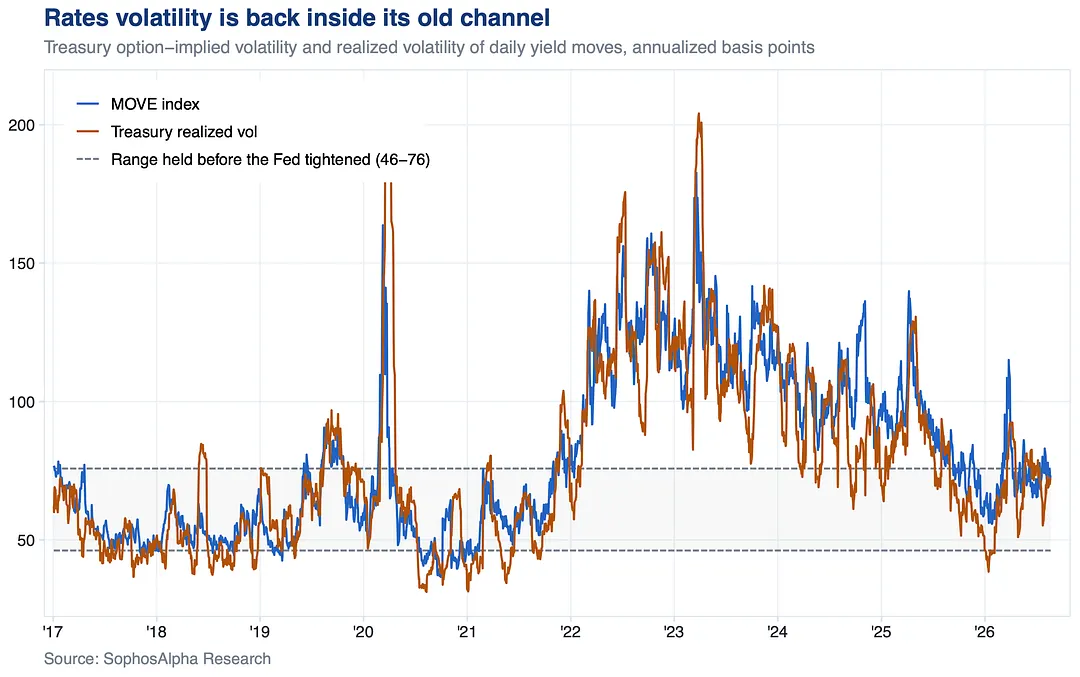
The thing that actually hurts equities is how violently they move.
Treasury volatility, both priced and delivered, has dropped back inside the range it held before the Fed began tightening.
Loud headlines, quiet rates market.
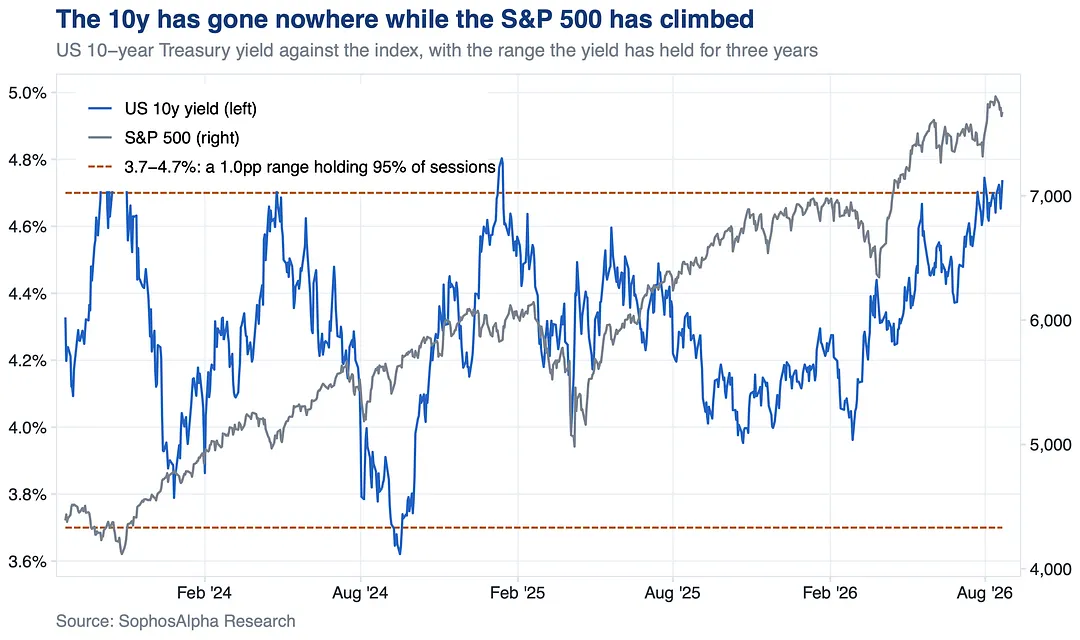
The S&P 500 is up roughly 75% over the same stretch.
Yields have spent those three years inside a band barely a point wide, and equities trended straight through it.
The level of rates was never the constraint.
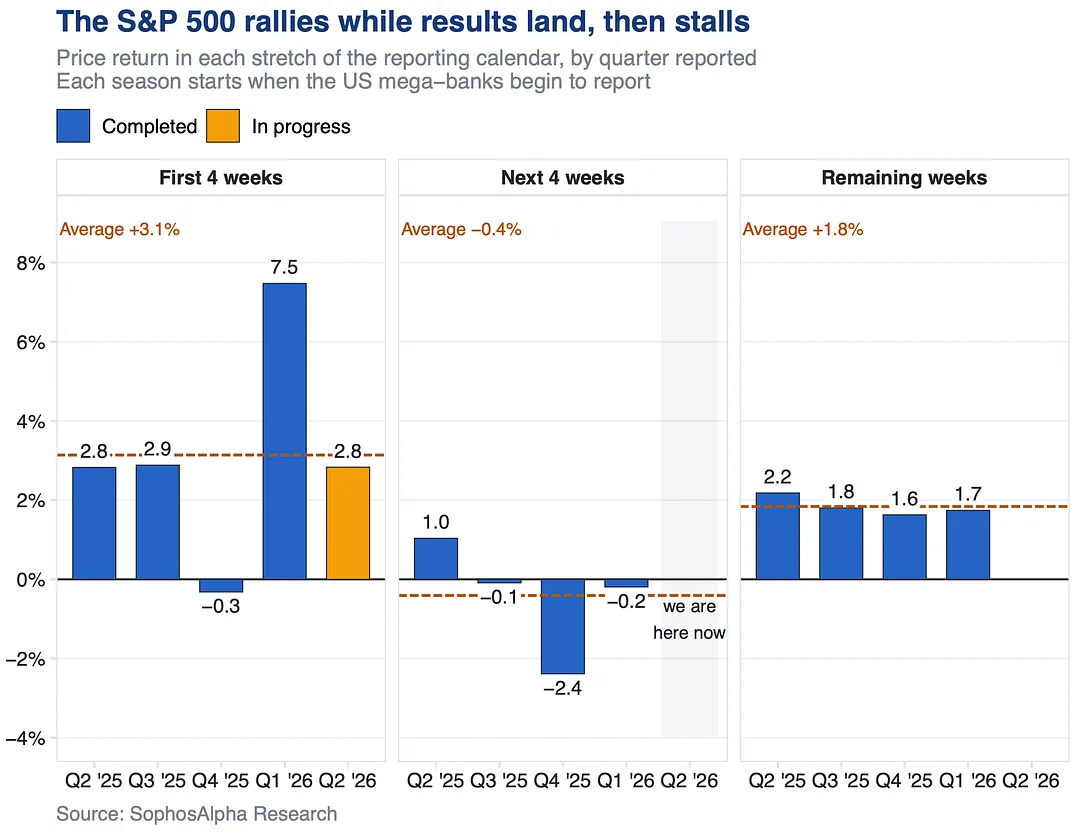
Over the last five seasons stocks rallied through the first four weeks of reports, went flat for the next four, then picked up as the following season neared.
We are in the flat stretch now.
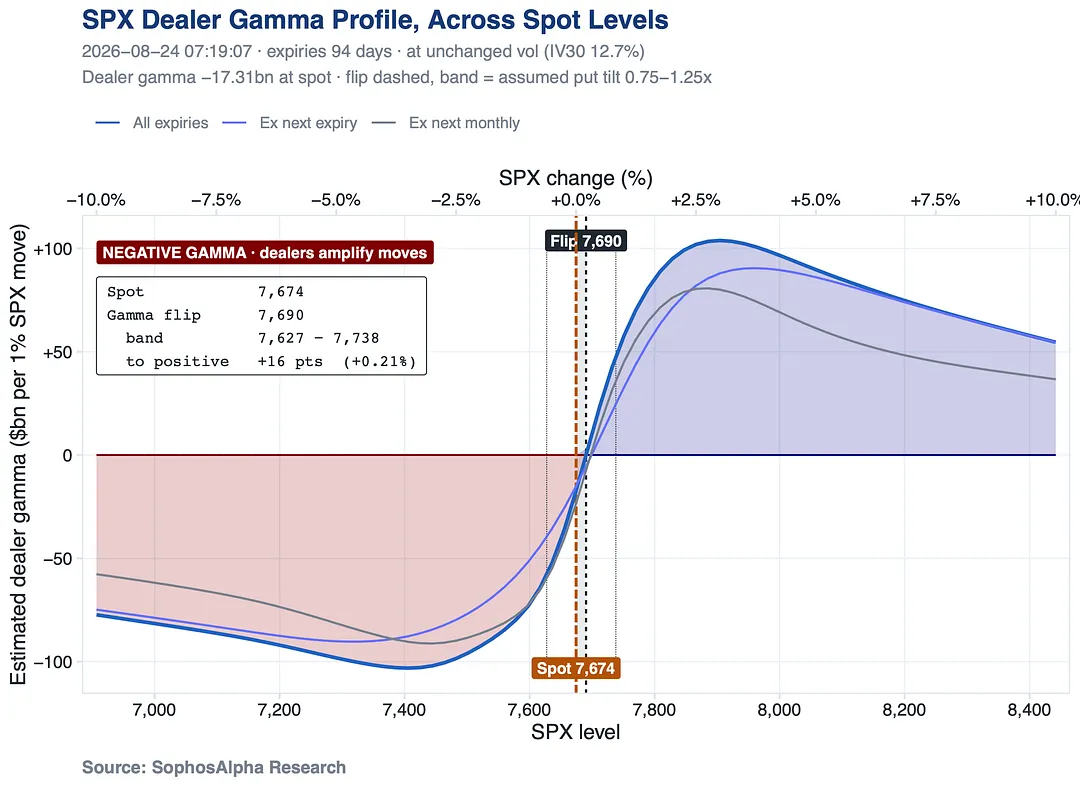
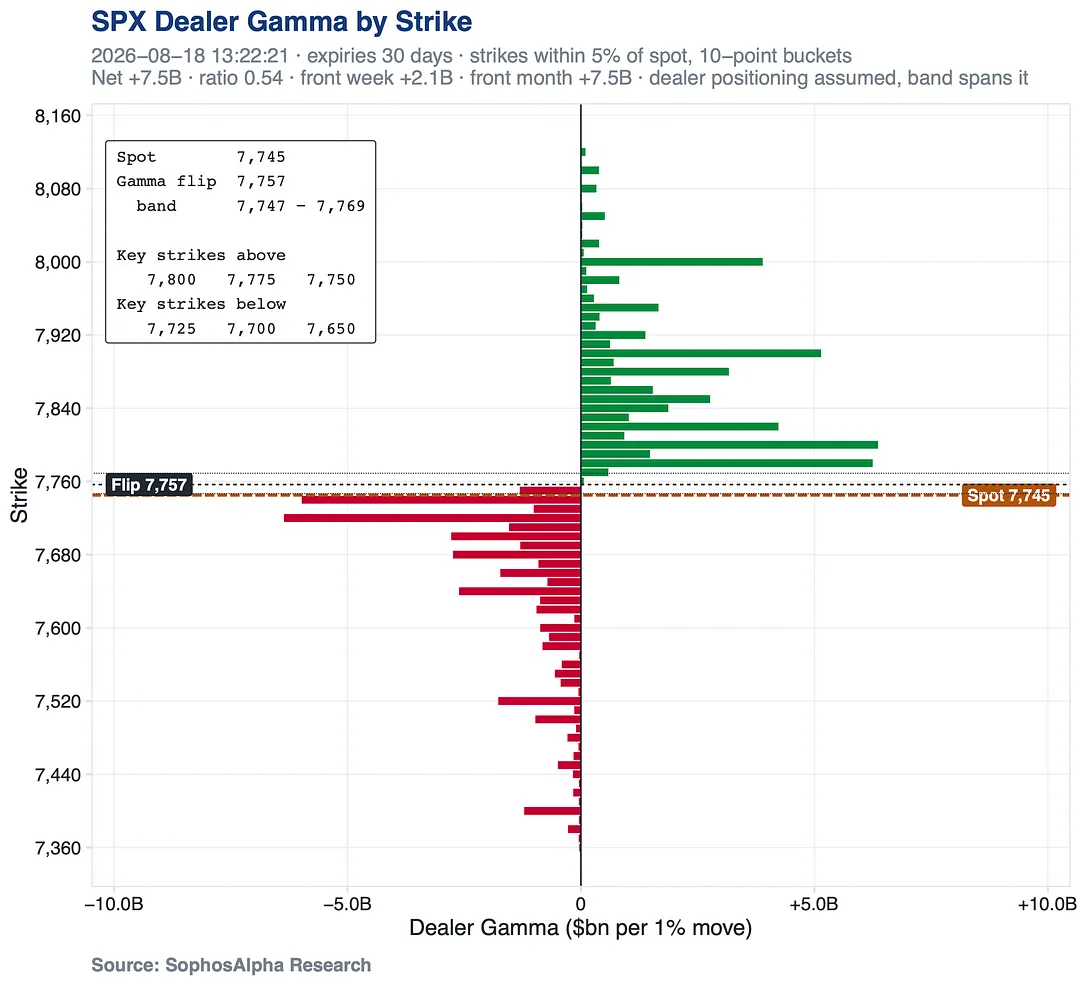
Spot is only a small stretch below the flip level, so it wouldn't take much of a rally to flip the whole regime toward stabilizing. Downside from here still amplifies.
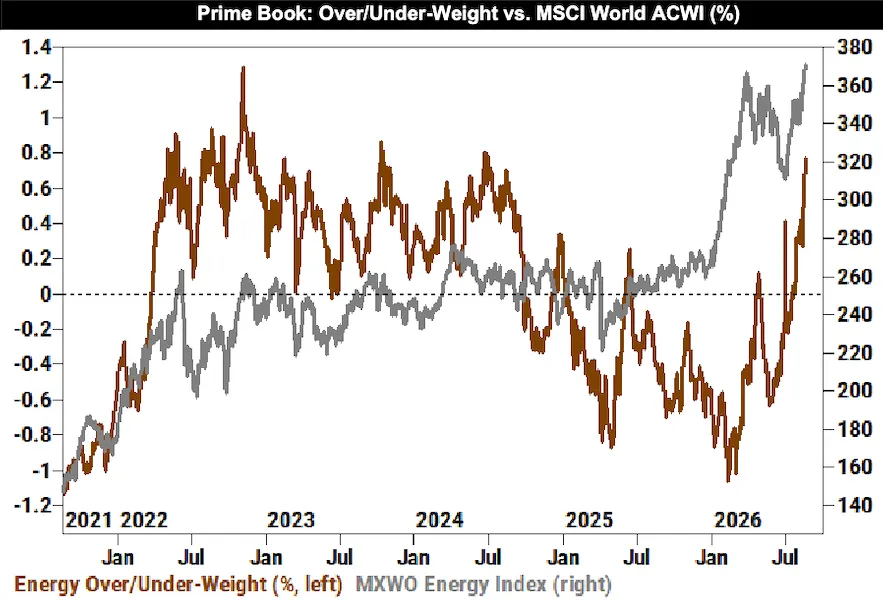
Goldman's Prime book, tracking its hedge fund clients' positioning, showed Energy was the most bought sector globally this week, the sharpest rise in exposure since 2021, driven mostly by new long buys and some short covering.
Funds are now overweight energy for the first time since mid-2024.
After years of mostly avoiding the sector, that's a real shift in conviction.
6 notes
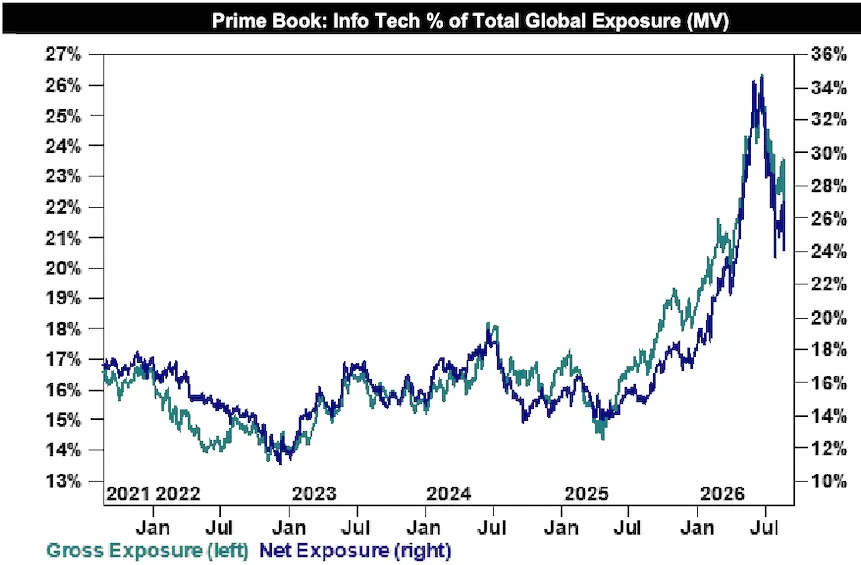
Goldman's Prime book, tracking its hedge fund clients' positioning, showed Info Tech was the most sold sector globally last week, the sharpest cut to overall tech exposure in 2+ years, almost entirely from selling existing holdings, not new bearish bets.
Even so, tech exposure remains near the top of its 5-year range. Reads as profit-taking off stretched positions, not a real exit.
Traders piled into calls on IBIT, the popular bitcoin ETF, bets that the price keeps rising, with volume hitting a record for a single day.
They also paid up more than usual for that upside, a sign of urgent, chase-y buying. Gold calls saw a similar rush as investors sought upside protection amid macro fears.
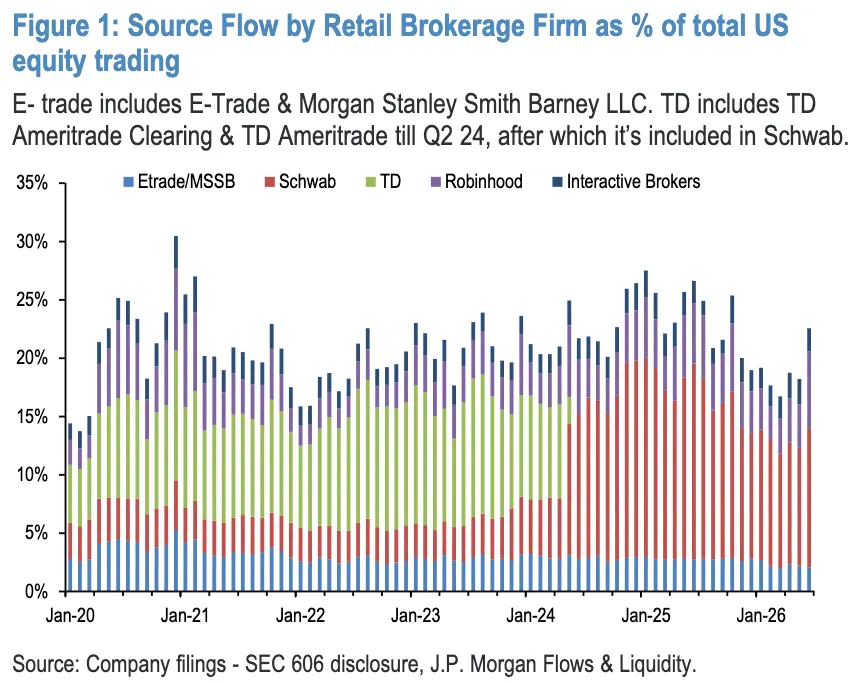
As markets began unwinding leverage in June, retail's share of US equity trading jumped, a sign investors were churning hard into stocks and leveraged ETFs right as the selling pressure built. We think that only grew through July.
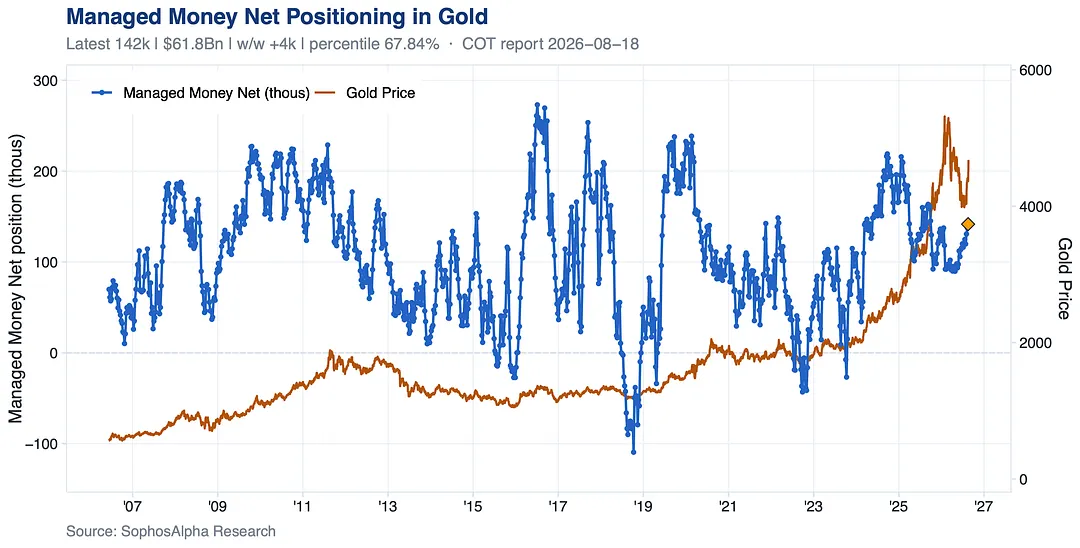
Net length is rising but still sits well inside its twenty-year range, nowhere near the crowded extremes of 2016 and 2020. Price led, positioning is following.
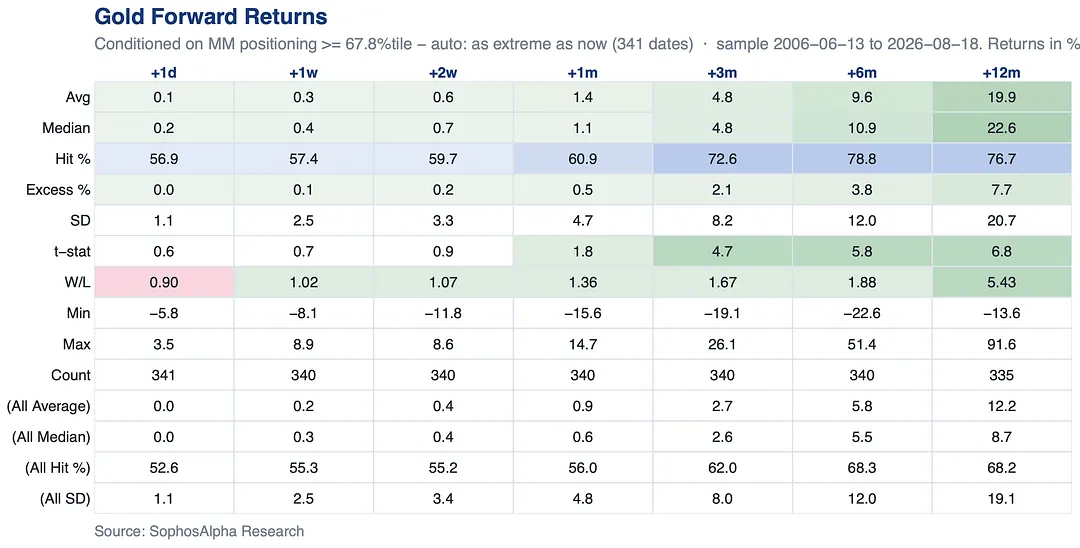
So what has this level been worth? Conditioning on every date since 2006 with speculative length at or above where it is now, forward returns beat the all-dates baseline at every horizon past a month, and the edge widens from three months out.
Not a warning sign. A tailwind with room left to run.
It fits a broader pattern this quarter, hedge funds and mutual funds are largely on the same page across most sectors.
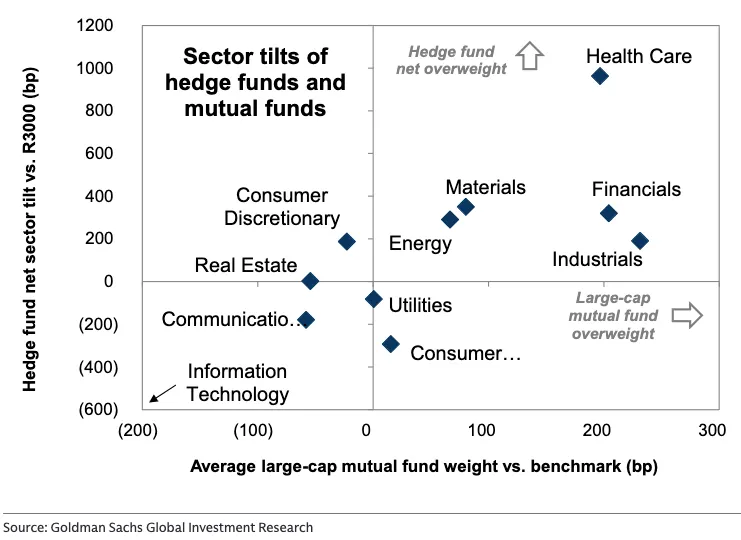
They're now buyers.
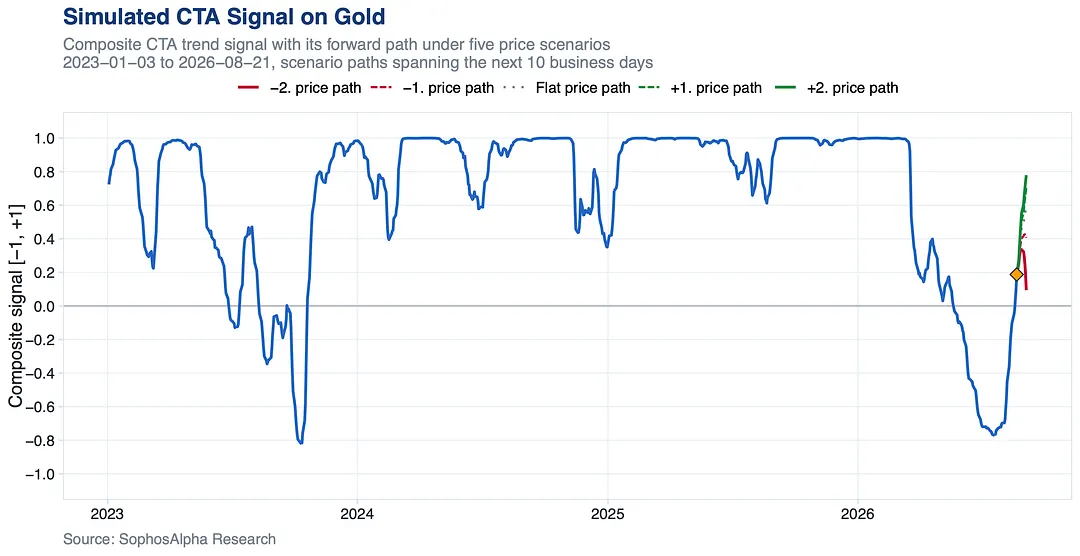
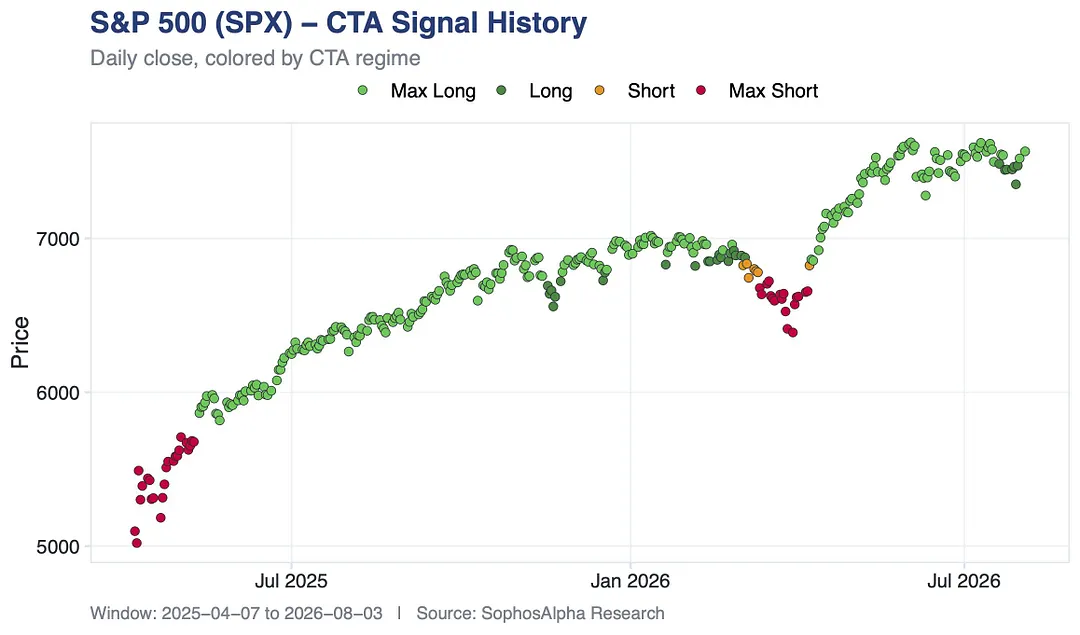
Our composite CTA signal flipped from deeply negative to positive, and the forward paths show it keeps adding length under almost every price scenario over the next two weeks. Only a sharp selloff stalls the rebuild.
one note
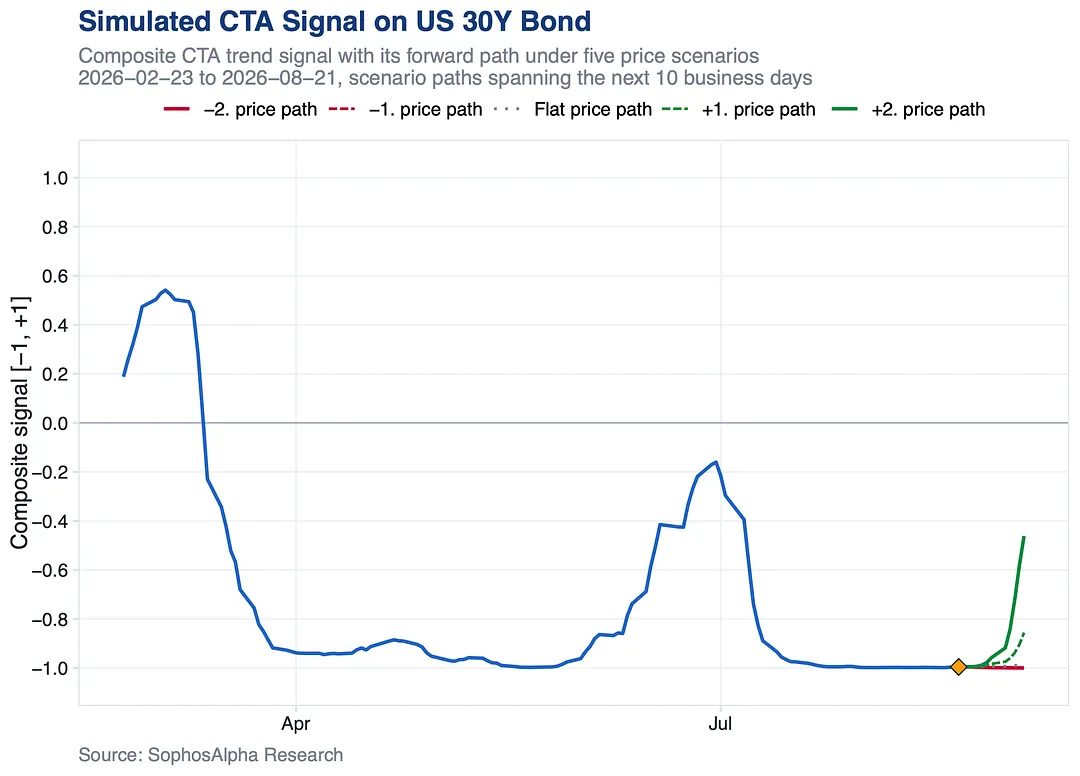
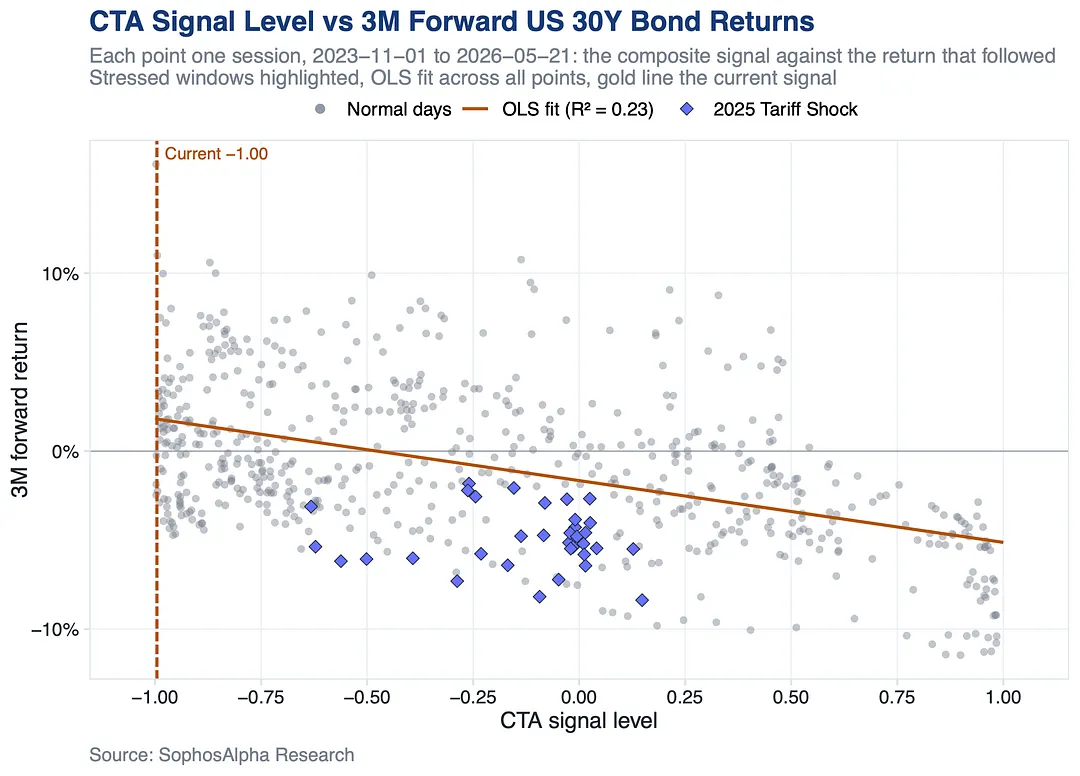
Trend following funds (CTAs) were already max short 30Y Treasuries, signals negative for months.
Our base case is neutral flows: more downside brings no new CTA selling, while a sharp rally forces heavy covering in two weeks.
History leans the same way. From readings this stretched, 30Y Treasuries averaged modestly positive returns over the following quarter. The worst outcomes came after the crowd was max long, not max short.
5 notes
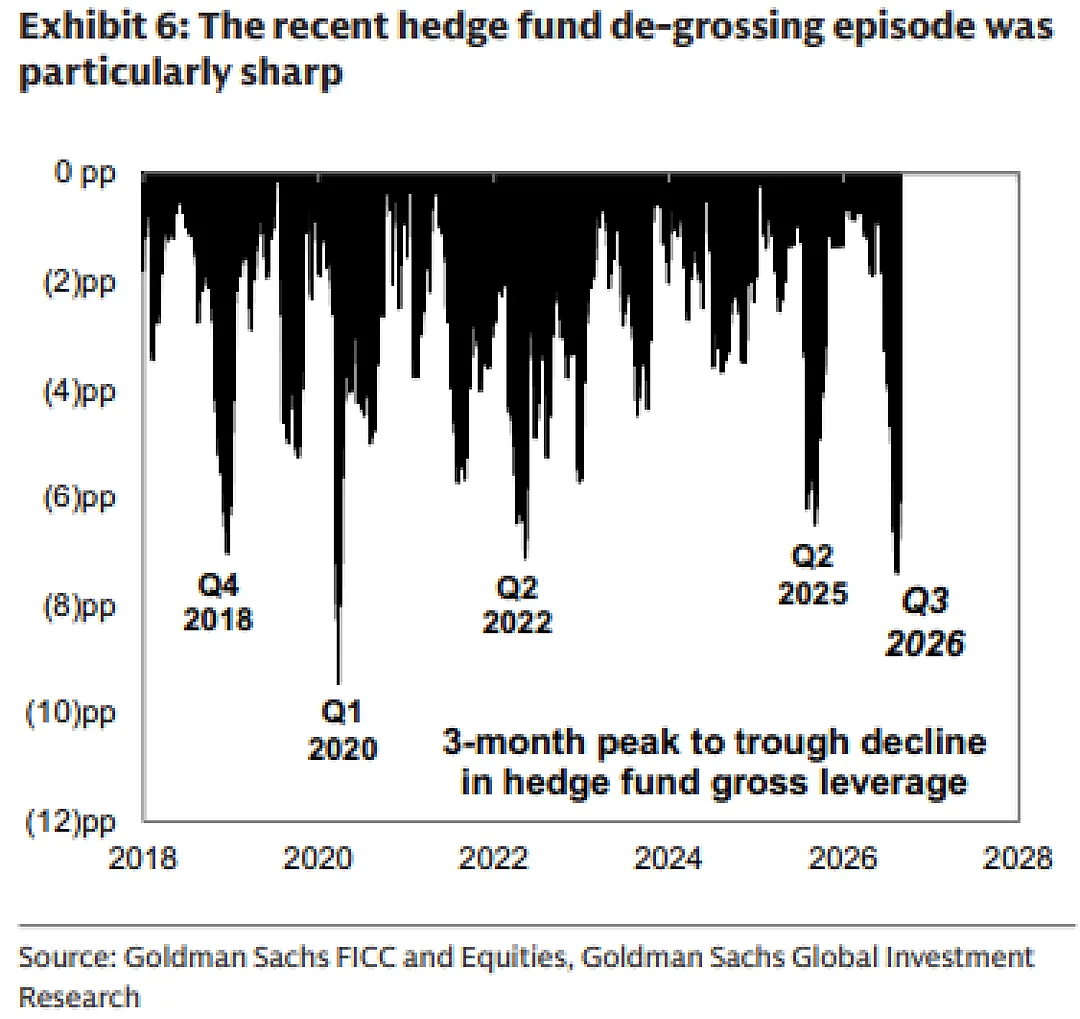
But this started from record gross leverage in Q2, so even after cutting hard, exposure is still elevated versus history. Violent unwind, still long.
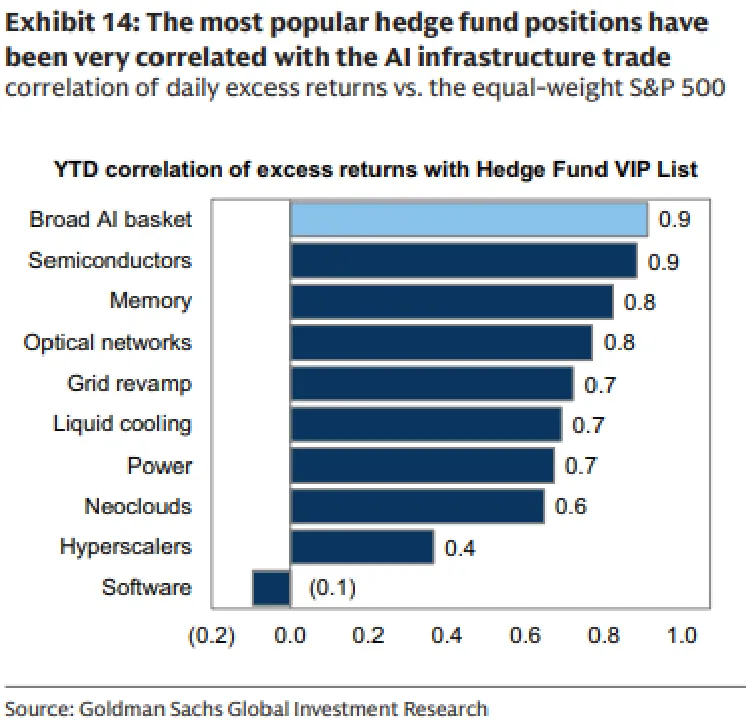
YTD, the most crowded HF longs have moved almost in lockstep with semis, memory, optical networks and power. Software is the one theme with basically no relationship. One trade, many tickers.
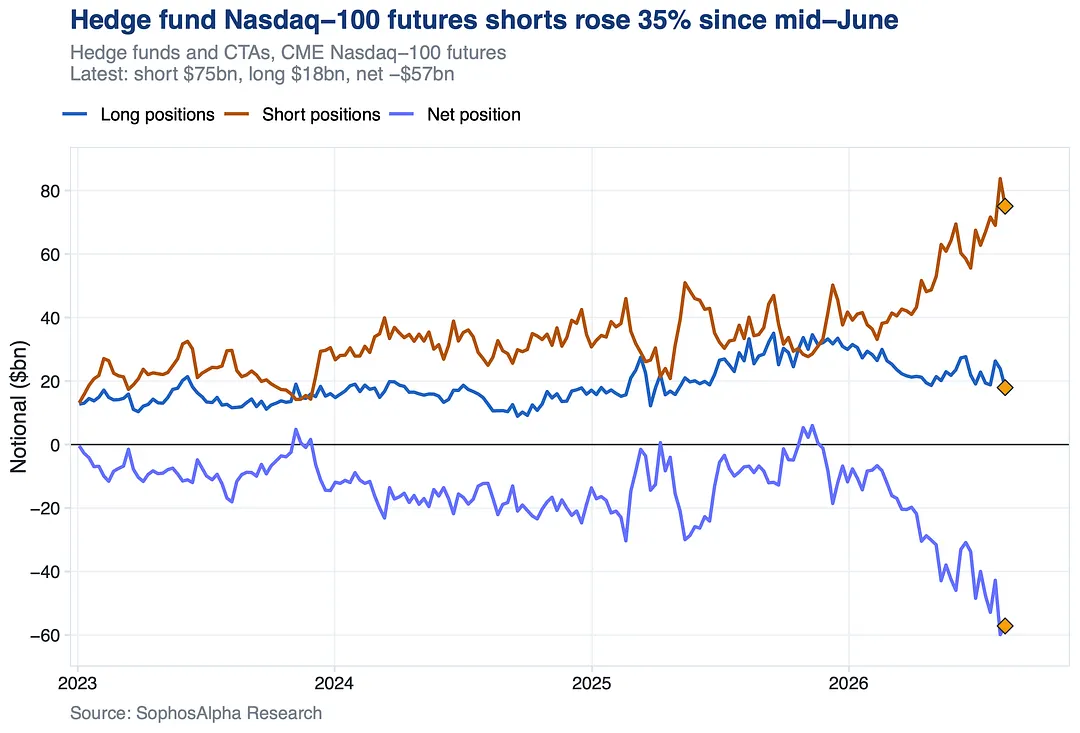
Net short $57bn, near the largest on record. The shorts kept growing even as funds cut leverage everywhere else.
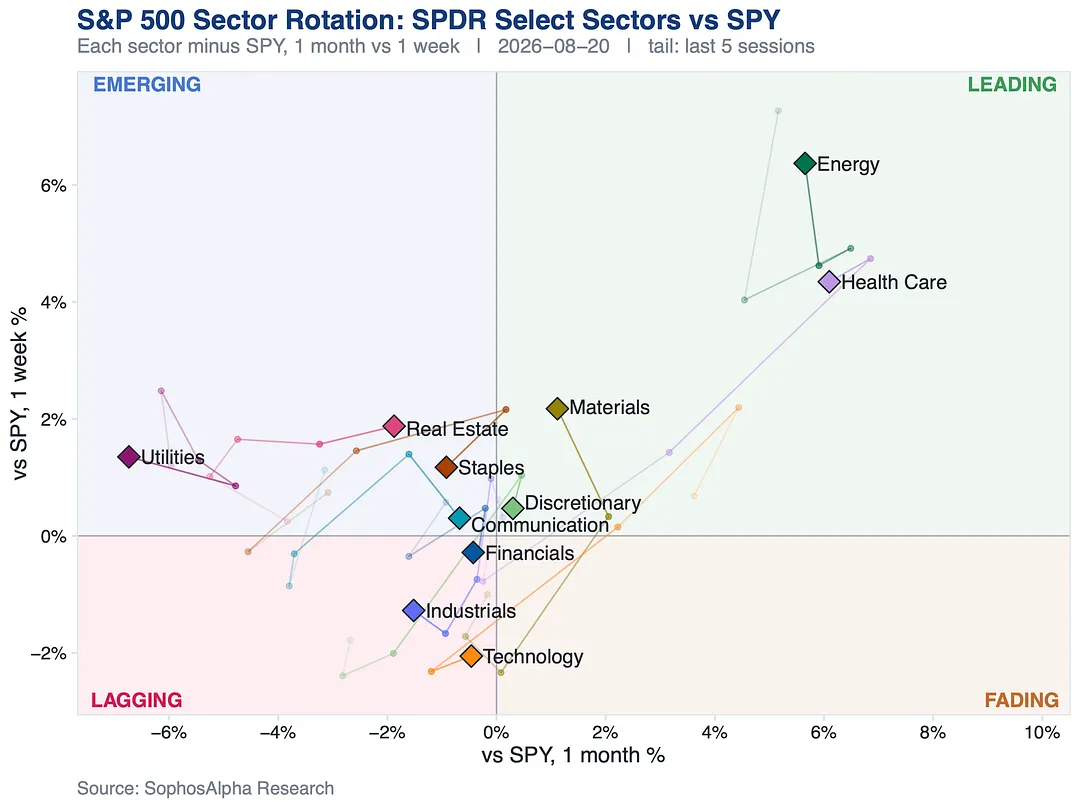
Energy and Health Care have pulled clear of SPY on both the 1-month and 1-week view.
Tech has slid from leading straight into lagging.
Hormuz supply risk and AI capex fatigue, in one picture.
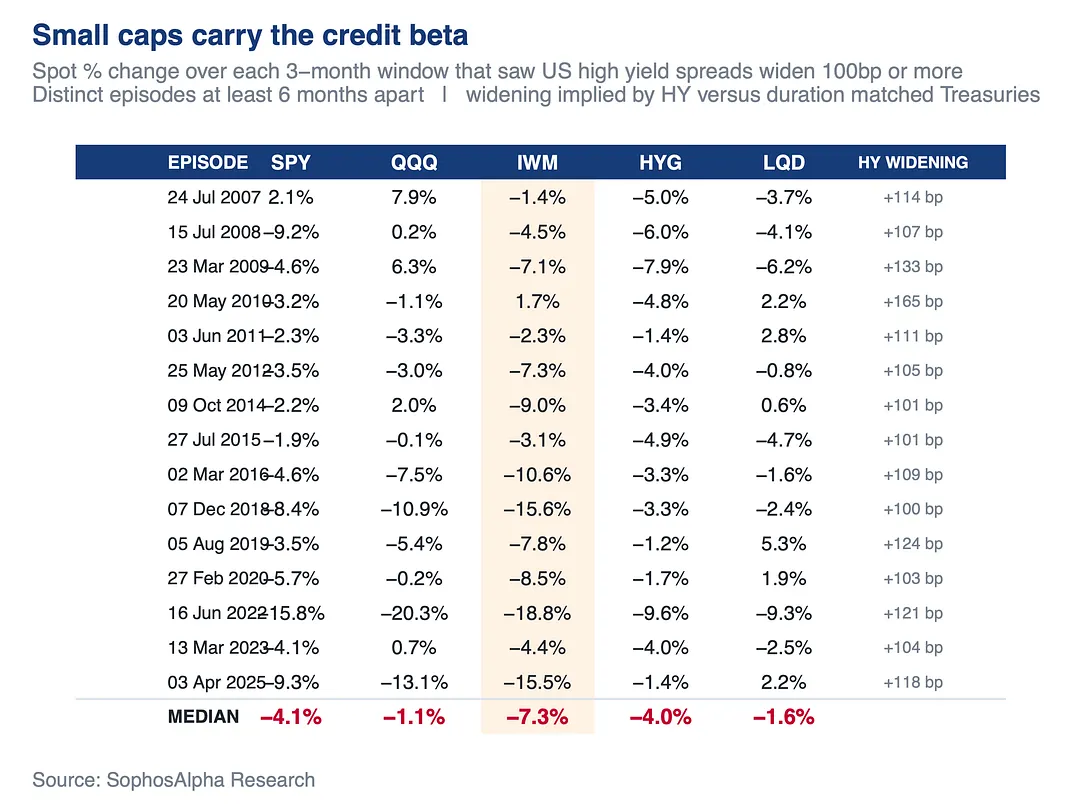
Every time high yield spreads have gapped wider over the past two decades, small caps took close to double the pain of the S&P.
The Russell is where the leverage sits. Spreads are quiet right now, which is exactly when that hedge is cheap.
4 notes
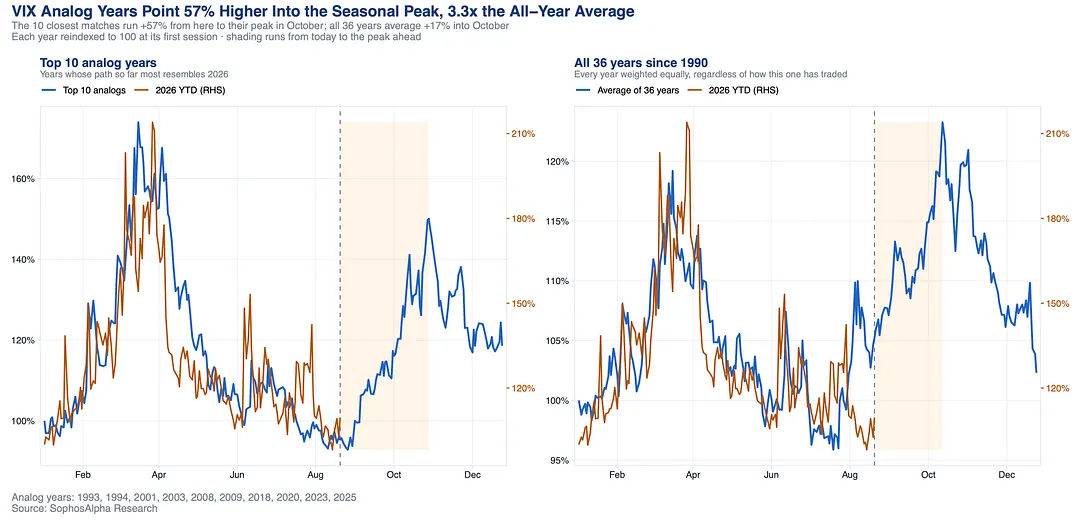
The 10 years that traded most like 2026 ran +57% from here into late October. All 36 years since 1990 average +17%.
The blend cancels out exactly the years worth looking at.
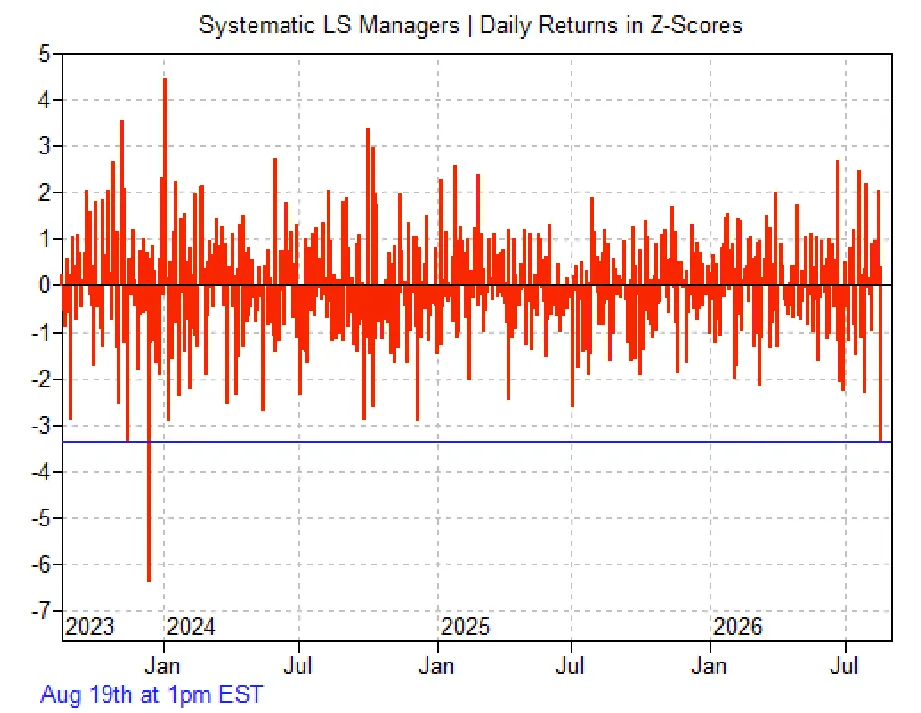
Momentum alone cost 60bps, losses hit every region. Fundamental L/S funds fell just 0.7%, a systematic factor unwind, not a stock picking one.
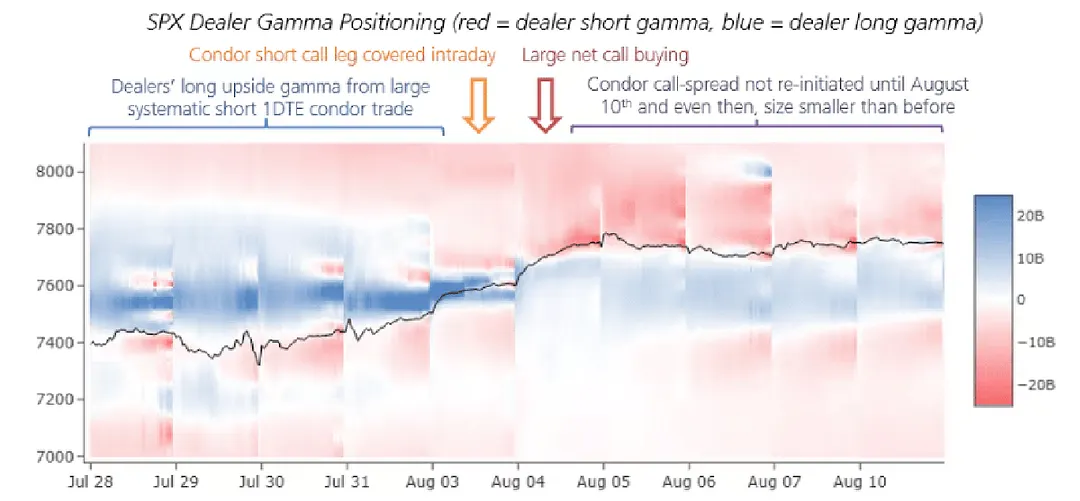
Dealers were long gamma into early August behind a large short-dated condor seller. Once that seller's call leg got covered and call buying surged, dealers went short gamma, and stayed there.
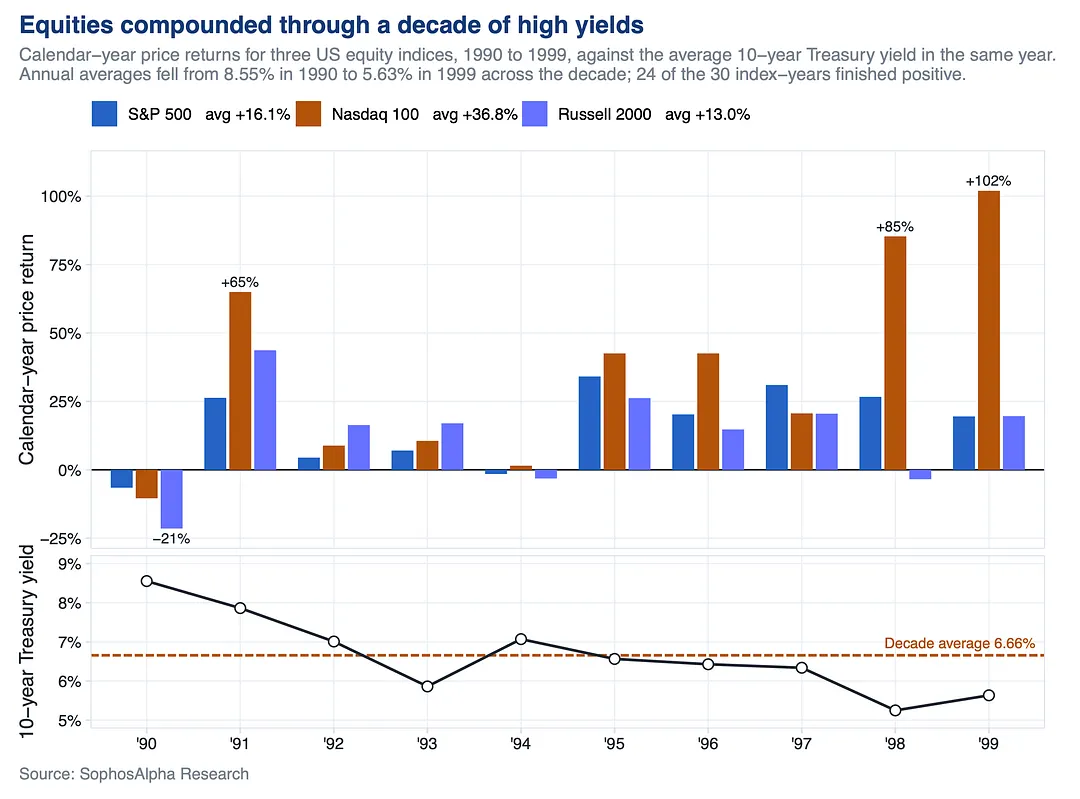
The 10 year sat well above today's level for the whole of the 1990s, and it was one of the best decades US stocks have ever had.
What moved markets was the direction yields were travelling, not the level.
5 notes
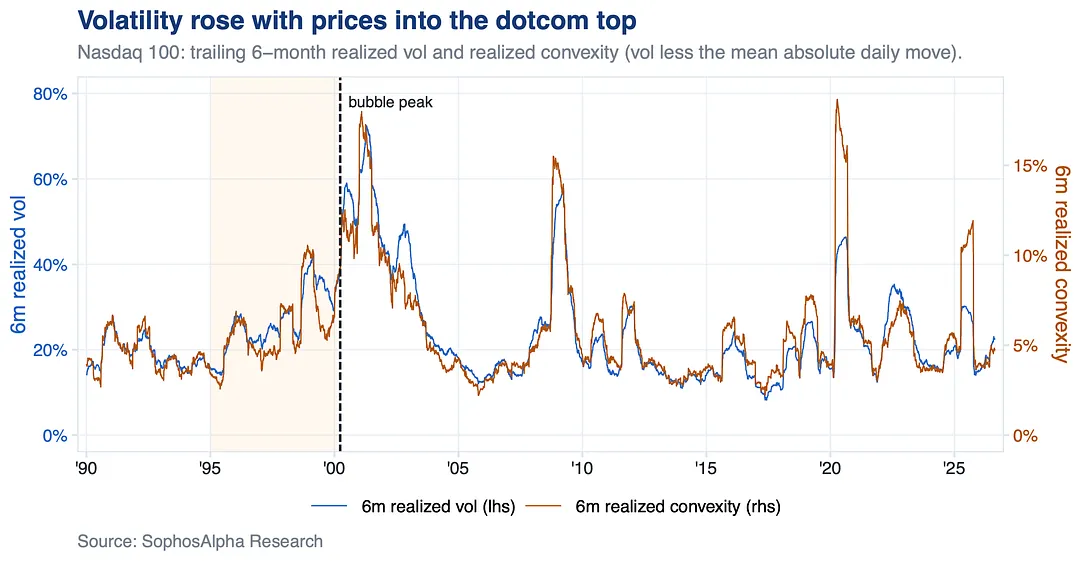
It was that volatility kept rising while prices kept rising. That pairing is rare, and it is what a late stage melt up looks like from the inside.
Most people read rising vol in a rally as noise.
In 1999 it was the tell.
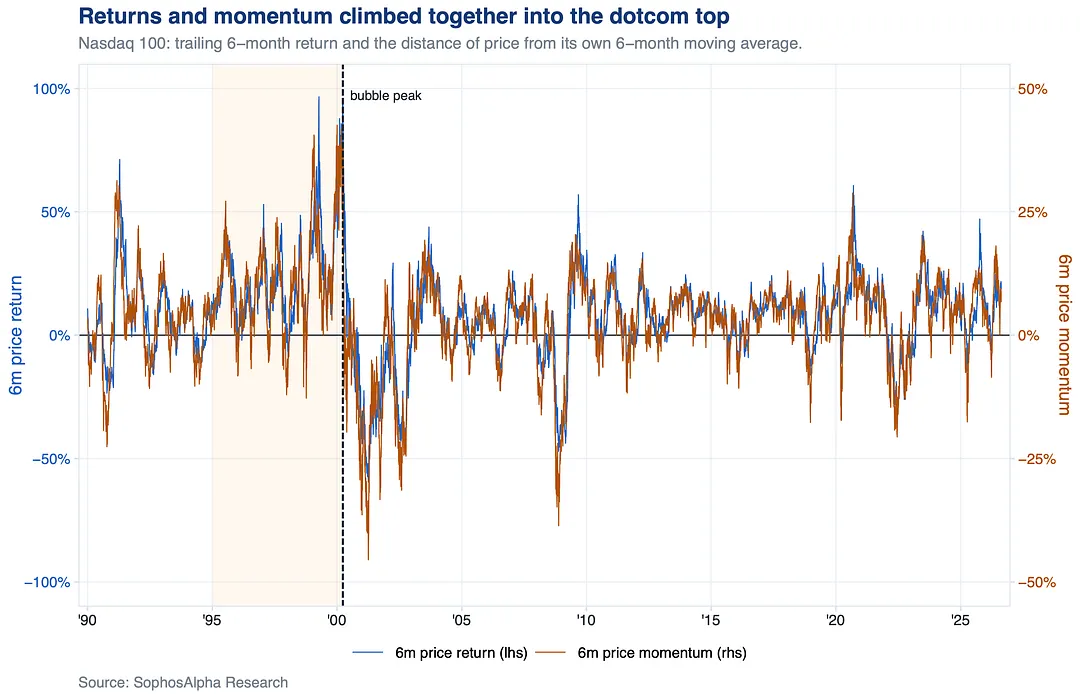
Into the March 2000 Nasdaq peak, returns and momentum both ran at levels that appear in no other stretch of the last 36 years. Not before it, not since.
Today sits nowhere near that. Still worth knowing what a real top looked like.
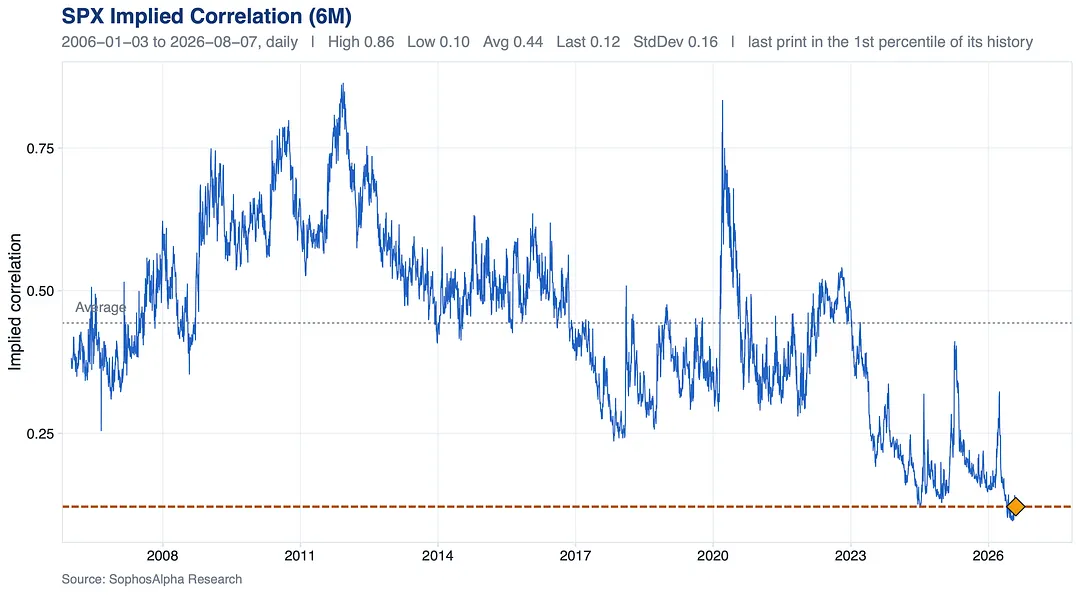
That is last year's story. Correlation has been scraping the floor for most of this year with almost nowhere left to fall. The latest leg down came from single stock vol instead. That one has far more room to snap back.
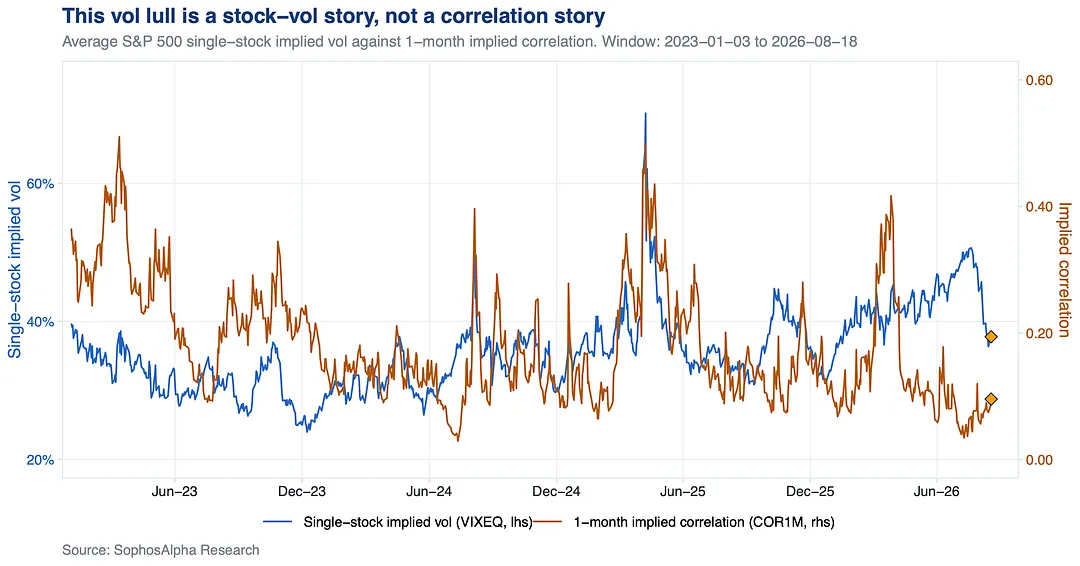
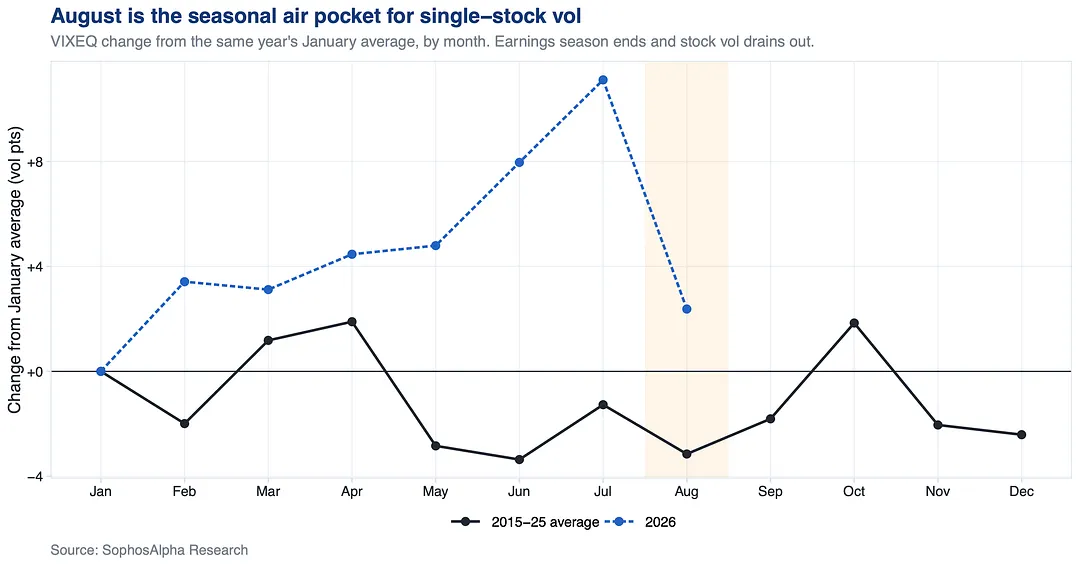
August is one of the two quietest months of the year, every year, as earnings clear and catalysts thin out. It has drained on schedule again. The part worth knowing is what the calendar tends to do next.
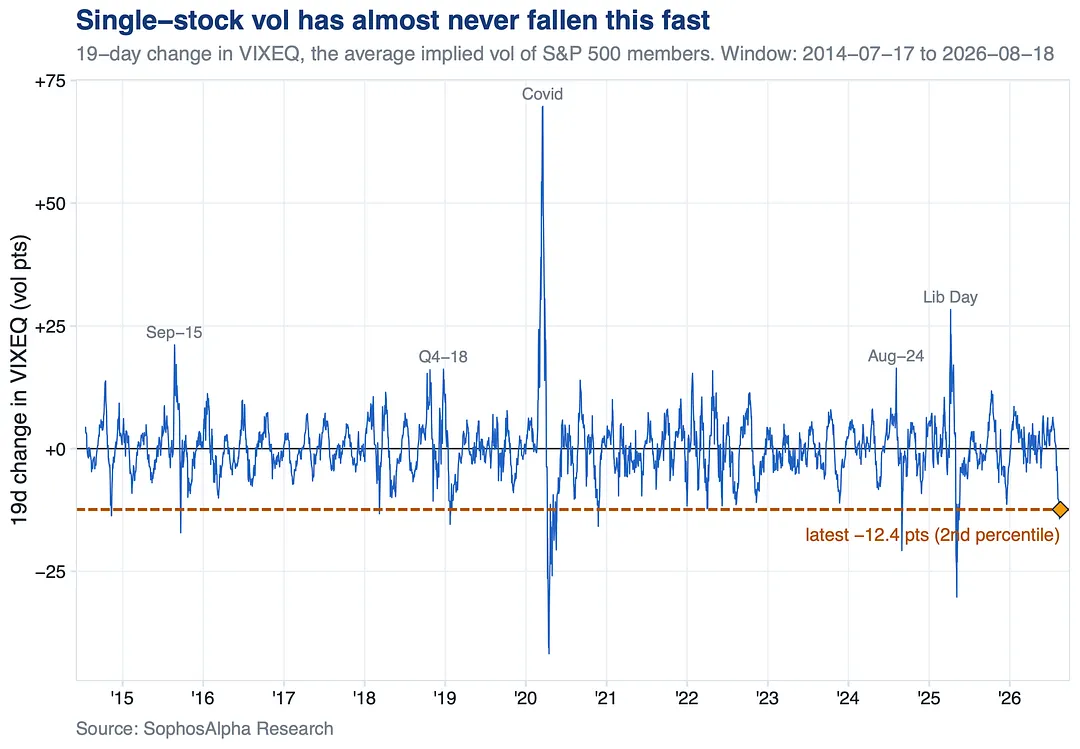
Covid. The yen unwind. Tariff day.
Every one of those had a panic to unwind first. This time there was no panic. Vol is draining out of a calm tape, which is a very different setup.
3 notes
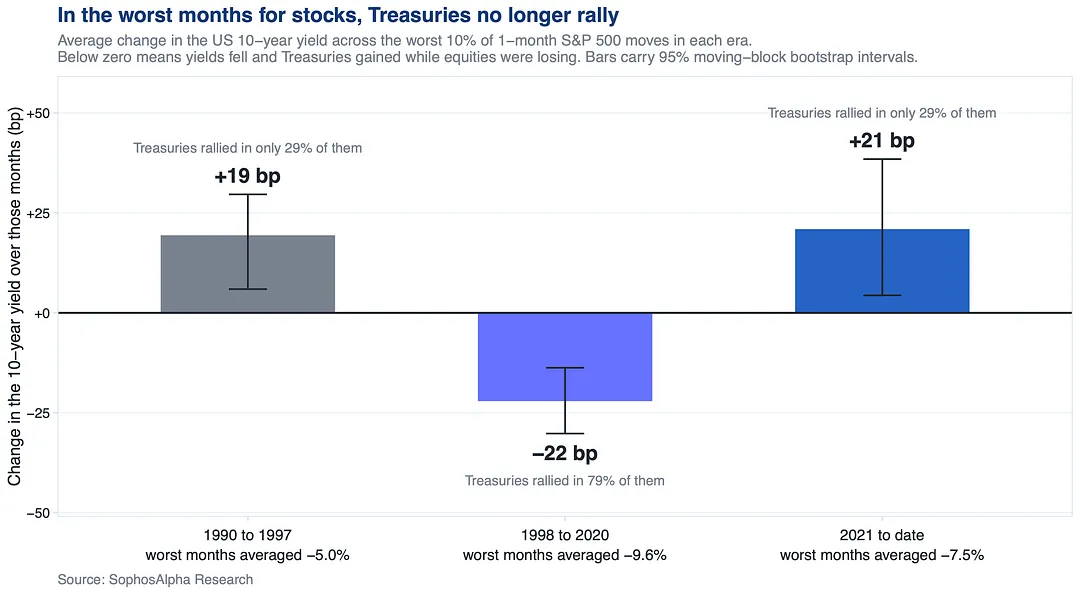
That was the cushion behind 60/40. Since 2021, yields have risen in those same months instead.
The bond sleeve stopped absorbing equity drawdowns, before any rate shock.
SPX 7,745 sits under the 7,757 flip, and front week holds only +2.1B of the +7.5B book.
Little to absorb a move this session. Reclaiming 7,757 flips hedging back to damping. Below, 7,725 then 7,700.
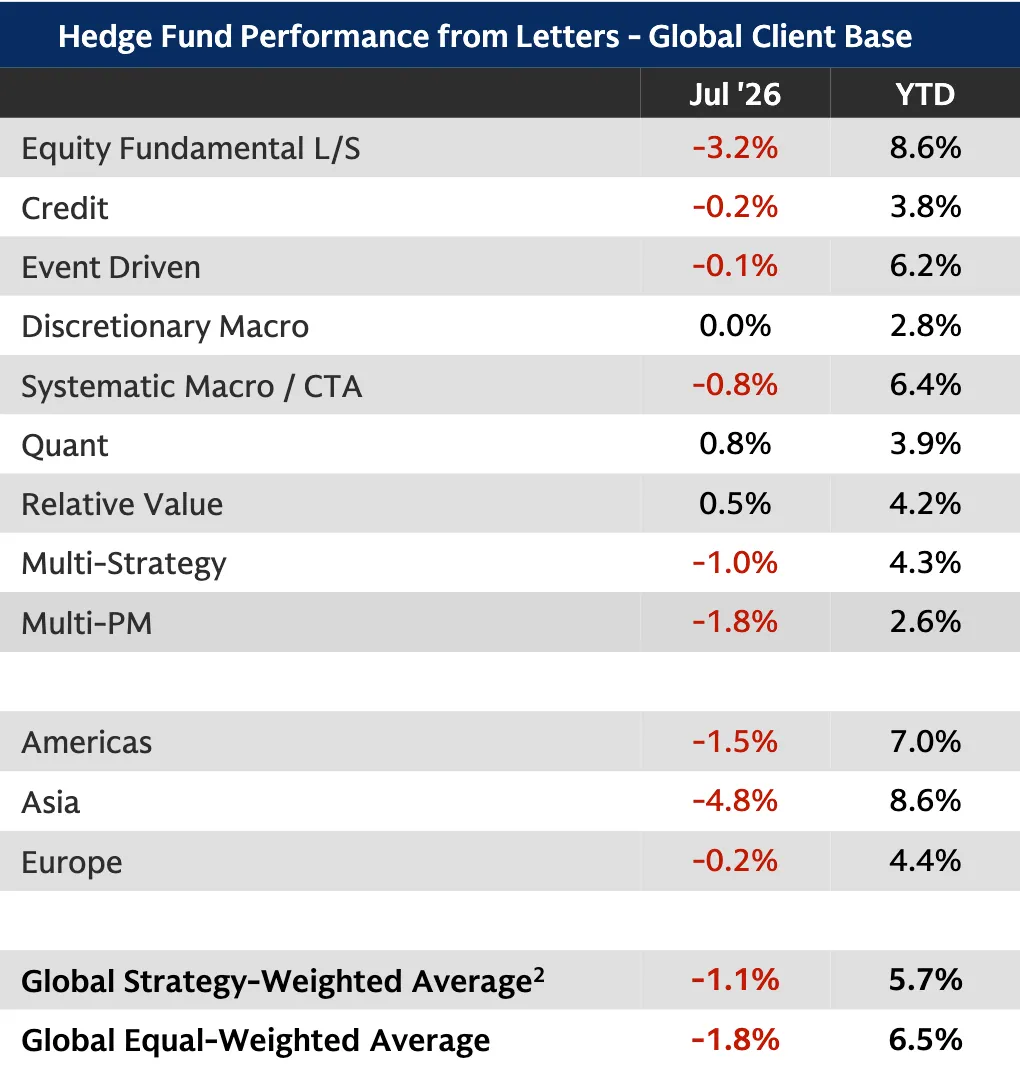
Reality check: some of the most sophisticated multi-billion dollar hedge funds on the planet, running teams of PhDs and decades of risk infrastructure, just posted a losing month.
A violent unwind in crowded AI and momentum trades caught fundamental long/short managers leaning the wrong way, their worst stretch in years. Quant strategies were the rare bright spot, benefiting from the very dislocation everyone else got hurt by.
If the pros can get run over, so can you. Position accordingly.
2 notes
Deeper liquidity means less price impact per trade, tighter spreads, and more room to trade size without moving the tape, a stabilizing backdrop after a thin, jumpy July.
For now that flow is still absorbing moves, which is why pullbacks keep getting bought. It does not take much to lose it.
one note
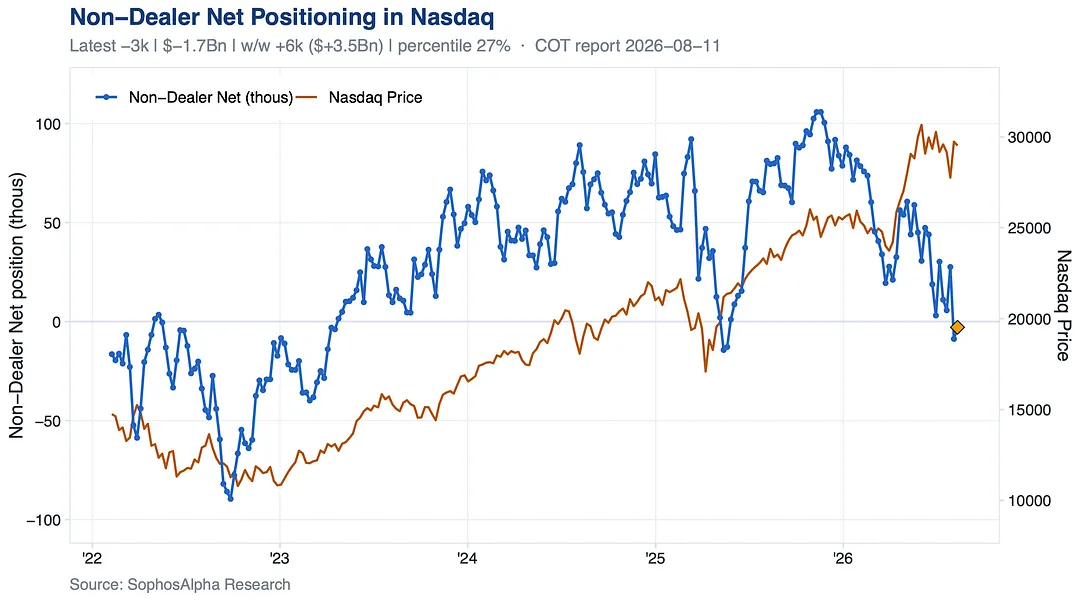
New shorts drove the initial move, but the flow has since reversed: short covering dominated in the days right after, followed by a more substantial build in fresh length as the market kept grinding higher.
That shift has also shown up in funding, with Nasdaq’s three-month basis richening consistently on both an outright and relative basis since positioning bottomed, consistent with real length being added into the rally rather than shorts simply being squeezed out.
one note
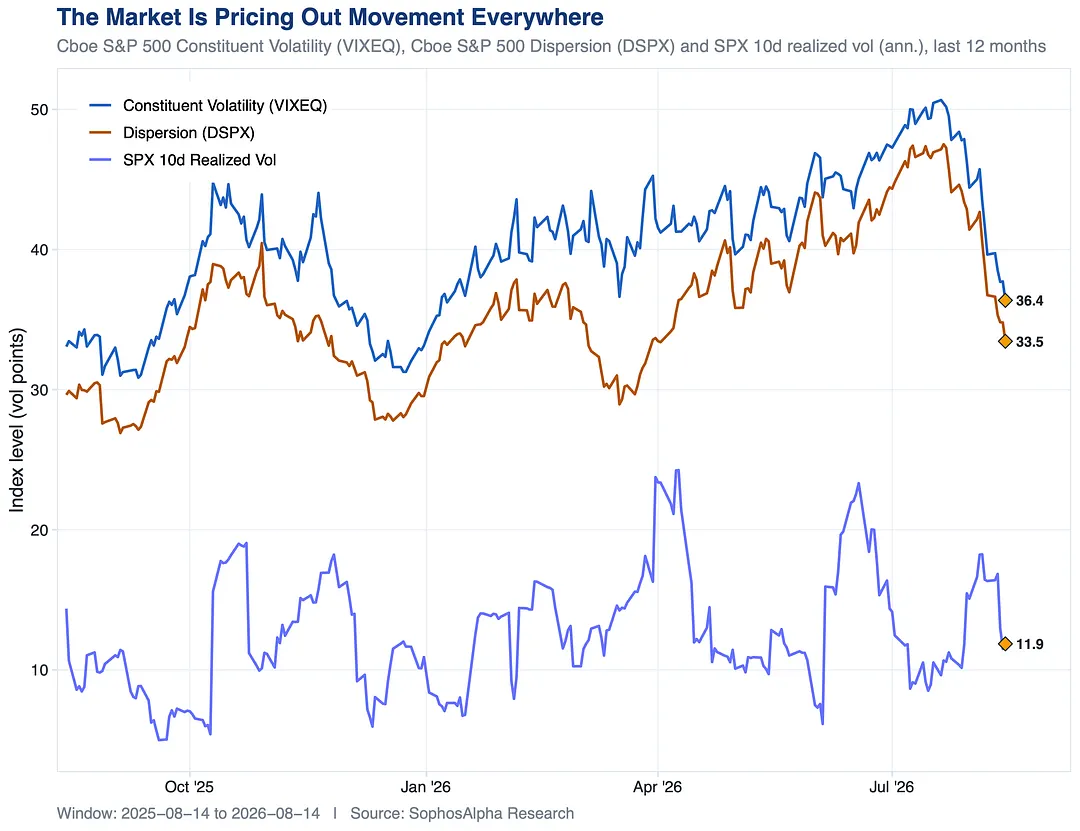
Short dated SPX realized vol sits pinned near the floor, held down by heavy dealer gamma, a quiet macro calendar and persistent intraday mean reversion.
That has bled into everything priced off it: single stock optionality has been aggressively reset, with VIXEQ down 14 points from its late July peak, and dispersion has suffered alongside it.
Long single stock vol keeps getting hit, short index vol keeps collecting, and index vol still struggles to realize in a tape that finally feels like summer.
7 notes
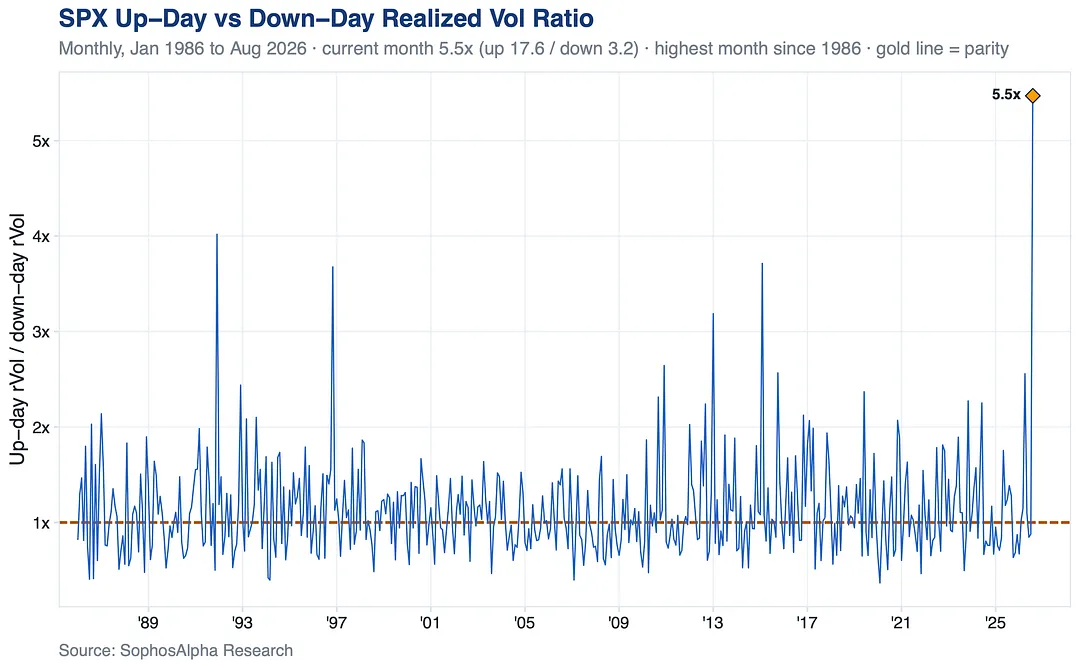
Spot Up, Vol Up. This tape is not moving on fear, it is moving on chase.
Big daily swings at record highs now mean squeeze, not stress.
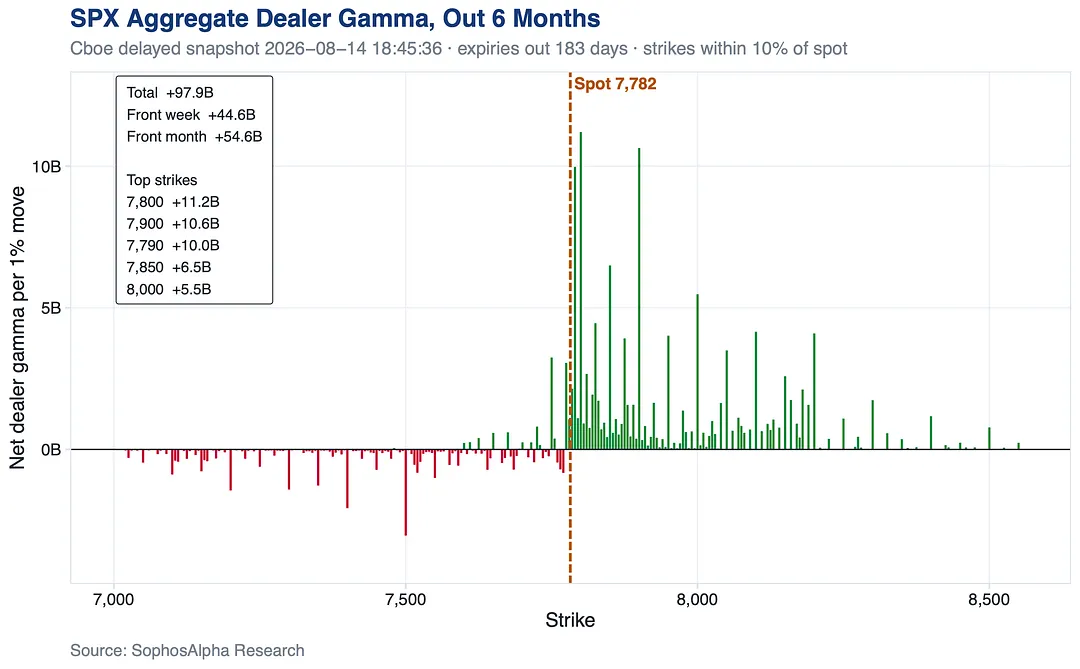
The listed book is stacked just above spot: 7,800 and 7,900 are the two biggest walls on the board, both call gamma.
Concentrated, expiring fast, and pins form at levels like these.
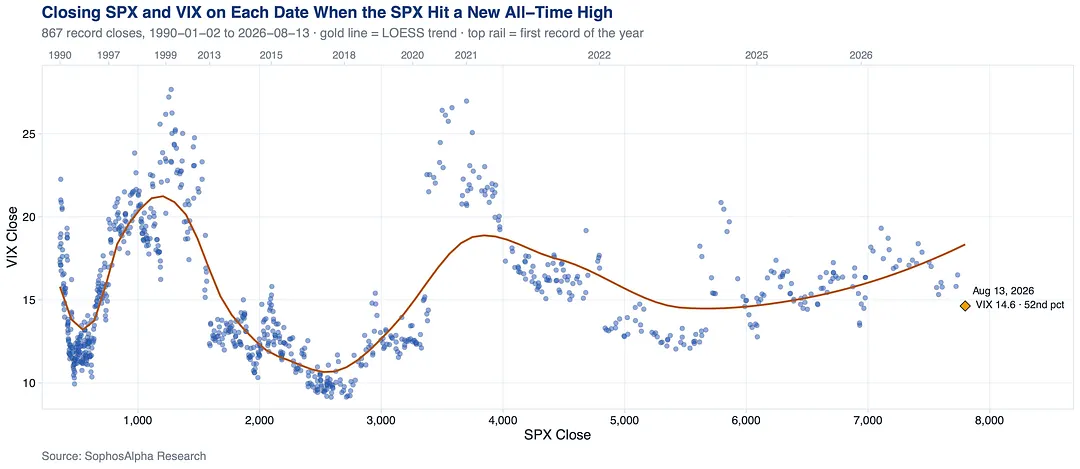
SPX record closes from 2013 to 2019 came with a median VIX of 12.3. Only 2% printed above 15.
Since 2021, 71% have. This year's records land near 17.
Today's 14.6 reads calm. In 2018 it would have been an outlier.
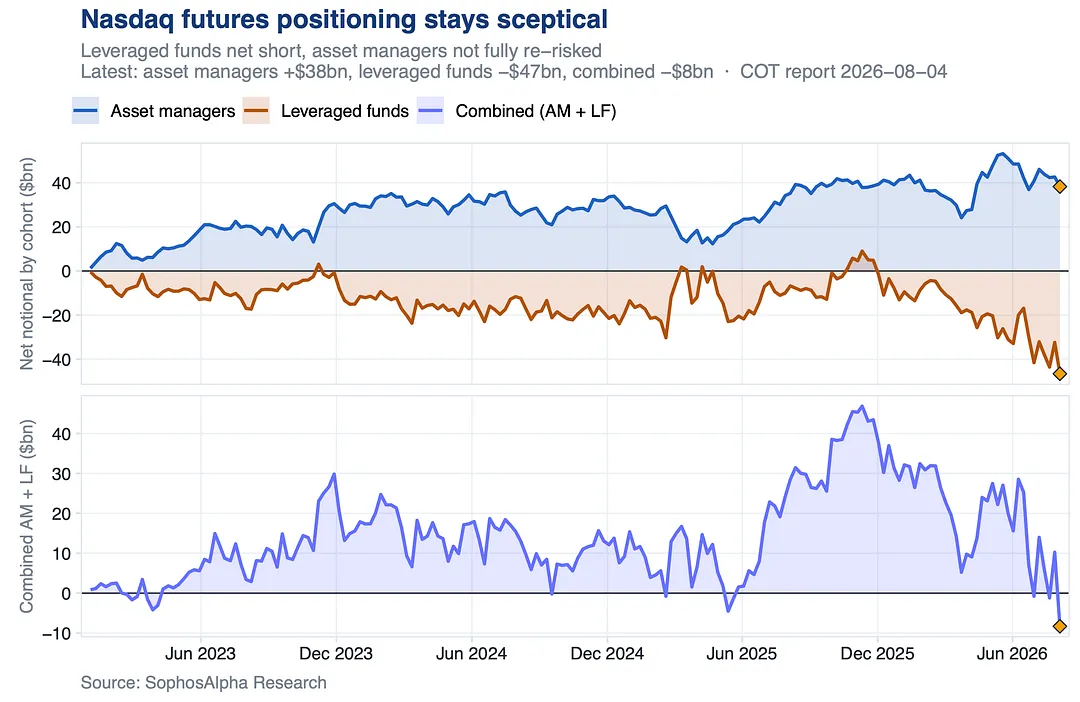
Asset managers sit well below their May peak. Yet the index has rallied back near its high, with both cohorts leaning the other way.
The detail worth sitting with is what happens when you net the two together. Leveraged funds have added roughly $20bn of short since mid-May, pushing the net position to its deepest point in the sample on both measures. That is not a record manufactured by a higher index level. Asset managers have moved the other way, cutting about 28% off their May peak, though they remain net long and still sit in the upper fifth of their three-year range. They are less long, not bearish.
Combine the two and the speculative book is net short. That has happened before in this sample, but only in single weeks, and never by more than about $4bn. The current reading is roughly double the deepest prior instance, arriving after a $19bn swing in one week.
The Nasdaq has recovered to within a couple of percent of its record, with the two largest speculative cohorts positioned against it, in aggregate, by the widest margin in the data. Whoever is buying this rally, it is not showing up here.
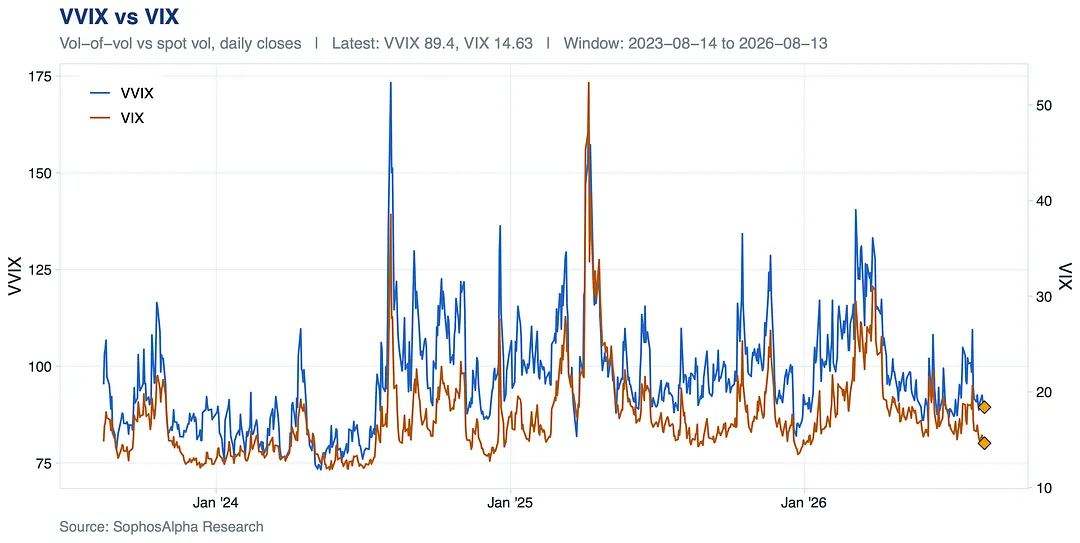
Spot vol sits at 14.6, but vol-of-vol keeps perking up, and the gap between the two is running above its long-run norm. Nothing huge yet, but VVIX has a habit of moving before VIX does. Worth watching closely here.
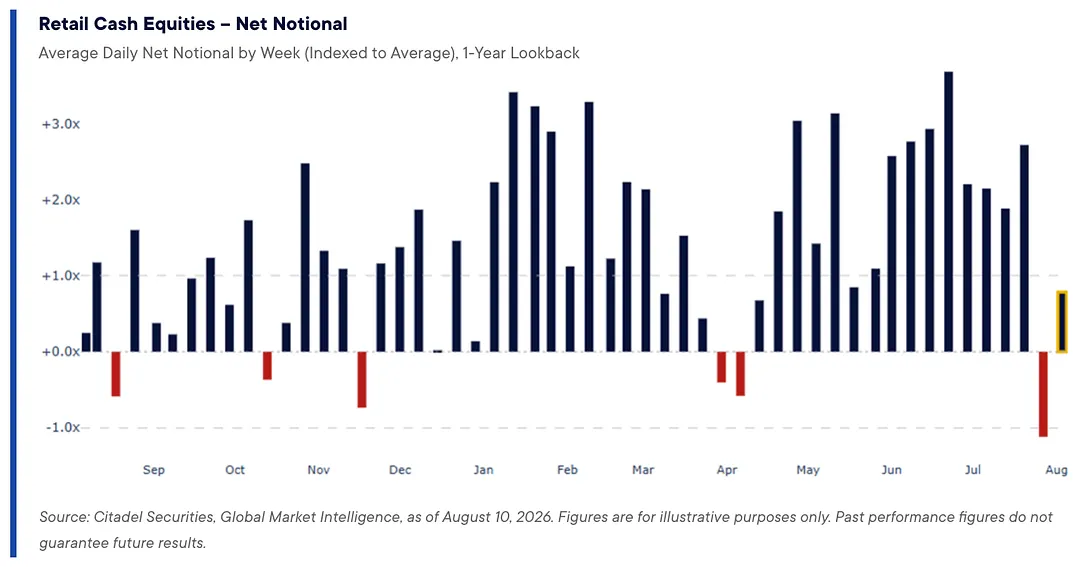
Retail returned as a net buyer across Citadel’s platform last week, reversing the selling at the end of June.
The cash-equity capitulation impulse has faded and participation is rebuilding. But the more interesting signal is in options.
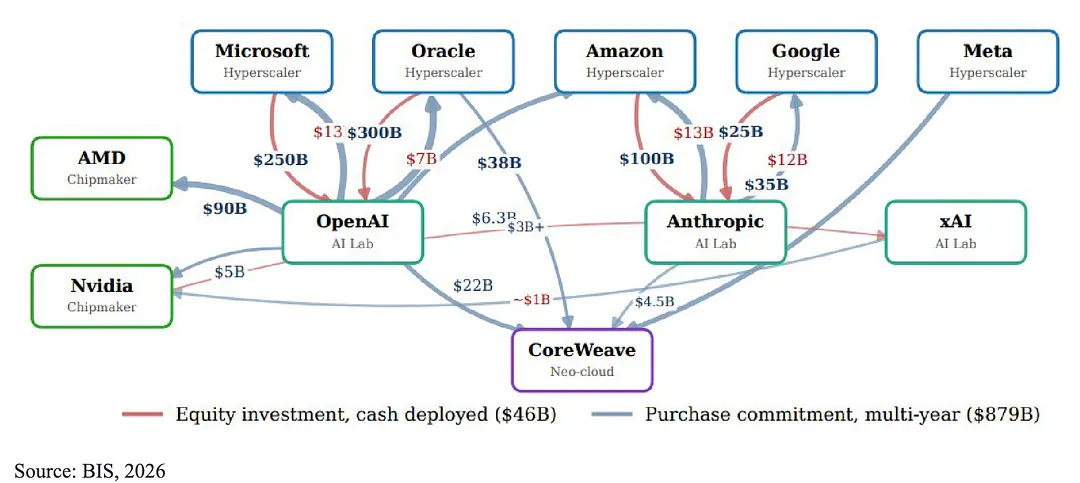
Five hyperscalers, three AI labs and one neo-cloud are now wired together by $925 billion in equity stakes and purchase commitments. Regulators want to know what happens if one link in that chain breaks.
BIS likens this to past investment booms: hyperscaler capex should top $700 billion this year, maybe trillions later, as competition outpaces what makes economic sense. Much of it runs on debt and circular deals, the same firms investing in and buying from each other, which BIS says could add fragility.
IMF flags a related risk: AI is shaping how firms price risk and allocate credit. The worry is stress, not calm markets, when models react fast and alike. Its asks: oversight of AI trading, visibility into correlated models, cross-border coordination.
No crisis today, but policymakers are moving before one hits, not after.
5 notes
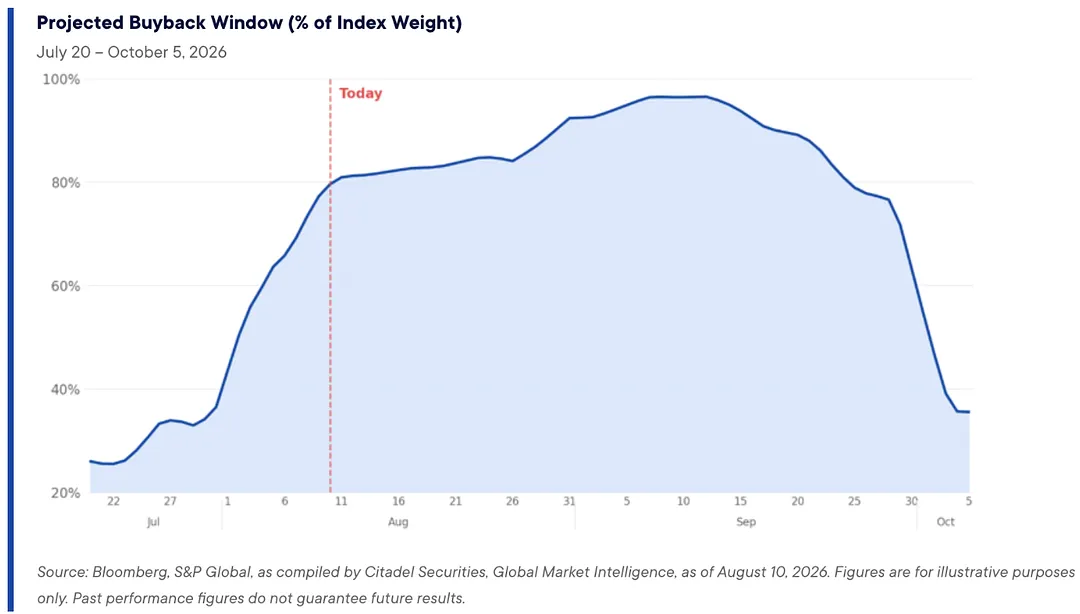
The corporate buyback window reopens this week with more than $1 trillion of announced authorizations, the largest amount on record at this point in the calendar.
August has historically been one of the stronger months for execution. Buybacks should exceed equity issuance and continue to absorb supply.
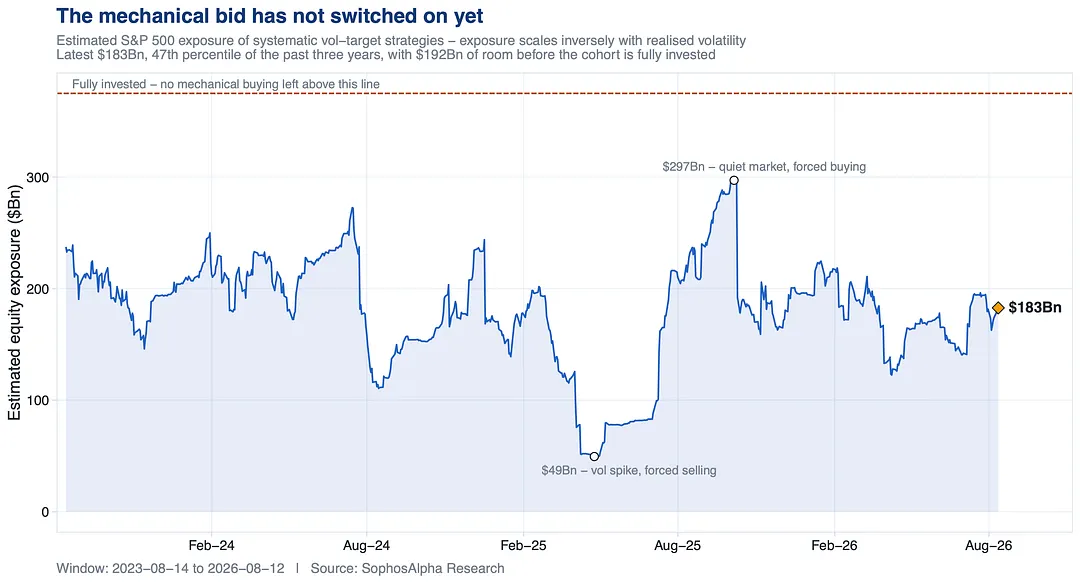
They trimmed over the past month, not added, because realised vol crept up.
A 14 handle on the VIX doesn't switch this bid on. Realised vol falling does.
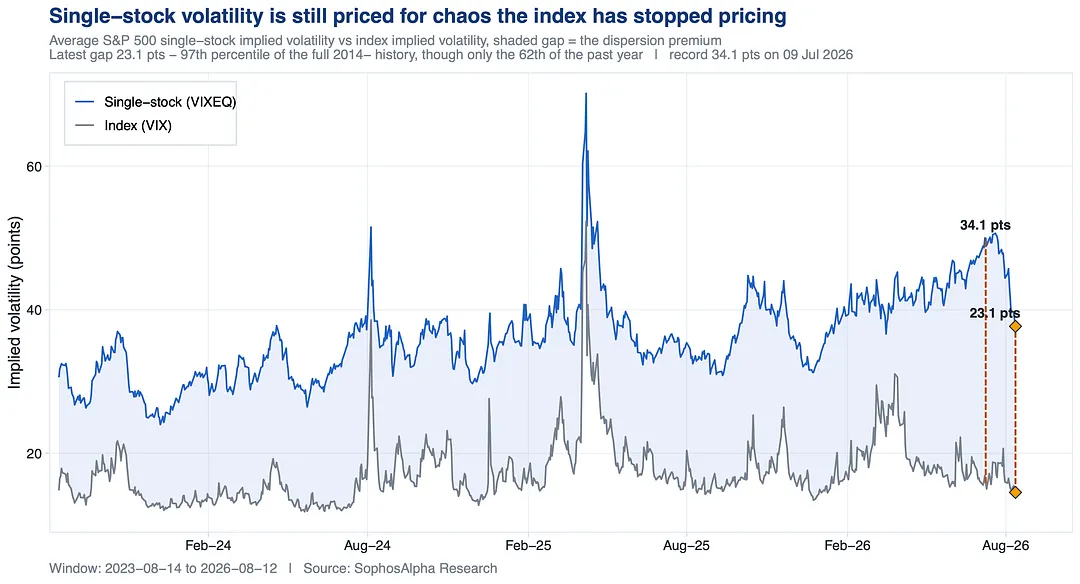
It means they stopped moving together. Average single stock vol is still 37.7, a gap over the index wider than 97% of readings since 2014.
The index isn't quiet because its stocks are quiet. It's quiet because they disagree.
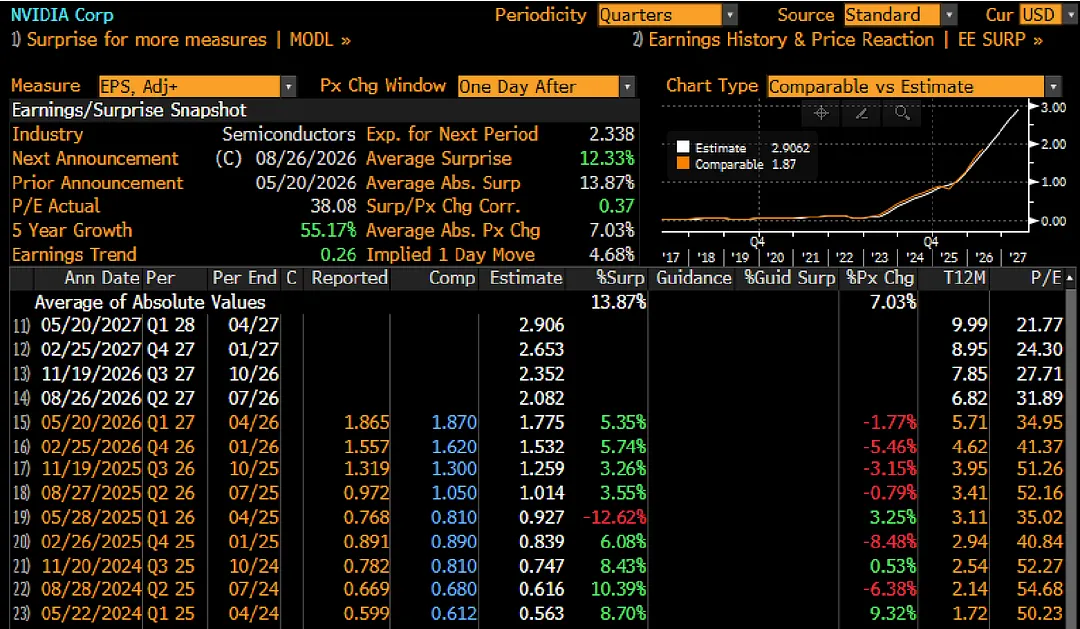
69% of S&P500 members now trade above their 200-day moving average, up sharply from the low 40s just months ago.
One and three month realized correlations are near all-time lows too, a sign this rally is broadening out.
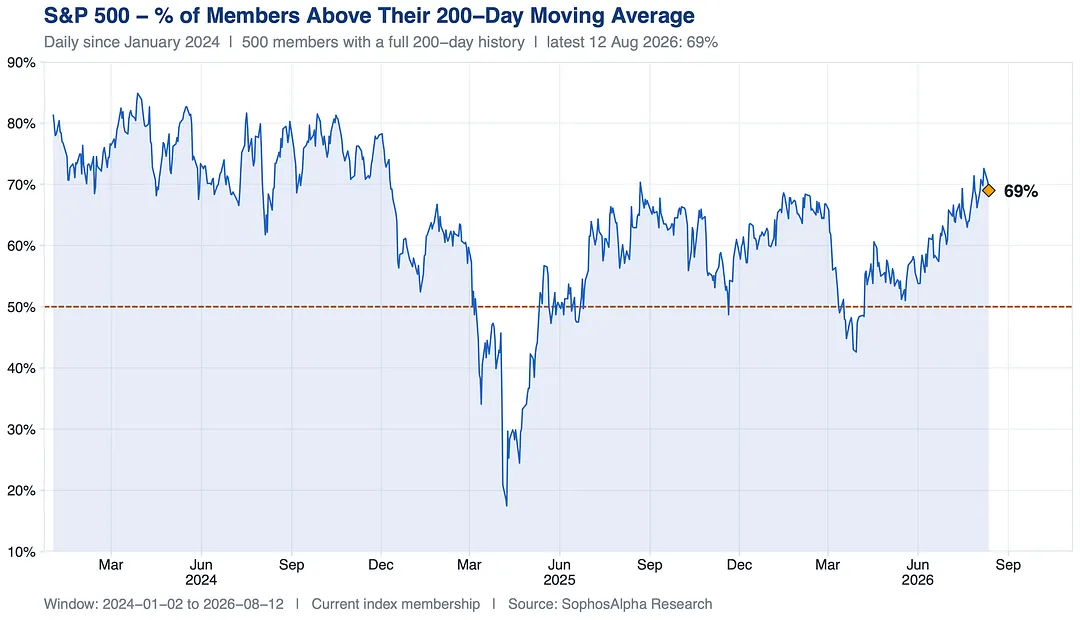
The stock reports earnings later this month (8/26). Nvidia's multiple has continued to compress, now trading around 14.4x CY27 EPS estimates, as investors debate how durable this scale of growth and margins really is (estimated revenue near $635bn in CY27, a notably larger base than mega cap peers like MSFT, AAPL, or GOOGL).
Into the print, expectations point to a solid quarter with room for upside to guidance, backed by tight GPU supply and demand.
That said, the bar is elevated after the stock's 12% move in two weeks. Key focus points on the call: the pace of the Rubin product ramp in the second half, potential upside from agentic AI reaching CPUs, and future gross margin trends.
4 notes
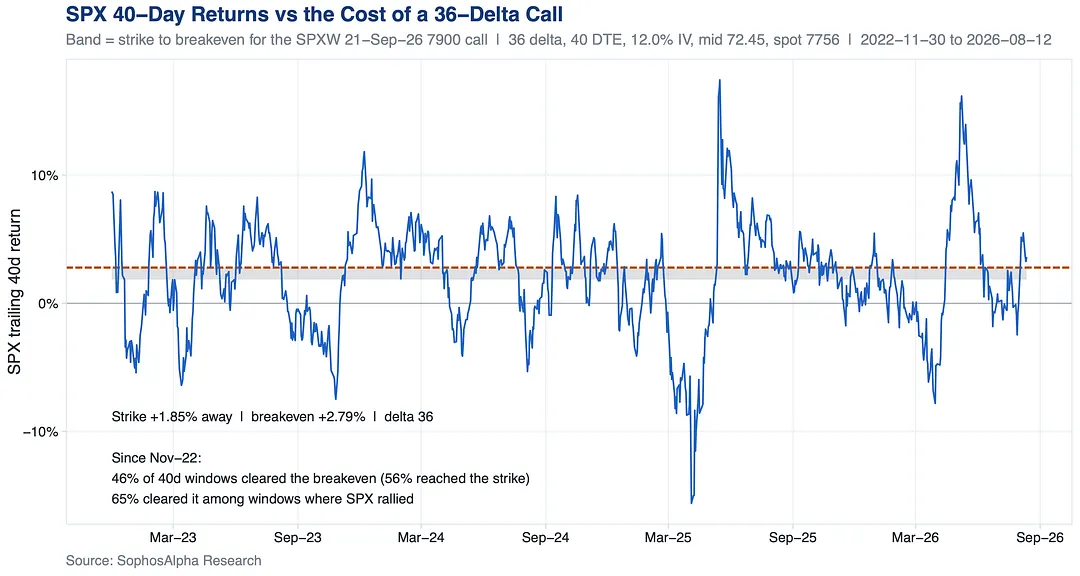
A September 7900 call sits under 2% above spot and needs a 2.8% rally to pay. The market prices that at roughly 1 in 3.
Since ChatGPT launched, the S&P has cleared it closer to 1 in 2.
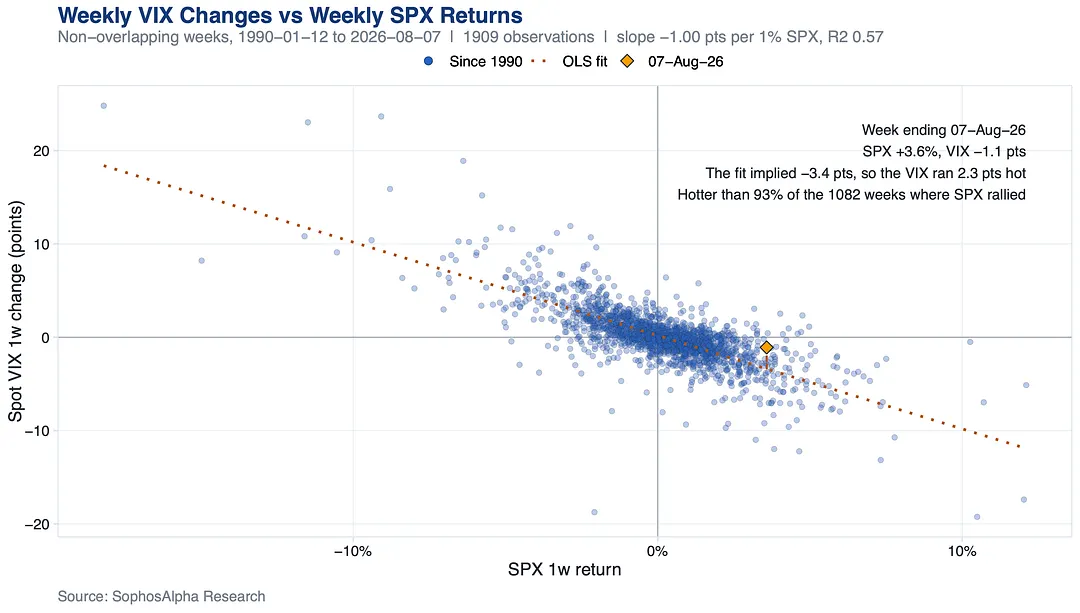
Since 1990 there have been 151 weeks with a rally that size. The typical one took 3.6 points off the VIX. This one took 1.1.
Vol isn't buying the move.
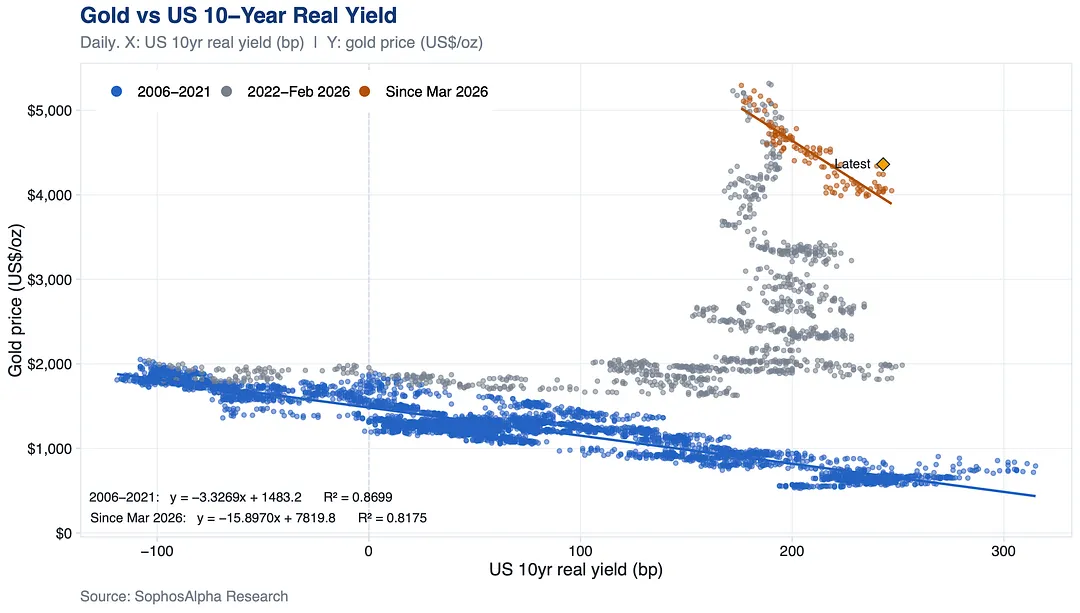
Since March, gold has tracked the 10yr real yield almost linearly, a relationship nearly 5x steeper than what held from 2006-2021.
The fundamental view remains on the upside in the long term, with central bank buying accelerating on every dip.
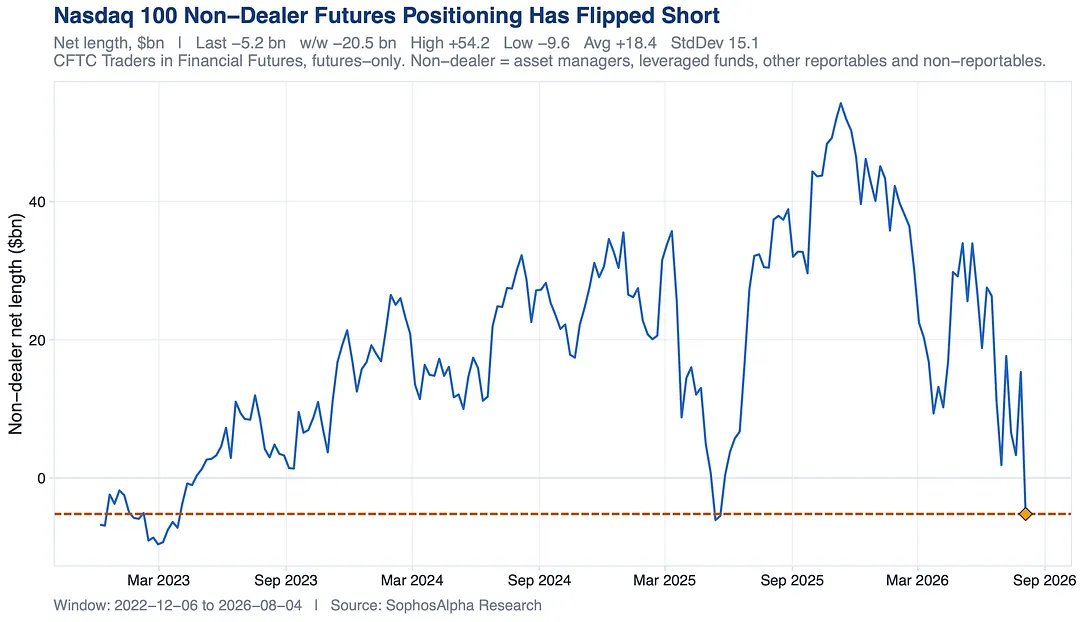
Non-dealer net length fell $20.5bn last week to -$5.2bn, flipping net short for the first time since May 2025. Net short prints are rare here, mostly clustered in the 2022-23 bear market.
3 notes
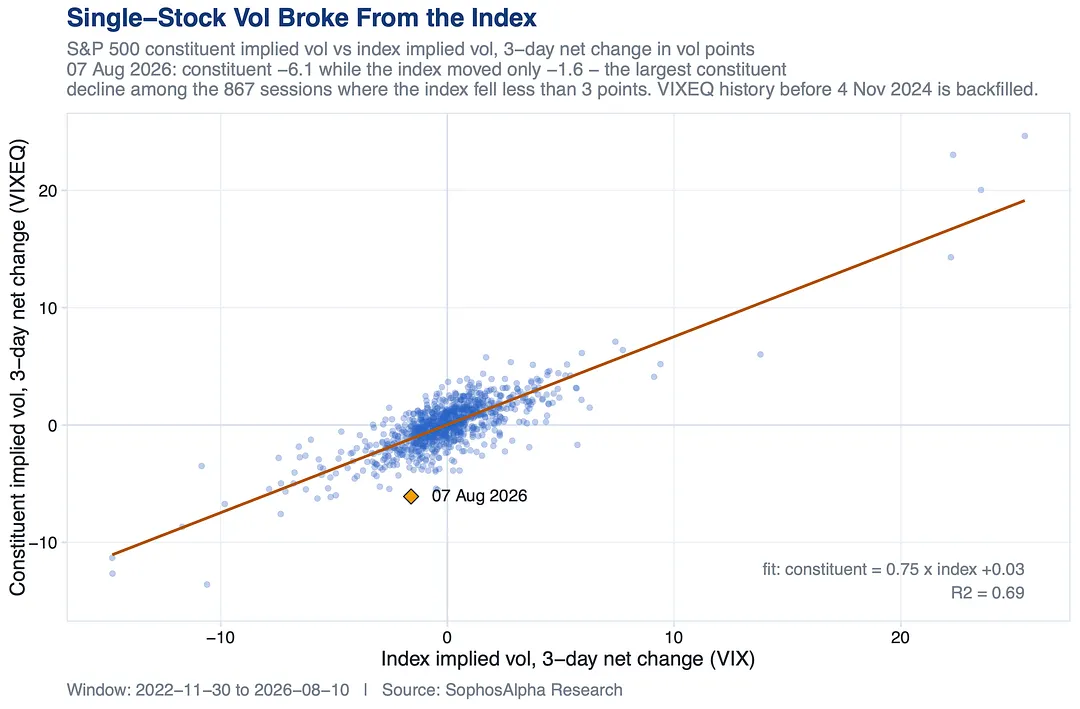
Index implied vol fell only 1.6pts over 3 sessions, while single-stock implied vol fell 6.1pts, the biggest such gap since Nov 2022 on days the index was this calm. A repricing of single-name risk, not macro risk.
It looks like a market resisting positioning ahead of exceptional earnings growth, then bursting higher once the numbers land.
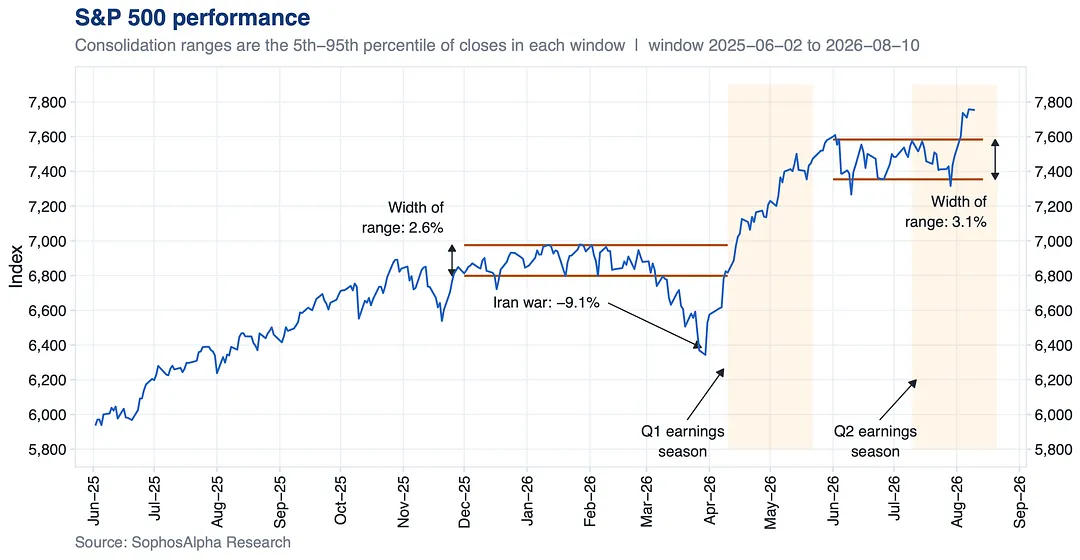
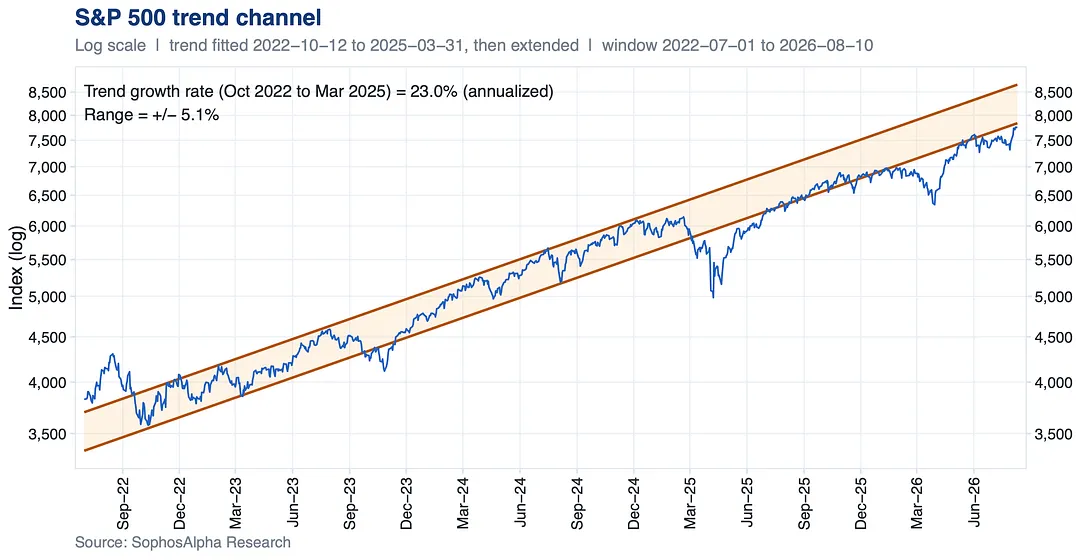
After dipping below it, price has rallied straight back to the bottom of the band, the same catch up pattern seen repeatedly since last year's tariff shock.
3 notes
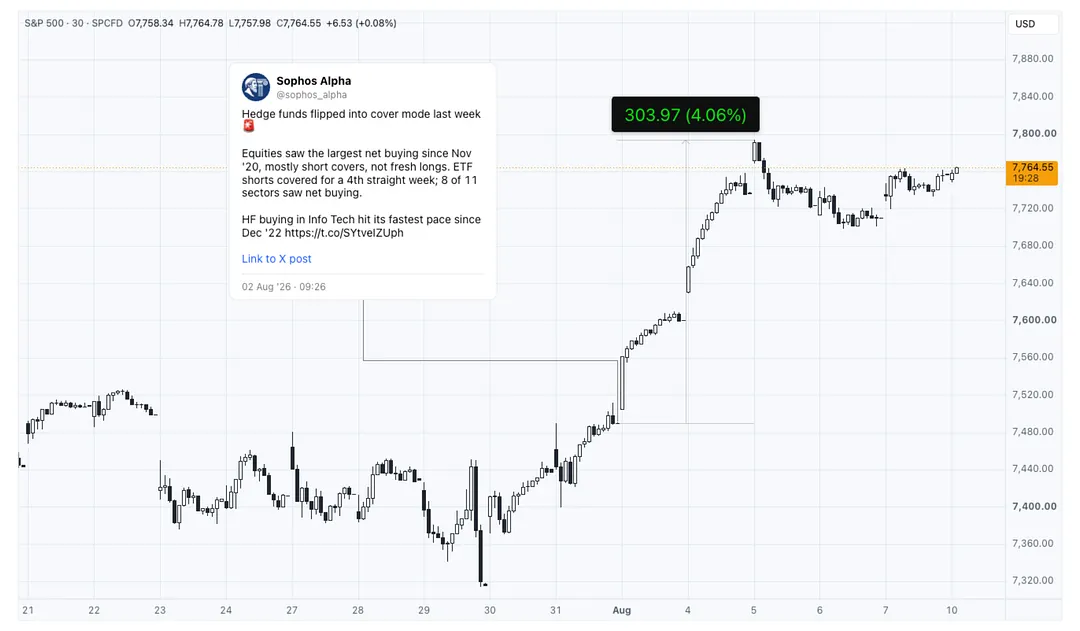
SPX is +4.06% since. Understanding the mechanical flows that move markets is crucial.
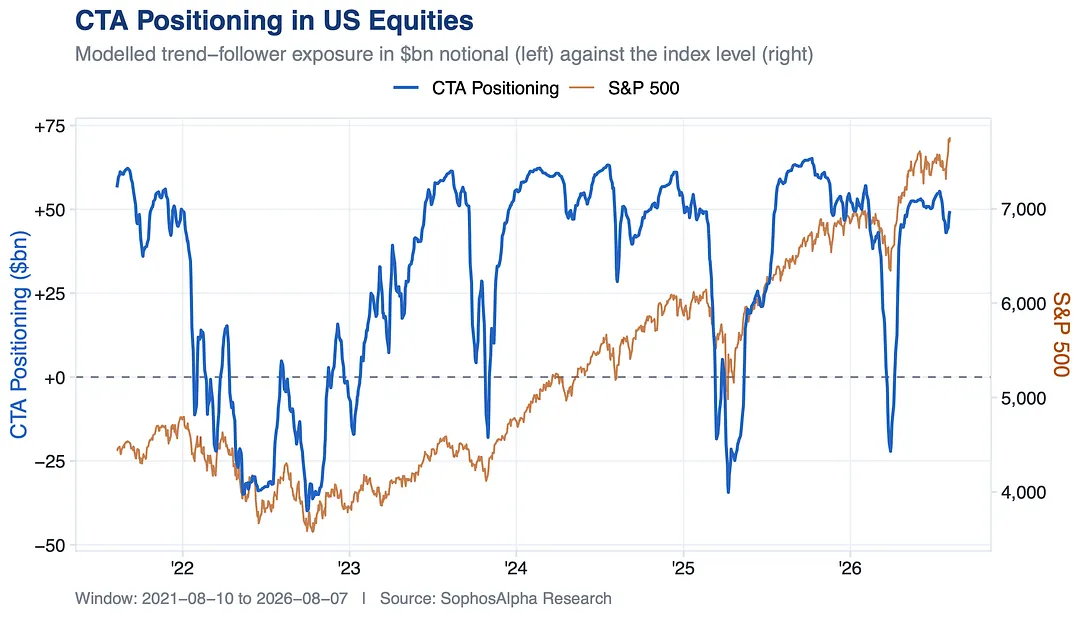
CTA equity longs are already climbing back, and this time Asia is leading the charge.
Much of the CTA de-risking from a couple weeks back looks reversed. Medium and longer term trend followers have rebuilt long Nasdaq exposure and added to Japan, Korea, and Taiwan on the Asian buying setup flagged earlier.
That said, the fastest-moving trend followers remain notably less bullish than slower movers across US equities and the Nikkei, still feeling the effects of the mid-July drawdown.
Systematic flow risk now looks balanced globally, with buying concentrated in Asian equities on flat to up days. Sell triggers have also moved further away, needing a decline of more than 4% to spark meaningful CTA selling across the indices tracked.
Key takeaway: Trend-following flow has flipped from a headwind back to a tailwind, but positioning still has room to build before matching prior cycle highs, leaving scope for further systematic buying if price keeps grinding higher.
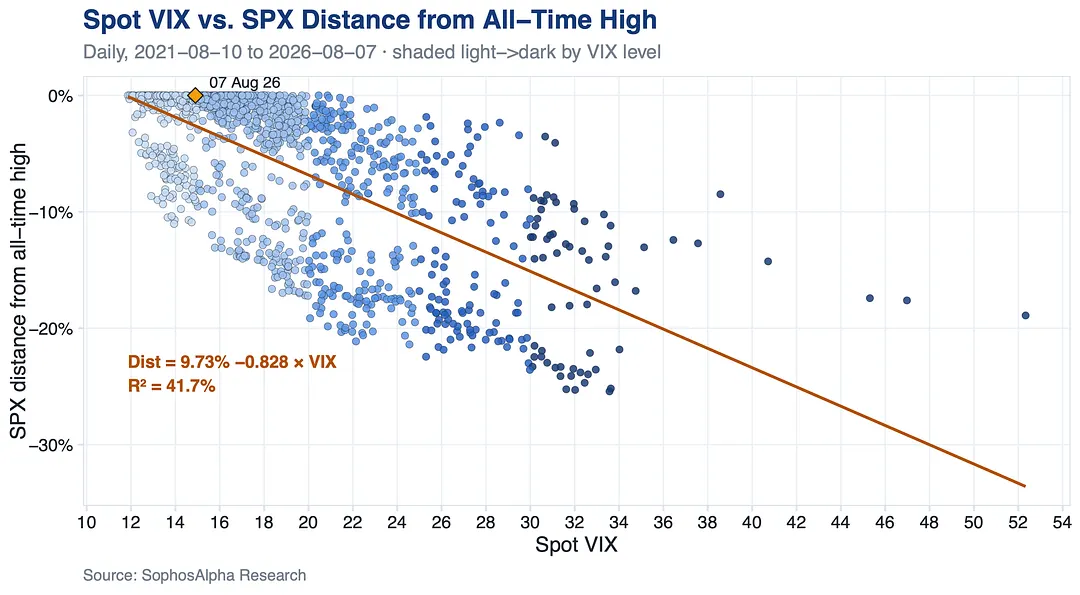
Comparing spot VIX to SPX's distance from its ATH, current vol sits above the long run trend, a sign the market is still pricing in chop even as price keeps climbing.
one note
one note
2 notes
Most trend followers, such as CTAs, ignore the "fundamental noise" that can exist short-term in the market. "News" is not part of the algorithms. We still estimate systematic funds hold extended exposure in US.
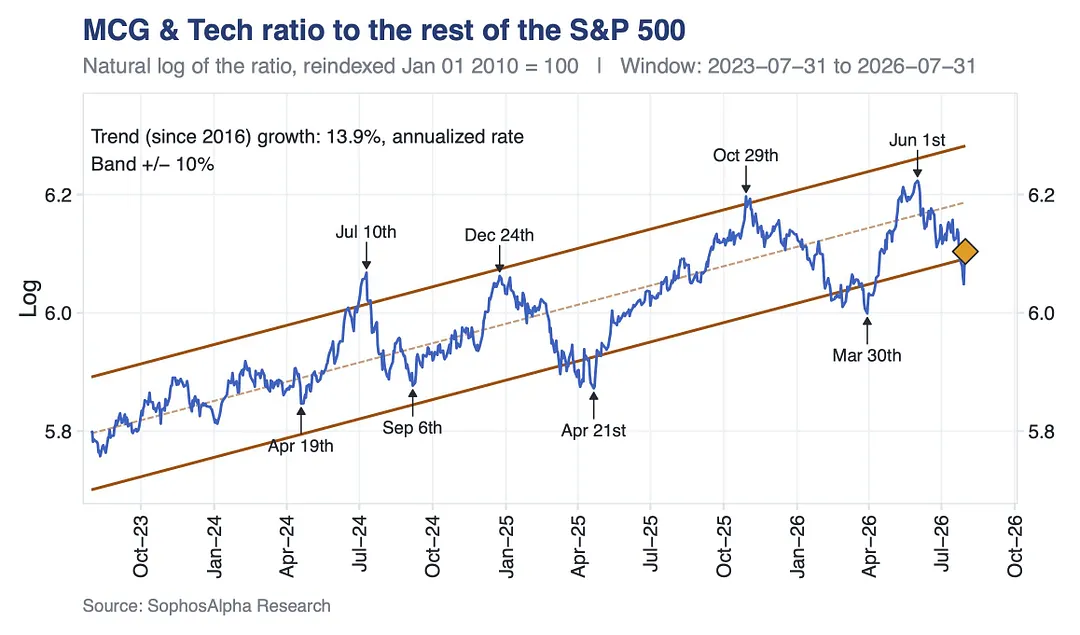
MCG & Tech's strength vs the rest of the SP500 keeps living inside one rising channel: rip to the top, drift to the bottom, repeat. It just topped out again and is now testing support at the bottom of the band.
one note
ETF shorts were net covered for a 4 th straight week, while 8 of 11 sectors were net bought (except HC/Utilities/Staples).
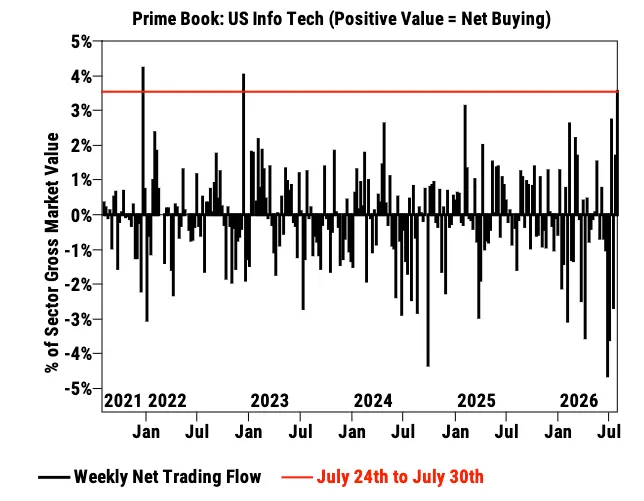
Amid a busy week of earnings, hedge funds net bought US Info Tech stocks at the fastest pace since Dec ’22, driven by long buys as well as short covers. -GS